Printed in Brazil - ©2006 Sociedade Brasileira de Química 0103 - 5053 $6.00+0.00
A
r
ti
c
le
* e-mail: [email protected]
Relationship between the Dielectric and Mechanical Properties and the Ratio of Epoxy Resin
to Hardener of the Hybrid Thermosetting Polymers
Newton Luiz Dias Filho,* Hermes Adolfo de Aquino, Geovanna Pires and Laércio Caetano
Departamento de Física e Química, Universidade Estadual Paulista, Av. Brasil, 56 - Centro, CP 31, 15385-000 Ilha Solteira - SP, Brazil
Foi investigada a relação entre as propriedades dielétricas (constante dielétrica, ε’; fator de perda, ε”; energia de ativação, Ea) e a proporção de resina epóxi (OG) para endurecedor em
polímeros termorrígidos de resina epóxi (OG). A amplitude do pico de ε” decresce com o aumento da porcentagem em massa de OG até aproximadamente 73% e aumenta levemente para maiores % OG. A temperatura da posição do pico de ε” aumenta com o aumento da % OG, alcançando valores máximos para formulações no intervalo de 67 a 73%, e então, decresce acentuadamente para maiores % OG. A energia de ativação obtida por relaxação dielétrica aumentou com a % OG até aproximadamente 70%. Um aumento adicional na % OG até 83% reduz a Ea. As curvas das propriedades mecânicas de módulo de tensão e resistência à fratura como função da % em massa de OG apresentaram um comportamento similar.
The relationship between the dielectric properties (dielectric constant, ε’, and loss factor,
ε”; activation energy, Ea) and the ratio of epoxy resin (OG) to hardener of the epoxy resin thermosetting polymers was investigated. The amplitude of the ε” peak decreases with increasing OG content until about 73 wt.% and slightly increases at higher OG content. The temperature of the position of the ε” peak increases with the increasing of OG content, reaching maximum values for compositions in the range of 67 and 73 wt.%, and then it decreases sharply at higher OG content. The activation energy obtained from dielectric relaxation increased with increasing wt.% OG up to around 70 wt.%. Further increase in concentration of OG up to 83 wt.% reduced Ea. The curves of tensile modulus and fracture toughness mechanical properties as a function of OG content presented a similar behavior.
Keywords: dieletric relaxation, dielectric analysis, epoxy resin, thermosetting materials
Introduction
Although thermosetting polymers offer good process ability and relatively low cost compared to metals or ceramics, and good thermal, electrical and mechanical properties, they often face applications limitations because they are brittle and have poor resistance to the crack
propagation.1-7 To overcome these drawbacks, many types
of polymer-filler composites have been developed, in which the epoxy resins are reinforced with modifying agents, such as fillers, polyhedral oligosilsesquioxanes
(POSS), dendrimers etc.8-18
Polyhedral oligomeric silsesquioxanes (POSS),
(RSiO1.5)n with n = 6, 8, 10 ...., are nanoplatforms with 1
to 8 reactive or nonreactive organofunctional groups (R) anchored to the possible eight vertexes of the cubic silsesquioxane. Octahedral POSS (n = 8) are the most
important members of this family.15-17 In the POSS, the
cubic silica core are “hard particles” rigid with 0.53 nm diameter and a spherical radius of 1-3 nm including
peripheral organic units.14-18
The polymerization of the hybrid epoxy resin studied in this work, which is a nanosized epoxy resin and is classified as a POSS, can lead to nanocomposite materials. In these materials the cubes of the cubic siloxane can be connected one another by organic components with known architecture and lengths of the order of 3-5 nm, forming composites with completely defined interfacial component
between organic and inorganic phase.19-26
when it is subjected to an alternating electric field.27-37 In
dielectric analysis, the capacitance and conductance of a material can be measured as a function of time, temperature, and frequency. This allows the determination of electrical polarization and conduction of the material. In an electric field, dipoles tend to align themselves along the direction of the field, while ions move toward the electrodes and form layers. Before the curing reaction starts, dipoles and ions can move freely. After the curing process, ions lose their translational mobility and dipoles lose their rotational mobility. Such change in ionic and dipolar mobilities leads to the development of a peak in the loss factor (ε”) curve.27, 28
The dielectric relaxation of epoxy-amine systems has
been discussed at length by Fitz and Mijovic.35 The α
process is associated with segmental motions of the terminal
epoxy groups while the β process results from the localized
motions. The higher activation energy relaxation (the α
process) first appears in the early stage of reaction as a
low-frequency shoulder on the αβ peak and then proceeds
to separate out. The β process is much less affected by the
progress of reactions and it is located in the high megahertz range. Generally the height of the loss peak for the a process decreases with increasing temperature and shifts to higher frequency for epoxy-amine systems.
The development of a relationship between a dielectric property (e.g. dielectric relaxation, loss factor) and the ratio of epoxy resin to hardener of the thermosetting polymers is a means of understanding the relaxational behavior as a function of formulation stoichiometry and its relationship with the mechanical properties.
In the present work, the dielectric relaxation behavior of organic/inorganic hybrid thermosetting materials was studied.
Experimental
Materials
Tetraethoxysilane Si(OEt)4, tetramethylammonium
hydroxide (CH3)4NOH, dimethylchlorosilane Si(CH3)2Cl,
allyl glycidyl ether, and platinum dicyclopentadiene Pt(dcp), triphenylphosphine and methylenedianiline (MDA) were purchased from Aldrich Chemical Company
and used as received. Hexane and methanol was purchased from Lancaster Synthesis Company and used without further purification.
Synthesis of octaanion solution, [Me4N+] 8 [SiO2.5
–] 8
[Me4N+]
8 [SiO2.5 –]
8 was synthesized following a
procedure previously reported.19,38-41 A schematic
representation this reaction is shown in Figure 1. To a 2L round bottom flask equipped with a magnetic stir bar, were added 800.8 mL (7.60 mol) tetramethyl-ammonium hydroxide (25 wt.% in methanol), 390.8 mL (9.92 mol) methanol, and 292.8 mL (16.26 mol) distilled water. The flask was cooled in an ice bath, and the system was maintained under nitrogen. Then 428 mL (1.91 mol)
tetraethoxysilane was added via an addition funnel. The
solution turned cloudy and was allowed to stir at room temperature overnight to produce a clear solution of tetramethylammonium octaanion in quantitative yield.
This solution was characterized by 29Si NMR, showing
one peak at -99.4 ppm.
Synthesis of octa[hydridodimethylsiloxy]octasilsesquioxane, [HMe
2SiOSiO1.5]8
[HMe2SiOSiO1.5]8 was synthesized following published
procedures.19,38-41 The Figure 1 shows a schematic
representation this reaction.
To a 5 L bottom flask equipped with a mechanical stirrer, were added 2600 mL hexane and 436 mL (4.0 mol) dimethylchlorosilane under nitrogen. The flask was placed in an ice bath and 1000 mL of octaanion solution was then
added via an addition funnel over a 2h period. The final
mixture was stirred continuously for another 2h. The two layers were separated with a separatory funnel. The hexane layer was dried over sodium sulfate, gravity filtered and solvent was removed by rotary evaporation to yield a white powder. This powder was rinsed with methanol and collected by vacuum filtration. The product was dried in a vacuum oven at 70 °C for 5h to yield 89 g white powder (70% of
theoretical). This material was characterized as follows: 1H
NMR showed a multiplet at 4.73 (m, 8H, CH3-Si-H) and
doublet at 0.26, 0.25 ppm (d, 48H, CH3-Si-H) ppm. 13C NMR
Figure 1. Schematic representation of preparation of the octaanion solution, [Me4N+] 8 [SiO2.5
–]
revealed one peak at 0.059 ppm (H-Si-CH3). 29Si NMR
showed two peaks at - 2.897 ppm (H-Si-CH3) and -108.697
ppm (Si-O4). GPC, Mn = 995, Mw = 1008, PDI = 1.01 ,
calculated Mw = 1017 g mol-1. FTIR (KBr) ν
max/cm -1: 2966
(ν C-H), 2144 (ν Si-H), 1258 (ν Si-CH3), 1096 (n Si-O).
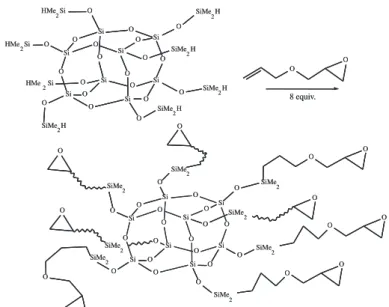
Synthesis of octa[dimethylsiloxypropylglycidylether] octasiloxane (OG)
The synthesis of OG followed published procedures.19,41
A schematic representation this reaction is showed in the Figure 2.
To a 500 mL schlenk flask equipped with a magnetic stir bar and a condenser, was added 120.0 g (~0.12 mol)
octahydrido spacer cube, [HMe2SiOSiO1.5]. The flask was
evacuated and refilled with N2 gas three times at 50 °C. Then
132.0 mL (0.99 mol) allyl glycidyl ether was added to the
solution followed by 0.3 mL of 2.0 mmol L-1 solution of
platinum dicyclopentadiene [Pt(dcp)] and the reaction was heated at 90 °C. Triphenylphosphine, 10 mg, was then added to deactivate the [Pt(dcp)] catalyst and the toluene solvent was removed by rotary-evaporation. Yield: 210 g (91% of theoretical). This material was characterized as follows:
1H NMR(CDCl
3) δ CH2O(CH2)3 diastereotopic 3.55, 3.30
(dd, J 3,27 Hz, 8H) (due to peak overlap, all resonances
between 3.34 and 3.16 are integrated as two peaks, 24H),
3.30, 3.28 (dd, J 2.89 Hz), SiCH2CH2CH2O 3.18 (m, 8H),
OCH2CH (epoxy) 2.93 (m, 8H), CH2 (epoxy) diastereotopic
2.58 (dd, 8H), 2.40 (dd, 8H), SiCH2CH2CH2O 1.48 (m,16H),
SiCH2CH2CH2O 0.47 (m, 16H). 13C NMR (CHCl
3) δ
SiCH2CH2CH2O 74.29, CH2O(CH2)3 71.86 , OCH2CH
(epoxy) 51.11, CH2 (epoxy) 44.35 , SiCH2CH2CH2O 23.59,
SiCH2CH2CH2O 13.93, (CH3)2SiCH2 0.00 ppm. 29Si NMR
(C6D6) δ (CH3)2SiCH2 -7.3, SiOSi(CH3)2CH2 -129.4 ppm.
GPC, Mn = 1850, Mw = 1898, PDI = 1.02 , calculated Mw =
1931 g mol-1. FTIR(neat film) ν
max/cm
-1: ν C-H = 3035,
2962, 2934, 2874 (m); ν Si-H = 2142 (m); ν Si-CH3 e ν C-O
= 1250-1260 (s); ν Si-O = 1095 (vs); δ C-O-C = 902 (s).
Curing process
OG is a viscous liquid and MDA is solid at room temperature. The structures of the OG and MDA are shown in the Figures 2 and 3, respectively.
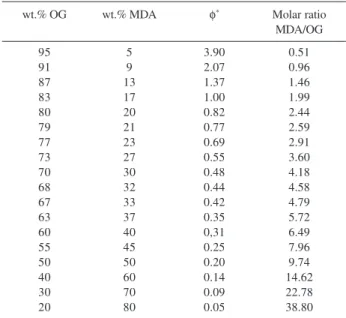
In the present investigation, samples having different amount of OG and MDA were prepared. In formulating
samples, the molar ratio φ is defined as the ratio of epoxy
ring to amine hydrogen (φ = no. of epoxy rings in
OG/no. of amine hydrogen in MDA).
A conventional stoichiometric ratio of 1 mol of epoxy resin in OG (1 mol of OG contain 8 mol of epoxy rings) to 2 mol of amine (2 mol of MDA contain 8 amine
hydrogen) would occur for φ = 1. Thus, when φ = 1, the
two components are mixed at stoichiometric amount of 83 wt.% of OG and 17 wt.% of MDA.
For curing optimization tests, samples were cured at different temperatures and times to study the cure condition. OG/MDA samples were cured in the temperature range of 100-200 °C and for periods of 2 to 12 h. In the present study curing for 10h at 150 °C was adopted for the composites OG/MDA.
Figure 3. Scheme of the structure of the curing agent 3,3-methyl-enedianiline (MDA).
OG and MDA were weighed into an aluminum pan with a diameter of 61.5 mm and depth of 18 mm and mixed by hand at room temperature. The mixture was then put into
an oven preheated to ~150 °C under vaccum. After
degassing for 10-15 min and no more bubbles emerged from the mixture, the content was transferred to an aluminum mold preheated to 150 °C. The filled mold was placed in an oven and heated under nitrogen for 10 h at 150 °C for curing the mixture. After the mold cooled, the sample was removed and kept in a sealed desiccator before the dielectric analysis and mechanical tests were performed.
The compositions of samples are shown in Table 1. A schematic representation of composites with discontinuous organic-organic phases from cubic silsesquioxane is shown in Figure 4.
Mechanical testing
Samples removed from the aluminum mold had rough edges due to the overflow of polymer. These edges were polished using a polish wheel with 120-grit SiC paper. After polishing, the samples were ready for mechanical testing. The average dimensions of the samples were 3.0
× 13.0 × 170 mm. (errors < ±0.2 for width and thickness
and < ±0.4 for length).
The elastic moduli (tensile moduli), E,data were
obtained using an Instron 4502 screw driven mechanical testing machine. The dimensions of each sample were determined by measuring the width and thickness at three points along the gauge length prior to the test. These were used to calculate the averages of width and thickness for each sample. The elastic moduli were obtained following ASTM standard [No. E111(1997)]. The samples were clamped using anti-slackening screw grips with added friction increasing pads. Care was taken to ensure that the
tensile and sample axes were co-axial. The cross-head
displacement rate was set at 1 mm min-1. The tensile tests
were stopped when the samples were in the elastic deformation region. Usually, tests were stopped at loads of about 200 – 250N. Samples with very low modulus would break before reaching this load. The data acquisition software collected load-displacement data points at a speed
of 2 points per second.
The critical stress intensity factor (fracture toughness) was obtained following ASTM standard [No. E399(1990)]. This standard requires that the ratio of width to thickness be between two and four, and the ratio of the pre-crack to sample between 0.45 and 0.55. The pre-crack was introduced using a fresh razor blade tapped into a square
Figure 4. Scheme of a general representation of composites with discontinuous organic-organic phases from cubic silsesquioxane. X = links between cubes. Table 1. Formulations for OG/MDA composites
wt.% OG wt.% MDA φ* Molar ratio
MDA/OG
95 5 3.90 0.51
91 9 2.07 0.96
87 13 1.37 1.46
83 17 1.00 1.99
80 20 0.82 2.44
79 21 0.77 2.59
77 23 0.69 2.91
73 27 0.55 3.60
70 30 0.48 4.18
68 32 0.44 4.58
67 33 0.42 4.79
63 37 0.35 5.72
60 40 0,31 6.49
55 45 0.25 7.96
50 50 0.20 9.74
40 60 0.14 14.62
30 70 0.09 22.78
20 80 0.05 38.80
notch sawed to 0.1 - 0.2 of the sample width. This method introduces a natural crack into the sample. Then the sample was loaded into the testing apparatus in the same manner as described above for Young’s modulus measurements. The sample was then loaded to failure and the breaking load recorded. The critical stress intensity factor was determined from the standard relationships:
where Pb is the load at break, B is the sample thickness, w
is the sample width, and a is the pre-crack length.
NMR and FTIR analyses
Solution NMR analyses. All 1H and 13C NMR analyses were
done in CDCl3 and recorded on a BRUKER DRX 400
spectrometer. 13C NMR spectra were obtained at 100.6 MHz
using a 27027 Hz spectral width, and a relaxation delay of
0.6 s. 1H NMR spectra were collected at 400.1 MHz, using a
3591 Hz spectral width, and a relaxation delay of 1 s.
Solid state NMR analyses.All 29Si NMR (59.5 MHz) and
13C NMR (75.4 MHz) solid state analyses were recorded
on a Varian INOVA 300 spectrometer. The samples were packed in zirconia rotors and spun at the magic angle at
4500 Hz, after a relaxation delay of 10.0 and 6.0 s for 29Si
and 13C respectively. All chemical shifts are reported in
units (ppm) using TMS as external reference.
Gel permeation chromatography (GPC). GPC data were
measured using a Waters GPC system, equipped with differential RI and UV detectors, a Styragel column set, and a data capture unit. The system was calibrated using polystyrene standards, and THF was used as the eluent.
Fourier transform infrared spectra was recorded on a Nicolet 5DXB FT-IR 300 spectrometer. About 600 mg of KBr were ground in a mortar and pestle, and a sufficient quantity of the solid sample was ground with KBr to produce a 1 wt.% mixture resulting in pellets. Liquid samples were cast on salt plates. A minimum of 32 scans
was collected at a resolution of 4 cm-1.
Dielectric measurements (DEA)
Dielectric relaxation experiments were performed using a Hewlett Packard Impedance and Gain Phase
Analyser 4192A. All films had a layer of aluminum evaporated on both surfaces to serve as electrodes. Sample thickness of about 1mm was used. The aluminum-coated
films were installed in a closed (~10-2 Torr vacuum),
temperature controlled cell of parallel plate geometry. The
capacitance, C, and loss factor, tan δ, of the samples were
measured over a frequency range from 10 to 1000 kHz,
from room temperature to 170 oC.
Results and Discussion
Relaxation dielectric
The real (ε’) and imaginary (ε”) parts of the dielectric
function are determined from the measured quantities according to:
ε’= Cd/Aεo
ε”= ε’ tan δ
where C is the capacitance, d is the film thickness, A is
the electrode area, and εo is the permittivity of free space
(εo = 8.85 × 10 -12 F/m). ε’ is the permittivity and measures
the polarization of the material; ε” is the loss factor and
is related to the energy loss and the conductive nature of the sample.
The OG/MDA composites were obtained from curing of octa[dimethylsiloxypropylglycidylether] octasiloxane (OG) in presence of 3,3-methylenedianiline (MDA).
Permittivity (ε’) and loss factor (ε”) as a function of
temperature at several OG contents were measured in the
temperature range 25-170 oC, varying the frequency from
10 to 1000 kHz.
Figure 5 shows an example of a plot of the permittivity
(ε’) as a function of temperature for a formulation with
57 wt.% OG. The ε’ intensity initially increases, reaching
a maximum, and then it decreases with the temperature increase. The peak intensity decreases and shifts to higher temperature with increasing frequency, indicating that the process is termically actived.
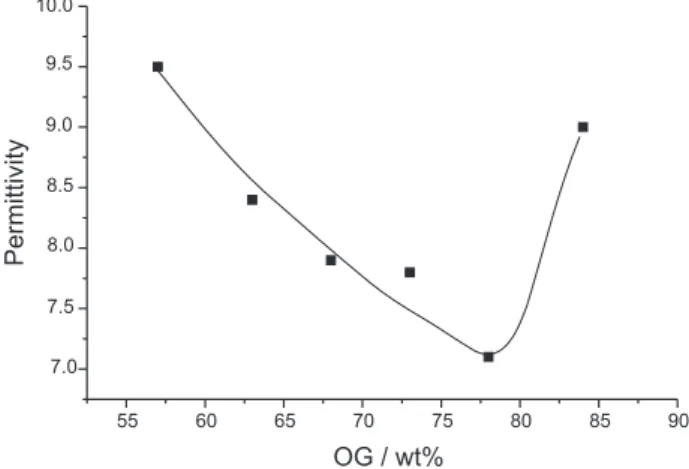
Figure 6 shows the variation in the intensity of the ε’
peak as a function of OG content for the OG/MDA composites
at 50 kHz. The height of the ε’ maximum decreases with
increasing OG content until about 77 wt.%, then sharply increases until 83 wt.%. For the other studied frequencies
the curves of the variation in the intensity of the ε’ maximum
as a function of OG content show the same profile. Figure 7 shows an example of a plot of the loss factor
(ε”) as a function of temperature for a formulation with
reaching a maximum whose peak position shifts to higher temperature with increasing frequency.
Figure 8 shows the variation in the intensity and
temperature position of the ε” peak as a function of OG
content for the OG/MDA composites at 50 kHz. The
amplitude of the ε” peak maximum decreases with
increasing OG content until about 73 wt.% and slightly increases at higher OG content. The temperature of the
position of the ε” maximum increases with the increasing
of OG content, reaching maximum values for compositions in the range of 65 and 75%, and then it decreases sharply at higher OG content. For the other studied frequencies the curves of the variation in the intensity and temperature
position of the ε” maximum as a function of OG content
show the same behavior.
The conclusion we may draw from these results is that with increasing of the MDA content in the OG/MDA composites increases the number of pendants groups (amount
of the NH2 dipolar groups) and/or decreases cross-link density,
causing increased motion of organic tethers (links between cubes), and subsequently increasing of the ionic and dipolar mobility. The region with OG content higher than 73 wt.% is very slightly affected by increased dipolar mobility. This smaller effect can be explained this way, increasing of the OG content increases the quantity of pendant groups (glycidyl units), likewise, increasing the ionic and dipolar mobility.
This effect is smaller for compositions φ >1.0 because it is
impossible to prepare samples with large excess of glycidyl units. The dielectric relaxation of OG/MDA cannot be
measured because of the viscouslike behavior, i.e., the sample
bar begins to loss its solid integrity and becomes something like a very viscous material.
Assuming that the relaxation process can be modeled by an Arrhenius temperature dependence, the shift in the frequency of the loss peak maximum can be plotted as a function of reciprocal of the measurement temperature for several OG/MDA samples. The data can be fit to a straight line whose slope is the activation energy parameter for the alpha relaxation process. Figures 9 shows an example of
the Arrhenius plot obtained by plotting ln ƒmaxversus 1/T,
Figure 5. Example of a plot of the permittivity (ε’) as a function of tem-perature, for a formulation with 57 wt.% OG, at several frequencies (kHz):
10; z 15; Δ 20; 30; ¡ 40; 50; + 76; c 100; 200; × 302; 501.
Figure 6. Variation in the amplitude of the ε’ peak with OG content, at 50 kHz.
Figure 7. Example of a plot of the loss factor (ε”) as a function of tem-perature, for a formulation with 57 wt.% OG, at several frequencies (kHz):
21; z 30; 40; 50; ¡ 76; + 100; × 302 .
where ƒmax is the peak frequency of the loss factor curve, and T the absolute temperature. The slope of the Arrhenius
plot is –Ea/R, where Ea is the activation energy and R is the
gas constant. Activation energy for different compositions were calculated and presented in Figure 10.
It is reazonable to assume that in this region around
70 wt.% OG, related to greater values of Ea, corresponds
to greater energetic barrier of occurring motion of organic tethers (links between cubes).
Relationship between dieletric parameters and mechanical properties
The curve of Ea as a function of OG content presented
in the Figure 10 shows that the activation energy obtained from dielectric relaxation technique increased with increasing wt.% OG up to around 70 wt.%. Further increase
in concentration of OG up to 83 wt.% reduced Ea. A similar
behavior occurs with the mechanical properties of tensile modulus and fracture toughness, as shown in Figures 11 and 12, respectively. Therefore, fracture toughness and tensile modulus mechanical properties, and the activation energies obtained by dielectric analysis show the same profile with respect to OG content, in the sense that they exhibit maxima around 70 wt.% OG.
It is known that for conventional epoxy resin, such as DGEBA (resin based on the diglycidyl ether of bisphenol A), the highest cross-link densities are obtained at stoichiometries where two epoxy ring equivalents are mixed with one amine group equivalent (corresponding to stoichiometric point: the ratio of epoxy ring to amine
hydrogen is 1:1, and φ = 1). Most epoxy thermoset
Figure 9. Example of Arrhenius plots based on non-isothermal dielectric analysis for a formulation with 57 wt.% OG. In this Figure the peak fre-quency of the ε” is plotted on a ln-scale against 1000/T. The slope of the linear fit is Ea/R.
Figure 10. Activation energy (Ea) obtained from dielectric relaxation tech-nique for OG/MDA composites versus OG content.
Figure 11. Tensile modulus (E) for OG/MDA composites versus OG con-tent. Each data point represents an average of at least five samples.
materials exhibit the maximum Young modulus values for
stoichiometries of φ = 1.0 (φ is defined as the molar ratio
of epoxy ring in conventional epoxy per amine hydrogen). Fracture toughness also increases as the amine content
increases below φ = 1.
For the OG/MDA composites the highest cross-link
density which is obtained at φ = 1 implies that the dominating
structure is expected to be the one in which MDA is tetrafunctional on curing, e.g. connecting four cubes.
On the contrary, for the OG/MDA composites, the maximum modulus and fracture toughness are obtained
at φ≈ 0.50 (≈ 70 wt.% OG), and maintains its maximum
modulus up to φ≈ 0.40, which are not compositions where
the highest cross-linked density are reached. This implies that the best mechanical properties are provided by some degree of chain flexibility.
This can be tentatively explained based on the fact that before occurring the complete reaction and cross-link between all the amines and epoxy rings, it becomes very difficult for un-reacted functional groups to find each other due to increasing of the viscosity during curing. These un-reacted functional groups will remain
as pendant groups. Then, for φ < 1.0, the excess
increasing of MDA causes increased motion of organic tethers (links between cubes) by increasing the number of pendants groups and/or decreasing cross-link density. Other possibility is that the steric hindrance should be greater for bulky OG than for conventional epoxy, such as DGEBA. In this case, the reaction of the first hydrogen
of the NH2 group should be favored over the second one,
resulting an uniform and densely cross-linked structure
that can be obtained at φ ≈ 0.50. In this case, the
dominating structure is expected to be the one in which MDA is bifunctional on curing (linear tethers connecting two cubes).This assumption (MDA is bifunctional connecting two cubes) seems to be favored taking into
consideration that the highest values of Ea (obtained from
dielectric analysis), E (tensile modulus), and K1C (fracture
toughness), occur in a ratio of ~ 4 mol of MDA to 1 mol
of OG corresponding to φ ≈ 0.50.
For instance, when DGEBA is cured with excess MDA the material changes from ductile to a brittle material, both tensile modulus and fracture toughness increase from
φ = 1.0 to φ = 0.5, and, then, they drop significantly.19
Therefore, while epoxy resin/hardener conventional systems become brittle with excess of curing agent
(“Excess” MDA is used for φ< 1.0), OG/MDA composites
become rubbery. At φ≈ 0.14, the modulus data of OG/
MDA cannot be measured because of the rubberlike
behavior. On the other hand, for composition at φ > 2.0
(“Excess” OG) OG/MDA composites become viscous.
Consequently, at φ >2.0, the modulus of OG/MDA cannot
be measured, and no data points are included in Figure 11. This behavior also reflects in the fracture toughness, and no data points for φ < 0.45 and φ >2.0 are included in Figure 12, because it is practically impossible to introduce a natural crack into these samples.
Conclusions
The relaxation dielectric of a thermosetting composites based on curing of a cubic silsesquioxane epoxy resin, known as octa[dimethylsiloxypropylglycidylether] octasiloxane (OG), in presence of 3,3-methylenedianiline (MDA) as hardener, was examined at various experimental conditions.
Loss factor (ε”) and dielectric constant (ε’) curves show
the same profile with respect to OG content, which shift to higher temperature with increasing frequency.
The amplitude of the ε” maximum decreases with
increasing OG content until about 73 wt.% and slightly increases at higher OG content. The increasing of the OG content in the OG/MDA composites decreases the number of pendants groups and/or increases cross-link density, causing decreased motion of organic tethers (links between cubes), and a subsequently decreasing of the dipolar mobility.
The results of apparent activation energy, fracture toughness and tensile modulus mechanical properties show the same profile with respect to OG content, in the sense that they exhibit maxima around 70 wt. %
OG (φ ≈ 0.50). For the OG/MDA composites, this
formulation of φ ≈ 0.50 containing excess of amine, is
not the composition where the highest cross-linked density is reached. This implies that the best mechanical
properties and the highest values of Ea are provided by
some degree of chain flexibility.
These results indicated that dielectric relaxation technique can be used to know and to understand the relationships between the relaxational behavior and the structure of the networks of the composite matrix.
Acknowledgments
The authors are indebted to the FAPESP for financial support.
References
1. Mark, H.F.; Bikales, M.N.; Overberger, C.G.; Mengues, G.;
Encyclopedia of Polymer Science and Engineering, Emulsion
2. Lee, H.; Neville, K.; Handbook of Epoxy Resins, McGraw Hill: New York, 1967.
3. Mauri, A.N.; Riccardi, C.C.; Williams, R.J.J.; Polym. Bull.2001,
45, 523.
4. Pellice, S.A.; Fasce, D.P.; Williams, R.J.J; J. Polym. Sci.2003,
41, 1451.
5. Smith, I.T.; Polymer1961, 2, 95.
6. Yamini, S.; Young, R.J.; J. Mat. Sci.1980, 5, 1814. 7. Yamini, S.; Young, R.J.; J. Mat. Sci.1980, 15, 1823. 8. Zhang, C.; Laine, R.M.; J. Organomet. Chem.1996, 521, 199. 9. Lee, A.; Lichtenhan, J.D.; Macromolecules1998, 31, 4970. 10. Rey, L.; Poisson, N.; Maazouz, A.; Sautereau, H.; J. Mat. Sci.
1999, 34, 1775.
11. Li, Z.G.; Wang, L.; Toghiani, H.; Daulton, T.L.; Koyma, K.; Pittman Jr., C.U.; Macromolecules2001, 34, 8686.
12. Abad, M.J.; Barral, L.; Fasce, D.P.; Williams, R.J.J.;
Macromolecules 2003, 36, 3128.
13. Fu, B.X.; Namani, M.; Lee, A.; Polymer2003, 44, 7739. 14. Ni, Y.; Zheng, S.; Nie, K.; Polymer 2004, 45, 5557.
15. Voronkov, M.G.; Lavrent’yev, V.I.; Top. Curr. Chem.1982, 102, 199.
16. Baney, R.H.; Itoh, M.; Sakakibara, A.; Suzuki, T.; Chem. Rev.
1995, 95, 1409.
17. Provatas, A.; Matisons, J.G.; Trends. Polym. Sci.1997, 5, 327. 18. Feher, F.J.; Budzichowski, T.A.; J. Organomet. Chem. 1989,
379, 33.
19. Laine, R.M.; Asuncion, M.; Baliat, S.; Dias Filho, N.L.; Harcup, J.; Sutorik, A.C.; Viculis, L.; Yee, A.F.; Zhang, C.; Zhu, Q. In
Organic/Inorganic Hybrid Materials; Klein, L.; De Guire, M.; Lorraine, F.; Mark, J., eds., MRS Symp. Ser., vol. 576, 1999, pp. 3-14; Dias Filho, N.L.; unpublished work (Report from FAPESP, process number 1997/11133-7), 1997.
20. Laine, R.M.; Choi, J.; Lee, I.; Adv. Mat.2001, 13, 800. 21. Choi, J.; Yee, A.F.; Laine, R.M.; Macromolecules 2003, 36,
5666.
22. Choi, J.; Tamaki, R.; KIM, S.G.; Laine, R.M.; Chem. Mat.2003,
15, 3365.
23. Choi, J.; Kim, S.G.; Laine, R.M.; Macromolecules 2004, 37, 99.
24. Huang, J.; He, C.; Xiao,Y.; Mya, K.Y.; Dai, J.; Siow, Y.P.;
Polymer2003, 44, 4491.
25. Choi, J.; Harcup, J.; Yee, A.F.; Zhu, Q.; Laine, R.M.; J. Am. Chem. Soc.2001, 123, 11420.
26. Choi, J.; Yee, A. F.; Laine, R. M.; Macromolecules2004, 37, 3267.
27. Kranbuehl, D.E. In Dieletric Spectroscopy of Polymeric Materials: Fundamentals and Applications; Runt, J.P.; Fitzgerald, J.J.,eds., American Chemical Society: Washington, 1997, ch. 11.
28. Prime, R.B.; Thermal Characterization of Polymeric Materials, vol. 2, 2nd Edition, Academic Press: San Diego, 1997, ch. 6.
29. Boyd, R.H.; Polymer 1985, 26, 1123.
30. Ribelles, J.L.G.; Calleja, R.D.; J. Polym. Sci., Part B: Polym.
Phys.1985, 23, 1297.
31. Williams, G.; Nazemi, A.; Karasz, F.E.; Hill, J.S.; Lacey, D.; Gray, G.W.; Macromolecules1991, 24, 5134.
32. Huo, P.; Cebe, P.; J. Polym. Sci., Part B: Polym. Phys.1992,
30, 239.
33. Dionísio, M.S., Moura-Ramos, J.J.; Williams, G.; Polymer
1994, 35, 1705.
34. Vaia, R.A.; Sauer, B.B.; Tse, O.K.; Giannelis, E.P.; J. Polym.
Sci., Part B: Polym. Phys. 1997,35, 59.
35. Fitz, B.D.; Mijovic, J.; Polym. Adv. Technol.1998, 9, 721. 36. He, Y.; Thermochim. Acta2001, 367-368, 101.
37. Valentini, L.; Puglia, D.; Frulloni, E.; Armentano, I.; Kenny, J.M.; Santucci, S.; Composites Scie. Tech.2004, 64, 23. 38. Hasegawa, I.; Kuroda, K.; Kato, C.; Bull. Chem. Soc. Jap.1986,
59, 2279.
39. Hasegawa, I.; Sakka, S.; Sugahara, Y.; Kuroda, K.; Kato, C.; J.
Chem. Soc. Chem. Comm.1989, 208.
40. Hasegawa, I.; Ishida, M.; Motojima, S.; Synth. React. Inorg.,
Met.-Org., Nano-Met. Chem.1994, 24, 1099.
41. Sellinger, A.; Laine, R.M.; Chem. Mater.1996, 8,1592.
Received: November 4, 2005
Published on the web: March 31, 2006
![Figure 1. Schematic representation of preparation of the octaanion solution, [Me 4 N + ] 8 [SiO 2.5 – ] 8 , and octa [hydridodimethylsiloxy] octasilsesquioxane, [HMe 2 SiOSiO 1.5 ] 8 .](https://thumb-eu.123doks.com/thumbv2/123dok_br/18991326.460743/2.892.208.668.957.1083/figure-schematic-representation-preparation-octaanion-solution-hydridodimethylsiloxy-octasilsesquioxane.webp)