Article
Global pesticide consumption and pollution: with China as a focus
WenJun Zhang1,2, FuBin Jiang1, JianFeng Ou1 1
School of Life Sciences, Sun Yat-sen University, Guangzhou, China 2
International Academy of Ecology and Environmental Sciences, Hong Kong E-mail: [email protected], [email protected]
Received 12 January 2011; Accepted 19 March 2011; Published online 28 August 2011 IAEES
Abstract
Varieties and consumption of pesticides worldwide have been increasing dramatically as increased human population and crop production. In this process pesticide misuses become more and more serious, which has resulted in heavy environmental pollution and health risk of humans. In order to safeguard human health, threatened species and ecosystems from pesticide pollution, the consumption and pollution of pesticides worldwide especially China were reviewed and documented in present study. Meanwhile, the development trend of pesticide varieties and consumption was also prospected and discussed. It was found that worldwide consumption structure of pesticides has undergone significant changes since 1960s. The proportion of herbicides in pesticide consumption increased rapidly and the consumption of insecticides and fungicides/bactericides declined. China has become the largest pesticide producer and exporter in the world. Pesticide pollution of air, water bodies and soils, and pesticide-induced deaths in China has been serious in past years. Bio-pesticides should be further developed in the future.
Keywords pesticides; consumption; pollution; world; review.
1 Introduction
1.1 Definition of pesticide
A pesticide is any substance or mixture of substances intended for preventing, destroying, repelling, or mitigating any pest (insects, mites, nematodes, weeds, rats, etc.), including insecticide, herbicide, fungicide, and various other substances used to control pests (EPA, 2009). Definition of pesticide varied with times and countries. However, the essence of pesticide remains basically constant, i.e., it is a (mixed) substance that is poisonous and efficient to target organisms and is safe to non-target organisms and environments.
1.2 History of pesticide production and application
organic synthesized pesticides has been a significant mark of human civilization, which greatly protects and facilitates agricultural productivity.
In the earlier period of organic synthesized pesticides, there were mainly three kinds of insecticides, carbamated insecticides, organophosphorus insecticides and organochlorined insecticides. Sooner after that herbicides and fungicides achieved a considerable development as well. The consumption of insecticides is estimated to decline gradually and the use of herbicides would be popular in the future. This trend may be found from the changes of the structure of pesticide consumption worldwide (Table 1).
Table 1 Changes of pesticide consumption worldwide
1960 1970 1980 1990 2000 2005 Category
Sale % Sale % Sale % Sale % Sale % Sale %
Insecticides 310 36.5 1002 37.1 4025 34.7 7655 29 7559 27.9 7798 25.0 Herbicides 170 20.0 939 34.8 4756 14.0 11625 44 12885 47.5 14971 48.0 Fungicides &
Bactericides
340 40.0 599 22.2 2181 18.8 5545 21 5306 19.6 7486 24.0
Others 30 3.5 159 5.9 638 5.5 1575 6 1354 5.0 936 3.0 Total 850 100 2700 100 11600 100 26400 100 27104 100 31191 100 Sale: million US dollars (Xu, 1997; http://www.docin.com/p-55305172.html)
As can be seen from Table 1, worldwide consumption structure of pesticides has undergone significant changes since 1960s. The proportion of herbicides in pesticide consumption increased rapidly, from 20% in 1960 to 48% in 2005. The proportion of consumption of insecticides and fungicides/bactericides declined despite their sales increased. The rapid increase of herbicide consumption enhanced agricultural intensification and productivity.
1.3 Benefits and risks of pesticide application
Worldwide approximately 9,000 species of insects and mites, 50,000 species of plant pathogens, and 8,000 species of weeds damage crops. Insect pests cause an estimated 14% of loss, plant pathogens cause a 13% loss, and weeds a 13% loss (Pimentel, 2009a). Pesticide is so indispensable in agricultural production. About one-third of the agricultural products are produced by using pesticides (Liu et al., 2002). Without pesticide application the loss of fruits, vegetables and cereals from pest injury would reach 78%, 54% and 32% respectively (Cai, 2008). Crop loss from pests declines to 35% to 42% when pesticides are used (Pimentel, 1997; Liu and Liu, 1999).
In view of the world’s limited croplands and growing population (Zhang et al., 2006; Zhang, 2008), it is necessary to take all measures to increase crop production in order to ensure food safety (Zhang et al., 2007, 2008c; Zhang, 2009). Knutson and other researchers pointed out that if the consumption of pesticides is prohibited, the food production in USA would drop sharply and the food prices would soar. In this circumstance, the export of cotton, wheat and soybean in the United States would decline by 27%, and 132,000 jobs would be lost. Fungicides are used to 80% fruit and vegetable crops in the United States. The economic value of the apple has increased 1,223 million dollars by using fungicides (Guo et al., 2007).
Meantime, the risks of using pesticides are serious as well (Pimentel, 2009b). Most pesticides are not spontaneously generated. Most of them are high toxic to humans and the environment. Pesticides and their degraded products would flow into the atmosphere, soils and rivers, resulting in the accumulation of toxic substances and thus threatening human health and the environment.
Hangzhou in 2008, Gero Vaagt pointed out that there were four aspects of issues in pesticide production and application worldwide: (1) some countries still produced or used highly toxic pesticides; (2) pesticides were overused to a variety of crops like cotton, vegetables and rice; (3) the quality of pesticides was poor, for instance, some countries were not able to effectively regulate pesticides and thus result in the production and consumption of counterfeit and unqualified pesticides, and (4) pesticide residue standards were not implemented effectively.
The environmental pollution caused by pesticides in Asia, Africa, Latin America, the Middle East and Eastern Europe are now serious. Even in earlier years the residuals of DDT, lindane and dieldrin in fish, eggs and vegetables have been much beyond the safe range in India (Wu, 1986). In India the DDT content in human body was ever the highest in the world.
2 Worldwide Production and Consumption of Pesticides
Over 1990s, the global pesticide sale remained relatively constant, between 270 to 300 billion dollars, of which 47% were herbicides, 79% were insecticides, 19% were fungicides/bactericides, and 5% the others (Table 1). Over the period 2007 to 2008, herbicides ranked the first in three major categories of pesticides (insecticides, fungicides/bactericides, herbicides). Fungicides/bactericides increased rapidly and ranked the second. Europe is now the largest pesticide consumer in the world, seconded by Asia. As for countries, China, the United States, France, Brazil and Japan are the largest pesticide producers, consumers or traders in the world.
Most of the pesticides worldwide are used to fruit and vegetable crops. In the developed countries pesticides, mainly herbicides, are mostly used to maize.
Since the 1980s hundreds of thousands of pesticides have been developed, including various biopesticides.
2.1 United States
It can be found from Table 2 that pesticide export of the United States was greatly higher than its import. In 2006 the import (export) of herbicides of the United States made up 45.4% (51.6%) of its total import (export). Maize and soybean pesticides occupied most of the pesticide markets (Table 3), totally making up 44.75% of the pesticide sale in 2007, of which pesticide consumption of maize was about 2 times that of soybean. 75.3% of pesticides used to maize were herbicides, seconded by insecticides. The consumption of fungicides/bactericides on maize roared in 2007, from 6 million US dollars in 2005 to 130 million US dollars in 2007. For soybean, herbicides were dominant pesticides.
Atrazine held the highest portion in the maize herbicides. In 2005 its consumption reached 57.39 million pounds, almost twice as much as glyphosate. The tefluthrin and cyfluthrin constituted the largest consumption to maize in the United States, third by tebupirimfos. Acetochlor and s-metolachlor were the popular maize herbicides after glyphosate. Meanwhile, mesotrione was used to 20% of maize production as well.
Table 2 Import/export of pesticides of some major countries in recent years
Import/Export Category Country 2000 2001 2002 2003 2004 2005 2006
Pesticides USA 471168 652447 501627 637199 748955 724882 655367
Germany 600541 520461 621947 712762 840315 1000303 975375
France 1387807 1173452 1287594 1426783 1678545 1774133 1462328
Japan 269655 263994 249008 243039 266196 296083 314592
Australia 198139 186483 185323 196401 265128 284037 284262
S. Africa 102876 91625 98001 126321 153665 150407 170051
Insecticides USA 82745 189048 85145 96949 124736 128625 117246
Import (US$1,000)
France 241043 197565 214614 268206 294944 288445 262503
Japan 43354 54883 63338 54977 59250 86152 95660
Australia 63723 53107 38842 29914 54472 66404 66455
S. Africa 40511 38461 42076 51718 68804 65321 67586
Fungicides USA 146313 143318 145534 179533 236757 244226 152301
Germany 276210 214278 201054 240257 243189 335761 309141
France 473119 432035 547272 571386 590383 712551 459202
Japan 108963 104133 85115 95366 99191 90831 91848
Australia 32861 30016 31105 39747 41732 54375 53763
S. Africa 20569 20017 18963 24828 31235 31822 37947
Herbicides USA 213485 291233 236100 310730 304715 282872 298059
Germany 217369 195114 270169 275636 359263 417922 436314
France 570623 459998 433102 482940 682198 657921 595424
Japan 105558 94186 88759 82304 98119 109464 117621
Australia 79150 82267 92598 92648 129822 132367 133878
S. Africa 35131 27514 32250 43253 46543 45031 55698
Disinfectants USA 28625 28848 34848 49987 82748 69160 87761
Germany 56319 62906 77979 105516 145986 146561 144540
France 103023 83855 92606 104251 111021 115216 145200
Japan 11781 10792 11797 10392 9636 9635 9463
Australia 22405 21093 22778 34091 39102 30891 30166
S. Africa 6666 5633 4712 6522 7082 8233 8820
Pesticides USA 1492417 1547475 1547202 1457495 1721760 1621195 1906288
Germany 1858538 1401648 1552426 1805560 1822556 1908079 2355308
France 1700933 1473243 1601636 1858499 2633837 2566852 2477606
Japan 274765 253749 239955 269034 297725 309338 314931
Australia 52667 52237 70644 72498 73865 72166 66328
S. Africa 109578 121796 105979 133625 153540 143139 131585
Insecticides USA 423215 407252 445570 431467 501799 373460 468545
Germany 293326 204768 209430 270766 286096 289008 339146
France 388332 332709 333485 397697 536944 492160 416590
Japan 107558 98016 94573 107266 116777 118846 136715
Australia 18064 24482 33691 33294 23360 25668 18742
S. Africa 29805 28032 28671 35529 36583 42083 48425
Fungicides USA 155674 142257 172466 220980 274667 258393 286200
Germany 609388 500089 559770 595337 738597 737897 745524
France 516724 416907 498057 554133 767753 885303 779649
Japan 75981 68552 70863 74210 78392 78057 72614
Australia 2933 2434 5667 7038 9645 10882 13803
S. Africa 18400 16340 11463 13681 16024 22307 21860
Herbicides USA 779936 837017 790926 647111 777829 837163 983249
Germany 719662 483870 530916 614290 434823 507688 833748
France 741932 666562 704590 827634 1225871 1069496 1144222
Japan 83809 81096 64424 74287 86315 96908 91909
Australia 26638 21324 22911 22909 32347 29361 25252
Export (US$1,000)
Disinfectants USA 133592 160949 138240 157938 167465 152179 168294
Germany 236162 212920 252310 325167 363040 373486 436890
France 53945 57064 65504 79035 103269 119894 137146
Japan 7416 6085 10096 13272 16241 15527 13694
Australia 5031 3996 8376 9256 8512 6254 8530
S. Africa 4264 7410 6078 7102 6126 8020 10175
Data from FAO (2010)
Table 3 Pesticide sales in the United States in 2005 and 2007 (million US dollars)
2005 2007 Crop
Herbicides Insecticides Fungicides
& Bactericides Total Herbicides Insecticides
Fungicides
& Bactericides Total
Maize 1239 338 6 1583 1385 320 130 1835
Fruits/Vegeta. 369 486 393 1248 369 468 314 1151
Potato 34 84 49 167 19 107 62 188
Grape 40 35 53 128 32 48 32 112
Pear 30 57 36 123 43 28 27 98
Others 265 310 255 830 275 285 193 753
Soybean 811 3 60 874 730 85 65 880
Cotton 269 178 6 453 200 180 3 383
Cereals 390 42 40 472 390 40 37 467
Rice 115 8 25 148 82 5 18 105
Beet 70 13 11 94 72 14 10 96
Sunflower 40 8 0 48 35 6 0 41
Sugarcane 32 6 0 38 28 5 0 33
Rape 12 2 0 14 13 2 0 15
Others 778 225 175 1178 610 120 55 785
Total 4125 1309 716 6150 3914 1245 632 5791
Percent (%) 67.1 21.3 11.6 100 67.6 21.5 10.9 100
Data from Bo and Zhang (2009)
Pesticide consumption has been reducing in the United States to protect the environment. As early as in 1972, the uses of DDT and related organochlorinated insecticides were banned in the United States. During the late 20th century, pesticide consumption in the United States declined by 35% without reducing crop production (SDNX, 2005).
2.2 Europe
Germany is the largest producer and second largest consumer of pesticides in Europe. France is the largest pesticide consumer in Europe, followed by Germany (Table 4). Other major pesticide consumers in Europe include Italy, Spain and UK.
2.2.1 Germany
Table 4 Pesticide sales in some European countries (million US dollars)
Country 2006 2007 Increase (%)
France 2424.2 2564.3 5.8
Germany 1566.7 1737.2 10.9
Italy 1003.6 1043.3 4.0
Spain 782.9 810.4 3.5
UK 686.4 770.7 12.3
Data from ECPA (http://www.ecpa.be/)
Table 5 Consumption of pesticides of some major countries in recent years (tons)
Category Country 2000 2001 2002 2003 2004 2005 2006 2007
Insecticides Germany 1380.4 1308.7 1412.3 1038.1 1201.7 963.31 776.24 1370.4
France 3103 2488 2308 2224 2460 2506 2140 2101
Japan 27292.3 26227.3 23363.1 24795.1 22772.5 22679.6 24031.8 22549.0
Herbicides Germany 16610.8 14942.2 14327.9 15349.5 15922.9 15610.3 17062.8 17163.7
France 30845 32122 28779 24508 26102 29209 23068 26808
Japan 11331.7 11793.1 11492.8 10942.4 11861.5 12158.1 11946.7 12031.6
Fungicides & Bactericides
Germany
9375.9 8021.9 9915.8 9827.4 7858.4 9543.2 9523.4 10311.7
France 52834 54130 43351 39317 37175 35921 35957 36919
Japan 40611.9 39993.2 34768.5 31521.0 29582.8 28526.2 28850.7 26199.0
Data from FAO (2010)
It is believed that the domestic market tends to be saturated and the export increases. In 2008 the export to Central America and South America increased by 10%. However the export to Europe declined.
2.2.2 France
Fungicides/Bactericides are the most used pesticides in France (Table 2, 5). In total 36,919 tons of fungicides, 2,101 tons of insecticides and 26,808 tons of herbicides were consumed during 2007. The pesticide sale in 2008 increased by 13.3% and the sale reached 2.959 billion US dollars. The sale of fungicides roared by 16.5% in 2008 (Lan and Bo, 2009).
Overall the pesticide consumption in Europe declined in last decades. The consumption declined by 50% compared to the average in 1980s.
2.3 Asia 2.3.1 China
According to a report, there are 1,648 kinds of agricultural pests in China, including 724 plant diseases, 838 insects (mites), 64 weeds, and 22 rodents. Without pesticide uses, the production of fruits, vegetables and cereals will lose 78%, 54% and 32% respectively (Cai, 2008). Pesticide uses in China reduce the loss of 89.44 million tons of cereals, 1.65 million tons of cotton, 2.53 million tones of oilseeds and 78 million tons of vegetables (Editorial Board of Chinese Yearbook on Agriculture, 2007).
pyrethroid and other pesticides were developed (Lin et al., 2000). Since 1994 pesticide export of China has exceeded its import. So far, there are more than 2,000 pesticide companies, of which more than 400 companies are manufacturers for original pesticides; more than 300 varieties of original pesticides and 3,000 preparations are being manufactured. China’s pesticide production has reached 1.73 million tons (Zhu, 2008). China is now the largest producer and exporter, and the second largest consumer of pesticides in the world (Rajinder et al., 2009).
China has banned the application of high-residual HCH, DDT and other organochlorined pesticides since 1983. Since 2007, the high-poisonous organophosphorus pesticides, parathionmethyl, parathion, methamidophos, and phosphamidon have been banned for using and selling in China.
In China, rice is the major crop to consume pesticides. Rice pesticide sale, accounting for 15% of total sale, reached 538 million US dollars in 2006. Vegetable pesticide sale made up 24.2% of total sale.
According to the data from China Custom (Table 7; Lan and Bo, 2009), during 2008 China imported 44,000 tons of pesticides (300 million US dollars); exported 55,000 tons of fungicides (240 million US dollars), an increase of 5.2% against the export in 2007; exported 136,000 tons of insecticides (510 million US dollars), declining by 1.9%; exported 277,000 tons of herbicides (1.23 billion US dollars), increasing by 5.1%. In general, herbicides accounted for the greatest portion of the total export.
Table 6 Pesticide production, consumption and import/export of China (10,000 tons)
Year Production Consumption Import Export
1983 33.1 6.1
1984 29.9 5.9
1985 21.1 1.6
1986 20.3 0.7
1987 16.1 1
1988 17.9 3.4
1989 20.8 3.7
1990 22.8 2.8
1991 25.5 76.1 3.2
1992 28.1 79.5 3.9
1993 25.7 84.9 2.3 4.2
1994 29 87.1 3.1 6.1
1995 41.7 108.7 3.4 7.1
1996 42.7 114.1 3.2 7.4
1997 55.2 119.5 4.8 8.8
1998 60.5 123.2 4.4 10.7
1999 62.5 131.2 4.7 14.7
2000 60.7 128 4.1 16.2
2001 78.7 127.5 3.4 19.7
2002 92.9 131.2 2.7 22.2
2003 76.7 132.5 2.8 27.2
2004 87 138.6 2.8 39.1
2005 104 146 3.7 42.8
2006 129.6 4.3 58.3
2007 173.1
2009 220.0
Table 7 Import/export of pesticides of China in 2008 Import (million
US dollars)
Import (1,000 tons) Export (million US dollars)
Export (1,000 tons) Category
2008 Growth %
2008 Growth
%
2008 Growth
%
2008 Growth % Insecticides 60 14.8 8 11.1 510 24.4 136 -1.9 Herbicides 110 35.7 19 5.0 1230 72.2 277 1.8 Fungicides &
Bactericides
100 20.8 13 -2.7 240 38.3 55 5.1
Total 300 27.6 44 7 2020 49.7 485 1.5
Data from CCPIA (www.ccpia.org.cn/)
2.3.2 Japan
Japan is one of the world’s largest pesticide consumer and the largest pesticide market in Asia (Table 2, 5). Japan has banned the consumption of DDT, HCH, organomercury fungicides/bactericides and parathion since 1971 (Wu, 1985). However Japan’s pesticide export to China and Southeast Asia countries is continuously increasing. In Japan, pesticides are mainly used to rice, and are being increasingly used to horticultural crops (Table 8). Consumption of rice pesticides accounted for 41% of the total. The consumption of insecticides is still the greatest but the sale of herbicides ranks the first (Table 2, 5, 8). Among herbicides glyphosate products are popularly applied. Most of insecticides and fungicides/bactericides are applied to vegetable crops and most of herbicides applied to rice.
Table 8 Pesticide sale in Japan during 2004-2007
04/05 Sale 05/06 Sale 06/07 Sale
Crop Category
Tons Million J Yen Tons Million J Yen Tons Million J Yen
Rice 98670 118979 94858 118220 85894 112815
Insecticides 23336 14615 23446 15309 20641 13771
Fungicides & Bactericides 15695 17837 14366 15981 12272 14509
Herbicides 34798 54841 33526 55513 32528 55160
Fruits 24104 56622 22619 53031 21708 52030
Insecticides 11179 26454 11003 24676 10627 25104
Fungicides & Bactericides 7943 19618 7059 18785 7085 18970
Herbicides 4923 10452 4516 9509 3960 7899
Vegetables 89634 110467 88616 113036 82609 114214
Insecticides 49298 54714 48826 55725 44244 55921
Fungicides & Bactericides 28230 37124 27606 37288 26739 40784
Herbicides 11190 18045 11187 19368 10770 16873
Others 15706 30866 17749 34001 15830 34001
Insecticides 40822 6171 4044 6309 2541 5375
Fungicides & Bactericides 1076 5130 1298 6541 1194 7276
Herbicides 10172 19286 10502 20007 10492 16833
Data from JCPA (www.jcpa.or.jp/)
2.4 Australia
total import in 2006. Of the pesticides imported, the products from China are quickly increasing, including glyphosate, paraquat and glufosinate-ammonium. About 10% of glyphosate are from China. Endosulfan from China is the major cotton insecticide and acaricide in Australia.
2.5 South Africa
Pesticide consumption of Africa accounts for about 3% of the world, of which South Africa makes up 2% of pesticide consumption of the world (Table 2). As the development of Africa’s agriculture, pesticide production of South Africa is expected to grow rapidly in the future.
3 Worldwide Situation of Pesticide Pollution
Globally 4.6 million tons of chemical pesticides are annually sprayed into the environment. There are currently about 500 pesticides with mass applications, of which organochlorined pesticides, some herbicides and the pesticides containing mercury, asenic and lead are highly poisonous to the environment. Only 1% of the sprayed pesticides are effective. 99% of pesticides applied are released to non-target soils, water bodies and atmosphere, and finally absorbed by almost every organism.
According to a report from the EPA of the United States, many of rural wells in the nation contain at least one of 127 pesticides. A research panel of Indiana University analyzed barks from 90 sites from the equator to high latitude cold regions, and detected DDT, aldrin and lindane residuals. High-residual pesticides like DDT have been detected in the Greenland ice sheet and the bodies of Antarctic penguins which were resulted from atmospheric circulation, ocean currents and biological enrichment of pesticides.
According to a report of WHO and UNEP, worldwide there are more than 26 million human pesticide poisonings with about 220,000 deaths per year (Richter, 2002). In the United States, there are 67 thousands human pesticide poisonings per year. In China, there are 0.5 million human pesticide poisonings with 0.1 million deaths per year.
Table 9 Application dosage of chemical pesticides in China (kg/ha)
Dosage level Province
or city Dosage Dosage level
Province
or city Dosage
Shanghai 12.72 1.5~3.0 kg/ha Chongqing 2.47
>6.0 kg/ha Shandong 10.55 Beijing 2.22
Jiangsu 9.43 Jilin 2.01
Hubei 7.29 Heilonjiang 1.80
Hainan 7.12 Shanxi 1.49
Anhui 7.10 0.75~1.5 kg/ha Sichuan 1.24
Henan 7.07 Yunnan 0.89
Zhejiang 6.38 Gansu 0.78
Guangdong 5.52 Guizhou 0.61
(3.0~6.0 kg/ha) Jiangxi 5.32 <0.75 kg/ha) Shannxi 0.52
Hunan 5.15 Ninxia 0.34
Fujian 4.69 Xinjiang 0.26
Hebei 4.40
Inner
Mongolia 0.15
Liaoning 3.45 Qinghai 0.03
Tianjing 3.12 Tibet 0.01
Pesticides can not only cause death but also induce various diseases. It is estimated that cancer patients resulted from pesticide poisoning account for nearly 10% of the total cancer patients (Gu and Tian, 2005). Chen (2004) found that the incidence of breast cancer was linearly correlated with the frequency of pesticide uses, and organochlorined pesticide, DDT, and its derivative, DDE, is likely responsible for breast cancer.
Table 10 Environmental persistency of some organochlorined pesticides
Pesticide Required time for 5% residual (years) Mean (years)
DDT 4~30 10
Dieldrin 5~25 8
Lindane 3~10 6.5
Chlordane 3~5 4
Telodrin 2~7 4
Heptachlor 3~5 3.5
Aldrin 1~6 3
Data from Tang and Li (1998)
In general, detailed data are still lacking on the impact of pesticides on human health and the environment (Pimentel, 2009a). We thereafter discuss the situation of pesticide pollution and impact in China. Organochlorined pesticides (OCPs) are parts of persistent organic pollutants (POPs), which include HCH, DDT, aldrin, dieldrin, endrin, chlordane, heptachlor, toxaphene, HCB, etc. POPs are much different from other pesticides in these aspects: they are environmentally persistent (Table 10), semi-volatile, high-bioaccumulative and high toxic (Yu et al., 2005). According to the “Stockholm Convention on Persistent Organic Pollutants”, nine in twelve POPs are organochlorined pesticides. For this reason we will mainly focus on OCPs and POPs in the following discussion.
3.1 Pesticide pollution in the environment 3.1.1 Soil pollution
According to the residual surveys of OCPs in China (Table 11), OCPs were detected in various soil types, including cultivated fields, vegetable fields, forest lands, etc. Since the use of OCPs has been banned in 1983, the residual OCPs have been declining but in some regions they are still abundant (Wang et al., 2008a).
Table 11 Residual levels of OCPs in the soils of China
Region
Monitoring year
Soil type
OCPs HCH
μg·kg-1
DDT μg·kg-1
Source
Urumuqi 2004 Cultivated
fields
DDT, HCH 0.194~6.947 Mean: 4.395
0.52~10.438 Mean: 3.416
Lui et al., 2006
Yingchuan 2007
Various types
DDT, HCH, HCB, etc.
0.306~74.219 Mean: 0.852
0.284 ~
1068.428 Mean: 2.236
Wang et al., 2008a
Mianyang, Chengdu
2006 Forest lands、
Cultivated fields
DDT, HCH 0.01~0.60 0.01~7.10 Li et al.,
2008
Weishanhu Lake
2007
Various
Xixi Wetland
2007 Wetlands DDT, HCH 14.56~29.43
Mean: 18.44
12.82~47.36 Mean: 20.80
Shao et al., 2008
Northwest Sichuan to Chongqing
2006 Various
types
DDT, HCH 0.06~2.10 Mean: 0.66
0.12~27.04 Mean: 4.87
Wang et al., 2008b
Beijing 2004
Various types DDT, HCB, chlordane, aldrin, etc.
0~1830 Mean: 76.8
Shi et al., 2007
Central Jilin 2007
Various types DDT, HCH, and their metabolites
0.47~13.47 Mean: 2.00
0.02~69.35 Mean: 3.01
Yu et al., 2007 Haihe River, estuary region 2007 Various types
DDT, HCH nd~1728 Mean: 93.9
nd~288 Mean: 34.4
Zhao et al., 2009
Tangshan 2008
Various
types DDT, HCH 2.73~32.2
Mean: 5.015
11.09~141.07 Mean: 66.4
Liao et al., 2008 Nanjing 2002 ~ 2003 Croplands DDT, HCH, and their metabolites
2.7~130.6 Mean: 13.6
6.3~1050.7 Mean: 64.1
An et al., 2005
Nanjing 2002 ~
2003 Industrial lands DDT, HCH, and their metabolites
13.8~26.1 Mean: 19.8
11.2~61.7 Mean: 31.3
An et al., 2005
Northeast Hunan
2006 Rice fields
DDT, HCH, chlordane, aldrin, etc.
1.7~25.3 Mean: 18.2
10.5~40.4 Mean: 23.8
Zhang et al., 2008a
Northeast Hunan
2006 Vegetable
fields
DDT, HCH, Chlordane, aldrin, etc.
0.15~16.8 Mean: 7.39
6.05~57.91 Mean: 37.77
Zhang et al., 2008b Xiangjiang River Valley 2004 Various types DDT, HCB, chlordane, aldrin, etc.
0.33~3244 Mean: 132.31
Chen et al., 2008a
Guangdong 2002 ~
2005 Agri. soils DDT, HCH, chlordane, aldrin, etc.
nd~104.38 Mean: 5.90
nd~157.75 Mean: 10.18
Yang et al., 2007
Pearl River Delta
2008
Various
types DDT, HCH 0.19~42.3
Mean: 4.42
3.58~831 Mean: 82.1
Ma and Ran., 2009 Leizhou Peninsula 2004 Various types DDT, HCH, chlordane, aldrin, etc.
nd~65.93 Mean: 3.43
0.04~52.0 Mean: 3.83
Guan et al., 2006
Kunming 2002 ~
2003 Various types DDT, HCH, methamido phos,
0.08~2.33 Mean: 1.05
nd~153.00 Mean: 20.89
dimethoate, etc.
nd: not found.
3.1.2 Water pollution
Generally water bodies of croplands are mostly often polluted. The pesticide concentration of water bodies can reach the magnitude of dozens of milligrams per liter. The levels of water pesticide pollution can be ranked as: cropland water>field ditch water> runoff>pond water>groundwater> river water> deep groundwater>sea water (Lin et al., 2000).
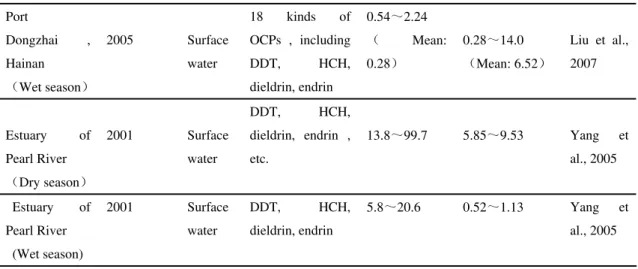
Residuals of OCPs in some water bodies of China are indicated in Table 12. It showed that DDT, HCH, dieldrin, endrin, etc., were detected in most of the water bodies of China. The concentration of OCPs varies seasonally.
Table 12 Residual levels of OCPs in the water bodies of China
Water body Monitoring year
Water OCPs ∑HCH
ng/liter ∑DDT ng/liter Source Diaocha Lake Dry season
2006 Surface
water
20 kinds of OCPs , including DDT, HCH, dieldrin, endrin
2.27~7.72 Mean: 5.23
1.26~40.88 Mean: 18.82
Wang et al., 2007
Diaocha Lake Wet season
2006 Surface
water
20 kinds of OCPs , including
DDT, HCH 、
dieldrin, endrin
2.67 ~ 24.61 Mean: 3.56
0.61~43.24 Mean: 11.90
Wang et al., 2007
Guanting
Reservoir 2008 Surface
water
18 kinds of OCPs , including DDT, HCH, dieldrin, endrin
3.93 ~ 38.94 Mean: 3.23
3.71~16.03 Mean: 8.82
Wan et al., 2009
Suburb of
Beijing 2006 Surface
water
HCH, DDT 3.87~146.62 nd~13.98 Chen et
al., 2008b
Middle-Down Stream, Yellow River
2006 Surface
water
DDT, HCH, HCB 0.73~48.09 0.06~10.04
Sun et al., 2009
Pearl River Delta
2006 Shallow
ground water
DDT, HCH, HCB, heptachlor
nd~8.00 nd~3.41
Guo et al., 2006
Port
Dongzhai , Hainan
Dry season
2006 Surface
water
17 kinds of OCPs , including DDT, HCH, dieldrin, endrin
2.66~8.20 Mean: 5.28
5.91~54.59 Mean: 10.28
Port
Dongzhai , Hainan
Wet season
2005 Surface
water
18 kinds of OCPs , including DDT, HCH, dieldrin, endrin
0.54~2.24 Mean: 0.28
0.28~14.0 Mean: 6.52
Liu et al., 2007
Estuary of Pearl River
Dry season
2001 Surface
water
DDT, HCH, dieldrin, endrin , etc.
13.8~99.7 5.85~9.53 Yang et
al., 2005
Estuary of Pearl River (Wet season)
2001 Surface
water
DDT, HCH, dieldrin, endrin
5.8~20.6 0.52~1.13 Yang et
al., 2005
nd: not found.
3.1.3 Atmospheric pollution
Pesticides in the atmosphere are mainly from the emissions of pesticide plants, evaporation of pesticide residuals in soils and water bodies, and volatilization of pesticides sprayed, etc. Generally atmospheric pollution of pesticides is widespread. Organochlorined pesticides were detected even in the snow on Nanjiabawa Peak in Tibet, with an elevation of 4,250 m (Shan, 1997)
As can be seen from Table 13, major OCPs have been detected in the atmosphere of various regions. Atmospheric concentration of OCPs varied seasonally.
3.2 Crop and crop product pollution
Crop pollution refers to the crop phytotoxicity resulted from pesticide applications. Crop pollution is caused by pesticide spraying, seed dressing and soaking and soil treatment with pesticides. Crop pollution would affect crop growth, reduce the yield and quality of crop products. Crop pollution occurs frequently in China, as indicated in Table 14.
Table 13 Atmospheric residuals of OCPs in China
Region Type Monitoring
year OCPs
∑DDT
ng/m3 Source
Daxing District, Beijing Gas 2005 DDT, dieldrin,
endrin
0.00900 Spring 0.00497 Autumn
Shao et al., 2007
Central town, Tianjing TSP 2002 DDT, HCH 1.874 Summer Wu et al., 2003
Anhui 2005 DDT, dieldrin,
endrin, etc.
0.318 Shao et al., 2007
Jiangsu 2005 DDT, dieldrin,
endrin, etc.
0.772 Shao et al., 2007
Hunan 2005 DDT, dieldrin,
endrin, etc.
1.11 Shao et al., 2007
Hubei 2005 DDT, dieldrin,
endrin, etc.
0.336 Shao et al., 2007
Estuary of Pearl River and coastal waters of Northern
Total 2003 DDT, HCH,
chlordane, etc.
South China Sea
Central town, Beijing TSP 2002 DDT, HCH 0.962
Summer
Wu et al., 2003
Tongzhou District, Beijing Gas 2005 DDT, dieldrin,
endrin, etc.
0.0111 Spring 0.152 Autumn
Shao et al., 2007
Table 14 Pesticide pollution to crops and crop products in China
Region Year Crop Area
Crop or Economic Loss
Source
Shannxi 2004 Vegetables
0.0045 million hectares
Yield loss: 7.1% Zhang, 2007
Mudanjiang 2004~2006 Soybean, maize,
rice, etc. 0.1223 million hectares
Economic loss: 11.031 million RMB Yuan
Sun et al., 2007
Zhonning, Ningxia
2005~2006 Wolfberry 195 hectares Economic loss: 5.84
million RMB Yuan
Meng et al., 2007
Jiangsu 2000~2005
Rice, wheat, cotton, etc.
0.1285 million hectares
Yield loss: 0.04687 million tons; economic loss: 0.1063
billion RMB Yuan
JSPPS, 2006
Anhui 2000~2005
20 kinds of crops, including Rice, cotton, soybean, etc.
0.0586 million hectares
Economic loss: 0.223 billion RMB Yuan
Wang et al., 2005
Boxing, Shandong
2004 Cotton 1,000 hectares Li et al.,
2005
Pesticide residuals of crop products are serious in China as well (Table 15). Pesticide residuals have been detected in grains, rapes, vegetables, fruits, tea and medicinal herbs. A survey on vegetable and fruit markets of China indicated that 41 in 81 vegetable samples were found to have pesticide residuals, of which pesticide residuals in leek and cabbage exceeded 80% and 60% of the national standard.
Table 15 Pesticide residual situation in China’s markets
Beijing Shanghai Guangzhou
Sampling markets Wal-Mart Lotus Agriculture AIB Trading Market of Crop Products Vanguard Trading Market of Crop Products Total
No. Samples 15 5 5 5 10 5 45
No. samples with pesticide residuals ( percent )
No. samples with more than three kinds of pesticide residuals
13 5 3 2 9 2 34
No. samples with more than five kinds of pesticide residuals
7 3 3 2 8 2 25
No. samples with more than ten kinds of pesticide residuals
2 1 0 0 2 0 5
No. samples containing illegal or high toxic pesticides
1 2 1 1 2 2 9
Data from Green Peace (http://www.greenpeace.org/china/zh/)
3.3 Impact of pesticides on human health
The impact of pesticides on human health is divided into two categories, the chronic and the acute. Pesticide poisonings are also divided into productive poisonings, generated in the process of agricultural production, and living poisonings, i.e., suicide, ingestion, and food intake with high-residuals, etc (Liu et al., 2008b).
In China young adults from the ages 15 to 59 accounted for 84.11% of the total (Table 16). Most of human pesticide poisonings were living poisonings, of which females accounted for the most proportion. Males made up the most of productive poisonings (Table 16). Pesticide poisonings occurred mostly in the grain- and cotton-producing areas, especially cotton-producing areas. Human pesticide poisonings were mainly from Shandong, Jiangsu, Zhejiang and Hubei, totally accounted for 66% of the nation’s total.
As can be seen from Table 17, the major pesticides for human poisonings were high-toxic organophosphorus pesticides, which accounted for 86.02% of the total cases and living poisonings made up 97.92%.
Table 16 Age distribution and causes of human pesticide poisonings during 1997 and 2003
Total Productive poisonings Living poisonings
Age Cases Deaths % Cases Deaths % Cases Deaths %
0~ 6291 244 3.88 251 1 0.40 6040 243 4.02
15~ 47447 2641 5.57 9669 77 0.80 37778 2564 6.79
35~ 43710 2823 6.46 15241 84 0.55 28469 2739 9.62
60~ 3951 435 11.01 1236 13 1.05 2715 422 15.54
65~ 2633 390 14.81 627 10 1.59 2006 380 18.94
70~ 4322 903 20.89 482 14 2.90 3840 889 23.15
Unknown 18 1 5.56 5 0 0.00 13 1 7.69
Table 17 Distribution of pesticides and pesticide poisonings
Category Cases % Deaths %
Insecticides 92144 86.02 6596 7.16
Organophosphorus 79295 86.06 5945 7.50
Methamidophos 27335 34.47 2327 8.51
Parathion 11798 14.88 671 5.69
Omethoate 9683 12.21 1128 11.65
Dichlorvos 9451 11.92 734 7.77
Others 21028 26.52 1085 5.16
Pyrethroids 2954 3.21 61 2.06
Carbamated pesticides 3225 3.50 246 7.63
Other insecticides 6670 7.24 344 5.16
Rodenticide 5284 4.88 342 6.47
Other pesticides 8397 7.75 428 5.10
Herbicides 2163 25.76 74 3.42
Pesticide mixtures 2524 2.33 68 2.69
Unknown 23 0.02 3 17.39
Data from Chen et al. (2005).
4 Future Trend of Pesticide Production and Consumption
Pesticides in the future should possess the following characteristics: first, they should be highly efficient, which requires a high biological activity and thus may greatly reduce pesticide uses and minimize pesticide pollution of the environment; second, they should be non-toxic; third, they are pollution-free, that is, they are environment-friendly pesticides.
Biopesticides are living organisms, their metabolites in vivo, and genetically modified products that are commercially manufactured to control diseases, insect pests, weeds and other harmful biological organisms (Zhang and Zhang, 1998). They include microbial sourced (bacteria, viruses, fungi and their secondary metabolites like agricultural antibiotics), plant sourced and animal sourced products, and pest-resistance transgenic plants (Zhu et al., 2002; Zhang and Pang, 2009). Biopesticides possess the following advantages: (1) good control effect on the pests, safe to humans and animals, no pollution, and no residuals; (2) strong specificity to target pests, safe to natural enemies and beneficial organisms; (3) raw materials and active ingredients are natural products which helps to ensure sustainable development; (4) they can be modified by means of modern biotechnology and fermentation process to improve performance and enhance quality; (5) pest resistance is difficult to generate (Yang, 2001).
Currently there are more than 100 kinds of biopesticides in the world, of which more than 30 kinds of biopesticides are commercially manufactured (Xu, 2008). Mexico, the United States and Canada are the countries mostly using biopesticides in the world. Consumption of biopesticides in these countries accounts for 44% of the world, while biopesticides consumption of Europe, Asia, Oceania, Latin America, the Caribbean and Africa accounts for 20%, 13%, 11%, 9% and 3% of the world respectively (Qin and Kong, 2006).
Table 18 Registrations of biopesticides in China in 2004 Ingredient No. active
ingredients
No. products
Detail
Bacteria 11 37 2 kinds of Bt varieties
GM bacteria 1 1 Genetic modified Bt
Fungi 6 11 4 kinds
Viruses 12 24 6 kinds of ingredients were registered in the form of mixtures
Antibiotics 29 120 9 for insect pests, 19 for bacteria, and 1 for weeding
Plant-sourced
pesticides 44 108
Biochemical
pesticides 37 111
Include GA, oligosaccharides, brassinolide, Harpin and other plant growth regulators and pheromones
Data from Zheng (2006)
During 2006 the total consumption of biopesticides in China reached 145,000 tons, with a sale accounting for 10% of pesticides. In China’s pesticide markets, Bt accounted for 2%, agricultural antibiotics accounted for 9% and botanical pesticides accounted for 0.5%. It is estimated that biopesticides will replace more than 20% of chemical pesticides in the future.
Despite the advantages above, biopesticides are not perfect. Their slow response to pest outbreaks, higher prices and poor stability limit their further development and application. Solutions must be found to improve their performance and reduce production cost.
Acknowledgments
The authors are grateful to the help of Mrs. Xue Zhang, Mr. XiangRong Lȕi, and Mrs. LiYun Huang. Three authors contributed the same to the article and are all first authors.
References
An Q, Dong YH, Wang H, et al. 2005. Residues and distribution character of organochlorine pesticides in soils in Nanjing area. Acta Scientiae Circumstantiae, 25(4): 470-474
Bo YL, Zhang XJ. 2009. Pesticide markets of major companies of the world. World Pesticides, 31(6): 5-12 Cai DW. 2008. Understand the role of chemical pesticides and prevent misuses of pesticides. Bulletin of
Agricultural Science and Technology, 1: 36-38
Chen JJ, Zhang NM, Qin L, et al. 2004. Heavy metal pollution and pesticide residues in soils of Kunming area. Rural Eco-environment, 20(4): 1-5
Chen JP, Lin G, Zhou BS. 2004.Correlation between pesticides exposure and mortality of breast cancer. China Public Health, 20: 289-290
Chen JW, Liu C, Yang ZF, et al. 2008a. Residues and characteristics of organochlorine pesticides in surface water in the suburb of Beijing. Earth Science Frontiers, 15(5): 242-247
Chen SY, Wang HF, Yi Y. 2005. The reporting system of acute pesticides poisoning and general situation of pesticides poisoning in China. Chinese Journal of Industrial Hygiene and Occupational Diseases, 5
Chen YQ, Li JS, Wu XP, et al. 2008b. Studies on Residues of Organochloride Pesticides(OCPs) in the soils of Xiangjiang River Valley.Research of Environmental Sciences, 21(2): 63-67
Journal of Anhui Agricultural Sciences, 36(3): 1126-1127
Editorial Board of Chinese Yearbook on Agriculture. 2007. Chinese Yearbook on Agriculture 2007.China Agriculture Press, Beijing, China
EPA. 2009. What is a Pesticide? http://www.epa.gov/opp00001/about/ FAO. 2010. FAOSTAT. http://faostat.fao.org/
Gu XJ, Tian SF. 2005. Pesticides and cancer. World Sci-tech R & D, 27(2): 47-52
Guan H, Yang GY, Li PX, et al. 2006. Investigation on organochlorine pesticides pollution in soil of typical area in Leizhou Peninsula. Ecology and Environment, 5(2): 323-326
Guo XF, Zhang HF, Li JG. 2007. The importance of fungicides/bactericides in American agriculture. World Pesticides, 9(3): 21-25
Guo XH, Chen X, Huang GX, et al. 2006. Pollution characteristcs of organochlorine pesticides in shallow surface water body of Pearl River Delta. Environmental Chmistry, 25(6): 798-799
JSPPS. 2006. A survey on crop phytotoxicity in Jiangsu Province. http://kcxh.jaas.ac.cn/2006/6-13/103026.html
Lan JP, Bo YL. 2009. Pesticide markets of major countries. World Pesticides, 5: 8-16
Li JD, Wei DA, Bai CJ. 2005. Countermeasures of cotton phytotoxicity. In: Proceedings of Production and Development Forum on Cotton in Yellow River Delta (Chen RY, Zhao YM, Han JB, et al., eds), 236-239 Li J, Qi SH, Wang XQ, et al. 2008. Vertical distribution of organochlorine pesticides in soils in Mianyang City.
Sichuan Environment, 27(3): 1-6
Liao FR, Tang YG, Wu MY, et al. 2008. A preliminary study on organochlorine pesticides in the soil of Tangshan. Agro-Environment & Development, 5: 132-135
Li YS, GRZ, Zhu ZL. 2000. Pesticides and Environmental Protection. Chemical Industry Press, Beijing, China Liu CJ, Men WJ, Liu YJ, et al. 2002. The pollution of pesticides in soils and its bioremediation. System
Sciemces and Comprehensive Studies in Agriculture, 18(4): 295-297
Liu GQ, Zhang G, Li J, et al. 2008a. Source and distribution characteristic of atmospheric organochlorine pesticides in the Pearl River estuary and adjacent South China Sea. Environmental Science, 29(12): 3320-3325
Liu HF, Qi SH, Li M, et al. 2007. Composition and distribution of organochlorine pesticides in water from Dongzhai Harbor, Hainan Island. Research of Environmental Sciences, 20(4): 70-74
Liu LH, Zhong LQ, Li MQ. 2008b. An epidemiological review on pesticide poisoning in China. China Occupational Medicine, 35(6): 518-520
Liu ZJ, Liu ZB. 1999. The Status of the world agrochemicals. Chemial Technology Market, 22(12): 14-17 Lui AH, Yang RQ, Jiang GB, et al. 2006. The distributions of organochlorine pesticides in sediments and
sewage irrigated area soils collected from Urumuqi Shuimohe valley. Environmental Chemistry, 25(4): 508-510
Ma XX, Ran Y. 2009. The research for organochlorine pesticides in soils of the Pearl River Delta. Ecology and Environmental Sciences, 18(1): 134-137
Meng YJ, Tian WR, Xie SW, et al. 2007. Phytotoxicity of wolfberry and countermeasures in Zhongning, Ningxia. Journal of Agricultural Sciences, 28(3): 95-96
Pimentel D. 1997. Techniques for Reducing Pesticide Use: Environmental and Economic Benefits. John Wiley and Sons, Chichester, USA
Pimentel D. 2009a. Pesticides and pest control. In: Integrated Pest Management: Innovation-Development Process (Vol. 1) (P Rajinder and A Dhawan eds), Springer, 83-87
States. In: Integrated Pest Management: Innovation-Development Process (Vol. 1) (P Rajinder and A Dhawan eds). Springer, 88-111
Qin XF, Kong FB. 2006. Prospect and situation of biopesticides. Journal of Anhui Agricultural Sciences, 34(16): 4024, 4057
Rajinder P, Bandral RS, Zhang WJ, et al. 2009. Integrated Pest Management: a global overview of history, programs and adoption. In: Integrated Pest Management: Innovation-Development Process (Vol. 1) (P Rajinder and A Dhawan eds). Springer, 1-50
Richter ED. 2002. Acute human poisonings. In: Encyclopedia of Pest Management (Ed D Pimentel). Dekker, New York, 3–6
SDNX. 2005. Reduction situation of pesticide applications of some countries. Shandong Pesticide News, 11:34 Shan ZJ. 1997. Status of pesticide pollution and management of China. Environmental Protection, 7:40-43 Shao DD, Shi SX, Zhou L, et al. 2007.A survey on residues of atmospheric organochlorine pesticides of four
provinces along Yangze River. Environmental Protection, 24: 68-69
Sha XX, Wu M, Jiang KY. 2008. Distribution and risk assessment of organochlorine pesticides in the soils of Xixi Wetland Park. Journal of Ecology and Rural Environment, 24(1): 55-58, 62
Shi SX, Zhou L, Shao DD, et al. 2007. Studies on residues of organochloride pesticides POPs in the soils in Beijing area. Research of Environmental Sciences, 20(1): 24-29
Stockholm Convention on Persistent Organic Pollutants. 2010. http://chm.pops.int/default.aspx
Sun GH, Yu GS, Zhang W. 2007. Situation and causes of crop phytotoxity by herbicides in Mudanjiang during 2004 and 2006. China Plant Protection, 20(3): 32-33
Sun JH, ChaiY, Zhang G, et al. 2009. Content and distribution of organic chlorine pesticide in the middle and lower Yellow River. Yellow River, 31(1): 43-46
Tang CC, Li YX. 1998. Pesticides Chemistry. Nankai University Press, Tianjing, China
Wan YW, Tang TF, Zhou ZL, et al. 2009. Distribution and sources of organochlorine pesticides in Beijing Guanting Reservoir. Journal of Ecology and Rural Environment, 25(1): 53-56, 68
Wang MY, Han DY, Gen JG, et al. 2005. Situation and countermeasures of crop phytotoxicity by pesticides in Anhui Province. Anhui Agricultural Science Bulletin, 11(5): 44-45
Wang YH, Qi SH, Wang W. 2007. The characteristic distribution of organic chlorine pesticides in the water and sediment of Diaocha Lake in Hubei Province. Environmental Pollution & Control, 29(6): 415-418 Wang W, Li XH, Lu H, et al. 2008a. Residual and potential risk of organochlorine pesticides in urban soils of
Yinchuan. Journal of Wenzhou University (Natural Sciences), 29(2): 32-37
Wang XQ, Qi SH, Xing XL, et al. 2008b. Compositive characteristics of organochlorine pesticides in soil profile of northwestern Sichuan to Chongqing. China Environmental Science, 28(6): 548-551
Wu GQ. 1985. An overview on pesticides worldwide. World Agriculture, 4: 39-41
Wu M. 1986. Serious crop phytotoxicity by pesticides in India. World Agriculture, 4: 37-37
Wu SP, Cao J, Li BG, et al. 2003. Residues and distribution of organochlorine pesticides in airborne particles of different sizes from urban areas. Research of Environmental Sciences, 16(4): 36-39
Xu YZ. 2008. The application of biological pesticides and industrial development measures. Chinese Agricultural Science Bulletin, 24(8): 402-404
Xu WJ. 1997. Situation and development trend of pesticides worldwide. Heilongjiang Agricultural Science, 5: 50-52
Yang JL. 2001. Green Chemistry and Technology. Beijing University of Posts and Telecommunications, Beijing, China, 176-180
Yang QS, Mai BX, Fu JM, et al.. 2005. Studies on organochlorine pesticides (OCPs) in waters of Pearl River artery estuary water. China Environmental Science, 25(Suppl.): 47-51
Yu G, Niu JF, Huang J, et al. 2005. POPs: A New Global Environmental Problem. Science and Technology Press, Beijing, China
Yu XM, Lu JL, Hao LB et al. 2007. Content and composition of organochlorinated pesticides in soils of central Jilin, China. Geological Bulletin of China, 26(11): 1476-1479
Zhang HL, Zhang HM. 1998. New direction of pesticide development: biopesticides. Journal of Modern Agriculture, 4:9
Zhang L, Liu HY, Zhang H, et al. 2008a. The Residues and Distribution of Organochlorine Pesticides in Arable Land in the East of Hunan Province. Research of Environmental Sciences, 21(1): 118-123
Zhang H, Liu HY, Zhang L, et al. 2008b. Residues and distribution characters of organochlorine pestcides in vegetable soil in the northeast of Hunan. Journal of Agro-Environment Science, 27(2): 555-559
Zhang WJ. 2008. A forecast analysis on world population and urbanization process. Environment, Development and Sustainability, 10: 717-730
Zhang WJ, Bai CJ, Liu GD. 2007. A longer-term forecast on global supply and demand of food products. Journal of Food, Agriculture and Environment, 5(1): 105-110
Zhang WJ, Pang Y. 2009. Impact of IPM and transgenics in the Chinese agriculture. In: Integrated Pest Management: Dissemination and Impact (R Peshin and AK Dhawan eds). Springer, 525-553
Zhang WJ, Qi YH, Zhang ZG. 2006. A long-term forecast analysis on worldwide land uses. Environmental Monitoring and Assessment, 119: 609-620
Zhang WJ, Xia YK, Wei W, Dai HQ, Zhang XY. 2008c. A long-term forecast analysis on global crops production. In: Crop Protection Research Advances (Vol. 2) (EN Burton and PV Williams eds). Nova Science Publishers, Inc., New York, USA
Zhang WJ, Zhang XY. 2007. A forecast analysis on fertilizers consumption worldwide. Environmental Monitoring and Assessment, 133: 427-434
Zhang YB. 2009. Analyze the importance of pesticides based on world’s needs on grain and agricultural development. World Pesticides, 31(1): 1-3
Zhang ZL. 2007. Situation and countermeasures of phytotoxicity of facility vegetables in Shannxi Province. Shaanxi Journal of Agricultural Sciences, 1: 108-111
Zhao L, Hou H, Guo PY, et al. 2009. Distribution of organochlorine pesticides in soils in Haihe River and Haihe estuary area, China Environmental Science, 30(2): 543-550
Zheng DM. 2006. Research on Industrial Development of Biopesticides. Ocean Press, Beijing, China
Zhu CX, Bai XS, Zhang M. 2002. The status quo of development and perspective of biopesticides. Shanghai Environmental Sciences, 21(11): 654-659