Nota Técnica
*e-mail: [email protected]
OPTIMIZATION OF CHROMATOGRAPHIC CONDITIONS AND COMPARISON OF EXTRACTION EFFICIENCIES OF FOUR DIFFERENT METHODS FOR DETERMINATION AND QUANTIFICATION OF PESTICIDE CONTENT IN BOVINE MILK BY UFLC-MS/MS
Fabiano A. S. Oliveiraa,c, Fernando D. Madureiraa, Renata P. Lopesa,b, Marina G. Ferreirac, Benito Soto-Blancoc and Marília
M. Meloc,*
aLaboratório Nacional Agropecuário, Ministério da Agricultura, Pecuária e Abastecimento, Av. Rômulo Joviano s/n, 33600-000
Pedro Leopoldo – MG, Brasil
bDepartamento de Química, Universidade Federal de Viçosa, Av. Peter Henry Rolfs s/n, 36570-000 Viçosa – MG, Brasil cDepartamento de Clínica e Cirurgia Veterinárias, Escola de Veterinária, Universidade Federal de Minas Gerais, Av. Pres. Antônio
Carlos 6627, 31270-901 Belo Horizonte – MG, Brasil
Recebido em 14/04/2014; aceito em 04/08/2014; publicado na web em 22/09/2014
This paper describes the optimization of a multiresidue chromatographic analysis for the identification and quantification of 20 pesticides in bovine milk, including three carbamates, a carbamate oxime, six organophosphates, two strobilurins, a pyrethroid, an oxazolidinedione, an aryloxyphenoxypropionate acid/ester, a neonicotinoid, a dicarboximide, and three triazoles. The influences of different chromatographic columns and gradients were evaluated. Furthermore, four different extraction methods were evaluated; each utilized both different solvents, including ethyl acetate, methanol, and acetonitrile, and different workup steps. The best results were obtained by a modified QuEChERS method that lacked a workup step, and that included freezing the sample for 2 hours at -20 °C. The results were satisfactory, yielding coefficients of variation of less than 20%, with the exception of the 50 µg L-1 sample of famoxadone, and recoveries between 70 and 120%, with the exception of acephate and bifenthrin; however, both analytes exhibited coefficients of variation of less than 20%.
Keywords: pesticides; milk; multiresidue analysis; mass spectrometer.
INTRODUCTION
Milk is traditionally consumed daily by many people. In Brazil, milk is popular, but it may contain residual pesticides from different sources, including contaminated concentrated animal feed, grass and corn silage, water, top-layer soil, and air. These pesticides are used on a large scale for agricultural purposes, including the control of ecto-parasites in livestock. Therefore, their adverse effects on both human health and the environment are a matter of public concern.1 Increasing
incidences of cancer, chronic kidney diseases, immunosuppression, sterility, endocrine disorders, and neurological and behavioral di-sorders, especially among children, have been attributed to chronic pesticide poisoning.2 The detection of these harmful pesticides in
raw bovine milk and that of other ruminants is worrying, since milk and dairy products are widely consumed throughout the world.3,4
Various regulatory organizations have set stringent controls on pesticide use in order to minimize such problems. Regulatory guideli-nes set maximum residue levels (MRLs) for most of these compounds. Special attention is paid to the safety of children and infants, as they represent a vulnerable group within the population. The MRL list, part of the European Union Plant Protection Products Directive, covers a wide variety of commodities and pesticides and is regularly updated.5 In Brazil, the Ministry of Agriculture, Livestock and Food
Supply (MAPA) ensures food safety by developing programs which promote the improvement of the quality of food, both that consumed domestically and exported. As part of this process, MAPA published Normative Instruction nº 42 on December 31, 2008, establishing the National Control Plan for Residues and Contaminants (PNCRC).6
Seeing how this legislation allows for the agricultural, household and livestock use of more than 200 chemicals at only very low limits, the
continued development of sensitive multiresidue methods is needed in order to optimize analyses that ensure continued public health.7
Pesticide analysis in consumables has historically been accom-plished through the use of gas chromatography–mass spectrometry (GC–MS), for which conventional library search routines are well established.8 Unlike GC, laborious and costly derivatization steps can
be avoided in LC especially for the analysis of polar compounds.9
Thus, today LC–MS/MS has become a powerful tool for pesticide residue analysis in a variety of complex matrices, due to its selec-tivity and sensiselec-tivity, a substantial reduction of sample-treatment steps compared with other methodologies such as GC–MS, and its reliable quantification and confirmation at low concentration levels.10
Many extraction methods have been proposed for the analysis of pesticides in milk and other consumables, such as extraction with non--polar solvents,11 Solid-Matrix Phase Dispersion,12 Solid-Phase Micro
Extraction (SPME),1 Solid-Phase Extraction (SPE),13,14 Dispersive
Liquid-Liquid Microextration,15 Microwave-Assisted Extraction
(MAE),16 and the QuEChERS (Quick, Easy, Cheap, Effective,
Rugged, Safe) method.7,16 In addition, solid-liquid extraction (SLE)
has become particularly popular in the last decade, and is now the most used extraction method for the quantification of pesticide residues in many animal-derived consumables, including meat and meat products, animal fat, viscera, eggs, and fish. Similarly, liquid-liquid extraction (LLE) is still the preferred method for pesticide extraction in milk.17
yield more polar compounds as metabolites or degradation products. Furthermore, the extraction solvent should ideally be the same or as similar as possible to the mobile phase to be used in chromatographic assays. As acetonitrile and methanol are the primary organic solvents used in liquid chromatography, extraction methods that employ these solvents were chosen for evaluation.
In milk, both lipophilic and hydrophilic pesticides may be found in detectable levels.18 Acetonitrile allows for the efficient extraction
of these pesticides, while its acidification improves the extraction of substances that are unstable in basic media. Meanwhile, methanol can serve as an alternative to acetonitrile, given both its lower cost and toxicity. Although methanol also presents potential risk to human health (causing side effects similar to those caused by acetonitrile), the occupational exposure levels and the lethal concentrations are about twice as high (1.5 to 2.0 g/m3 h) as those for acetonitrile. The chronic
effects of inhalation are also less serious. The recommended limit for occupational exposure for 8 h shifts is 0.26 g/m3 MeOH dissolved
in the air. This value is greater than thrice the mean recommended concentration of acetonitrile for avoiding any toxic effect.19
Although there have been several studies concerning the detection of pesticide residues in milk, most do not offer a comparative analy-sis of different approaches. Few studies involved the evaluation of different methods for pesticide residue extraction and determination of the most suitable method. This work therefore aims to determine the optimal extraction and LC-MS/MS conditions for the detection of 20 of the most commonly found pesticides in milk, including carbamates (3-hydroxycarbofuran, carbaryl, and carbofuran), carba-mate oximes (aldicarb), organophosphates (acephate, chlorpyrifos, diazinon, disulfoton, etion, and omethoate), strobilurins (azoxystrobin and pyraclostrobin), pyrethroids (bifenthrin), and oxazolidinediones (famoxadone), by testing and comparing the most commonly used methods.
EXPERIMENTAL
Chemicals and materials
All reagents were of analytical grade, unless otherwise specified. LC-MS grade acetonitrile and glacial acetic acid were supplied by Merck (Darmstadt, Germany). Methanol was obtained from Baker (Xalostoc, Mexico). Anhydrous magnesium sulfate (purity ≥ 97%)
was purchased from Sigma-Aldrich (Saint Louis, USA), while anhydrous sodium acetate and ammonium acetate (purity ≥ 98%)
were purchased from Vetec (Rio de Janeiro, Brazil). Formic acid was purchased from Tedia (Fairfield, USA). Ultrapure water was generated by a Millipore Milli-Q system (Milford, USA). All standards were of high purity (>98.0%) and were purchased from Riedel-de Haën (Seelze, Germany) or Sigma-Aldrich. Individual stock solutions were prepared at 1,000 ng L-1 in acetonitrile or methanol and stored
at -20 ± 2 °C. The working solutions were prepared by diluting these stock solutions.
Chromatographic conditions
Chromatographic analyses were performed using an ultra fast liquid chromatographic (UFLC) system (Shimadzu LC20ADXR) equipped with a binary pump (Shimadzu LC20ADXR), an auto sampler (Shimadzu SIL20ACXR), and a column oven (Shimadzu CTO20AC). Separations were achieved using a Shimadzu Shim-pack XR-ODSII column (2.0 × 100 mm, 2.2 µm particle size) and
a Phenomenex Synergi Fusion-RP column (2.0 × 50 mm, 2.5 µm
particle size). Gradient separation was carried out with a mobile phase consisting of ammonium acetate (10 mmol L-1) with 0.01%
formic acid (A) and methanol (B) at a flow rate of 0.5 mL min-1. Total
run time was 13 min, divided into the following gradient (A:B): 1:1 (6 min), 1:4 (5 min), 1:9 (4 min), 1:1 (0.5 min), and 1:1 (2.5 min). An injection volume of 5 µL was used and the column temperature was set to 60 °C.
Mass spectrometric conditions
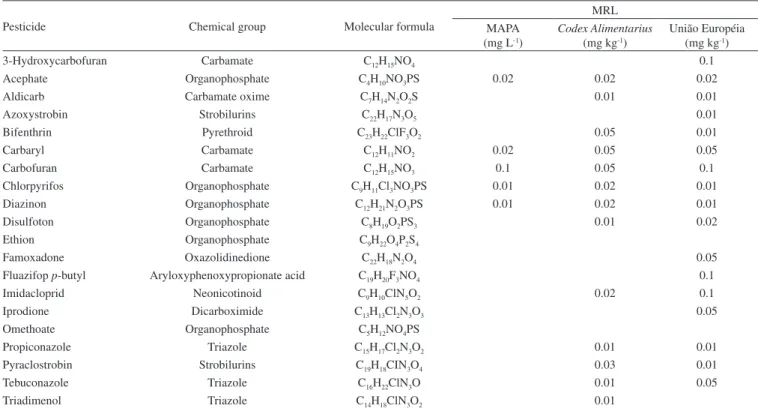
Mass spectrometric analysis was carried out using a 5500 Triple Quad mass spectrometer (Applied Biosystems/MDS SCIEX, Concord, Canada). The instrument was operated under electrospray ionization conditions (ESI) in both positive and negative ion modes. Instrument settings, data acquisition, and processing were controlled by Analyst software (Version 1.5.1, Applied Biosystems). 154 diffe-rent pesticides, which were previously infused and optimized to the mass spectrometer, were used to study the full scope of the method. However, to facilitate the analysis and the data processing in the study to compare the extraction methods, 20 pesticides that represent diffe-rent classes of pesticides detected in milk and presenting retention times within the window of the chromatographic run were selected. Table 1 presents the selected analytes and provides their chemical classes and MRLs, as provided by MAPA,6 Codex Alimentarius,20
and the European Union.21
The chromatograms of the evaluated compounds were used as standards for comparison with the test samples, allowing for a determination of the method’s selectivity. The source parameters optimized for all 154 pesticides are as follows: ion spray voltage, 5.5 kV for ESI (+) and 4.5 kV for ESI (-); curtain gas, 20 psi; collision gas, 8 psi; nebulizer and auxiliary gas, 30 psi; ion source temperature, 500 °C. The optimal values for declustering potential (DP), collision energy potential (CE), and collision exit potential (CXP) for the 20 compounds selected for this study are shown in Table 2.
Samples
Milk was obtained from official samples of the MAPA Laboratory of Animal Products (LANAGRO-MG).
Sample preparation
Four different extraction methods were compared: method A and method B employing acetonitrile (with different stages of clean up), method C employing methanol, and method D employing ethyl aceta-te. The pilot experiment employed recovery assays for concentrations of 10.0 and 50.0 µg kg-1. Six repeat experiments were completed for
each concentration. The methods were evaluated based on percent recovery and coefficient of variation.
Method A
This method was based on the method developed by Salste and coworkers.22 The homogenized sample (10.0 mL) was transferred to a
polypropylene centrifuge tube (50 mL) and spiked with predetermined amounts of pesticides. Subsequently, 3.0 g of sodium carbonate (that functions as a pH adjuster), 20.0 mL of ethyl acetate, and 10.0 g of sodium sulfate were added, after which the sample was sonicated for 3 min and centrifuged at 3800 g for 3 min. Finally, the extract was filtered through a PTFE filter (0.20 µm) and injected into the UFLC-MS/MS system.
Method B
by Dagnac and colleagues.24 The homogenized sample (5.0 mL) was
transferred to a polypropylene centrifuge tube (50 mL) and spiked with predetermined amounts of pesticides. Next, 5.0 mL of 0.1 % formic acid in methanol (v/v) was added, after which the sample was shaken manually for 2 min and centrifuged at 4000 rpm for 5 min. The supernatant (1 mL) was then transferred to a Büchner funnel containing approximately 10.0 g of sodium sulfate. The resulting
extract was transferred to a PTFE tube (50 mL) containing 6.0 g of magnesium sulfate, 1.0 g of primary and secondary amines (PSA), and 1.0 g of graphitized carbon black. The sample was shaken manually for 2 min and centrifuged at 4000 rpm for 5 min. The supernatant was then collected and dried under nitrogen. Finally, 1.0 mL of me-thanol was added to the residue and the solution was injected into the UFLC-MS/MS system.
Table 1. Pesticides tested in this study with their respective chemical groups and maximum residual levels (MRL)
Pesticide Chemical group Molecular formula
MRL MAPA
(mg L-1)
Codex Alimentarius (mg kg-1)
União Européia (mg kg-1)
3-Hydroxycarbofuran Carbamate C12H15NO4 0.1
Acephate Organophosphate C4H10NO3PS 0.02 0.02 0.02
Aldicarb Carbamate oxime C7H14N2O2S 0.01 0.01
Azoxystrobin Strobilurins C22H17N3O5 0.01
Bifenthrin Pyrethroid C23H22ClF3O2 0.05 0.01
Carbaryl Carbamate C12H11NO2 0.02 0.05 0.05
Carbofuran Carbamate C12H15NO3 0.1 0.05 0.1
Chlorpyrifos Organophosphate C9H11Cl3NO3PS 0.01 0.02 0.01
Diazinon Organophosphate C12H21N2O3PS 0.01 0.02 0.01
Disulfoton Organophosphate C8H19O2PS3 0.01 0.02
Ethion Organophosphate C9H22O4P2S4
Famoxadone Oxazolidinedione C22H18N2O4 0.05
Fluazifop p-butyl Aryloxyphenoxypropionate acid C19H20F3NO4 0.1
Imidacloprid Neonicotinoid C9H10ClN5O2 0.02 0.1
Iprodione Dicarboximide C13H13Cl2N3O3 0.05
Omethoate Organophosphate C5H12NO4PS
Propiconazole Triazole C15H17Cl2N3O2 0.01 0.01
Pyraclostrobin Strobilurins C19H18CIN3O4 0.03 0.01
Tebuconazole Triazole C16H22ClN3O 0.01 0.05
Triadimenol Triazole C14H18ClN3O2 0.01
Table 2. MS/MS conditions for each compound
Compound RTWsa, min Precursor ion Quantification transition (CEb, V; CXPc, V)
Confirmation transition (CEb, V; CXPc, V)
Method C
This method is a modification of the QuEChERS method. The homogenized sample (10.0 mL) was transferred to a polypropylene centrifuge tube (50.0 mL) and spiked with predetermined amounts of pesticides. Next, 10.0 mL of acetonitrile was added, and the sample was shaken at 3000 rpm for 1 min. Then, magnesium sulfate (4.0 g) and sodium acetate (1.0 g) were added, after which the sample was agitated again under the same conditions described above. The sample was then centrifuged at 4000 rpm for 9 min. The supernatant was subsequently transferred to another polypropylene centrifuge tube (50 mL) containing sodium sulfate (1.5 g) and stored at -20 °C for 2 hours. Then, the sample was agitated at 3000 rpm for 3 min and centrifuged at 4000 rpm for 9 min. Finally, 1.0 mL of the supernatant was transferred to vial and injected into the UFCL-MS/MS system.
Method D
This method is based on the method developed by Stolker and coworkers.14 The homogenized sample (10.0 mL) was transferred to a
polypropylene centrifuge tube (50.0 mL) and spiked with predetermi-ned amounts of pesticides. Next, 10.0 mL of acetonitrile was added, and the sample was shaken manually and then centrifuged at 3600 g for 15 min at 10 °C. Next, 1.0 mL of the supernatant was diluted with water (9.0 mL) and subjected to SPE with a C-18 cartridge that was previously conditioned with 6 mL of a methanol/water (1:1, v/v) solution and washed with 3.0 mL of water. The analytes were eluted from the cartridge with 3.0 mL of methanol, after which the extract volume was reduced to 500 µL. Finally, the extract volume
was adjusted to 1 mL with methanol and the sample was injected into the UFCL-MS/MS system.
Selectivity and calibration curves
The selectivity of the method was evaluated by injecting blank samples subjected to the above extraction methods into the UFCL-MS/MS system. The absence of any signal above a signal-to-noise (S/N) ratio of 3 at the retention times of the target compounds was taken to mean that there are no molecules endogenous to milk that show identical elution.
The calibration curves were acquired in acetonitrile to provide a standard for recovery measurements and to simplify the experiment. The construction of the curve in solvent was established considering the fact of being evaluated four different extraction methods and the parameter chosen for this comparison to be recovering, that depends on the curve to be calculated. Thus, it is needed to establish a single curve to minimize the possible effects of the co-extracted matrix components by the different methodologies. Once established the extraction methodology to be employed by the laboratory, the analyti-cal curve is prepared in extract matrix free of the analytes studied to compensate the matrix effect that is known to occur on the analysis of pesticide residues. Sample concentrations of 5.0, 10.0, 20.0, 30.0, 40.0, 50.0, and 100.0 µg kg-1 were used to construct the calibration
curves, with each concentration being run six times. Samples were tested in a random order, and all solutions were prepared independen-tly. For the purposes of simultaneous quantification and identification, two Multiple Reaction Monitoring (MRM) transitions for each analyte (Table 1) were used in order to avoid false negatives at trace pesticide levels. The data were analyzed using the Analyst software previously described. The model for the regression curve for each compound was selected by applying a homoscedasticity test. The fit quality and significance of the regression model employed were evaluated using the lack-of-fit test. A 95% significance level was used for all tests.
RESULTS AND DISCUSSION
Optimization of instrumental parameters
The MS/MS parameters for each target pesticide were optimized individually in both detection modes. The injected solutions were obtained by diluting the stock solutions to a concentration of 1 ng
µL-1 with a 4:3:3 mixture of methanol/water/ammonium acetate 10
mmol L-1. Optimization was completed in semiautomatic mode for
all compounds. System control and data acquisition and processing were performed using the Analyst software previously discussed. The mass range was set to 50-1000 m/z. The ionization parameters were optimized by Flow Injection Analysis. The optimal flow rate of the mobile phase was found to be 0.5 mL min-1. Once these values were
determined, two different transitions were selected (precursor-product ion) for each pesticide, one for quantification (hereon referred to as the ion quantifier) and another for confirmation (hereon referred to as the ion qualifier). These ions were monitored using the MRM mode. All results are shown in Table 2.
Selection of the chromatographic column
The separation of the analytes by column chromatography is a critical step for pre-fractionation of the sample extract. Therefore, the selection of the chromatographic column is crucial for obtaining good resolution and symmetrical peaks. Hence, in this work, two different columns (Shim-pack XR-ODS II and Synergi Fusion-RP) were evaluated for their potential in pesticide separation through the testing of a solution containing all studied analytes, each at a con-centration of 0.1 mg L-1. The conditions used were identical to the
optimized conditions described previously. Separation was carried out at a flow rate of 0.5 mL min-1 and under the following gradient
(A:B): 13:7 (2.5 min), 1:4 (2 min), and 9:1 (4 min).
The use of LC-MS/MS technique allows multiresidue analysis in a single run, without compromising the analysis quality, even in the case of highly complex chromatograms. This is possible because the detection system monitors each individual transition (precursor and fragment ion) generating their own chromatogram that can be extracted (Extracted Ion Chromatography–EIC) from the total ion chromatogram (TIC) by software system control and data processing. The chromatograms obtained for carbendazim and tridemorph with the Shim-pack XR-ODS II column furnished defined peaks. Note that the MRM transitions for tridemorph are present as two peaks; this results from the fact that the analytical standard consists of a mixture of 4-alkyl-2,6-dimethyl morpholine (C11-C14 counterparts) whose main component is the homologue tridecyl (2,6-dimethyl-4--tridecylmorpholine), named tridemorph. Similar behaviors were observed for other analytes, yet are not provided here. On the other hand, the Synergi Fusion-RP provided broad peaks with notable tails. This suggests that interactions between the analytes and colu-mn persist for a period longer than ideal to achieve good resolution. Furthermore, while the two tridemorph peaks are present, they show much lower resolution. Based on these results, the Shim-pack XR-ODS II column was selected for further optimization.
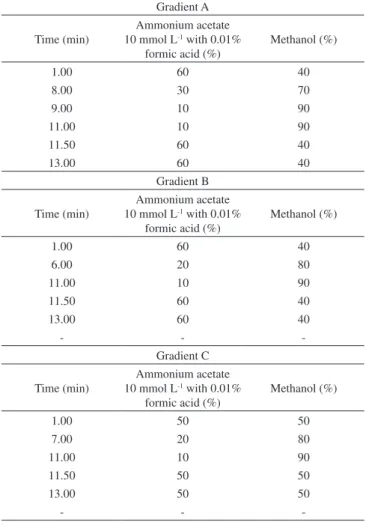
Mobile phase optimization
Three different compositions were tested for the mobile phase (Table 3). The aqueous phase was composed of a mixture of 10 mmol L-1 ammonium acetate acidified with 0.01% formic acid (mobile
parameters previously established. The standard solution concentra-tion (0.1 ng µL-l) was injected (four replicates) under the conditions
described previously (mass spectrometric conditions). The results were evaluated for response profile obtained in the TIC. According to SANCO/12495/2011 guide25 and Thompson et al.,26 the
signal-to--noise ratio (S/N) for unequivocal differentiation of the analyte signal from the interfering signal is 3:1. Finally, the chromatograms were evaluated on the basis of peak shape, chromatographic resolution, and S/N for all analytes studied.
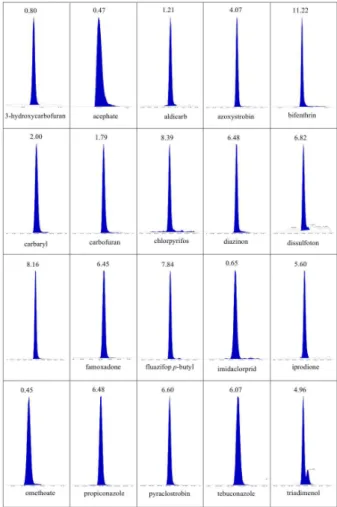
The three gradients described in Table 2 were evaluated for re-solution and peak distribution. The evaluation was done by the total ion chromatograms (TIC) obtained with each gradient (Figures 1, 3 and 4) for the complete method to be established, which included 154 different analytes. The TIC obtained for gradient C (Figure 1), based on small changes in gradient B, showed the best profile among the three gradients evaluated. The peaks are more evenly distributed along the chromatographic window and are resolved more symmetrically. Furthermore, this gradient provided the best selectivity for the 20 selected pesticides, as shown by the extracted-ion chromatograms (EIC) (Figure 2).
Gradient A (Figure 3) yielded several broad peaks with double pits. Furthermore, many peaks accumulated in the region between 9.0 and 11.0 min, indicating poor separation. Although mass spectrome-try can solve the complex chromatograms on the basis of EIC from the TIC, the presence of a large number of chromatographic peaks in the chromatogram should be avoided because the mass detection system continuously monitors the selected transitions for the analytes, which can cause the phenomenon of cross talk. This happens when the retention time of the pesticide peaks are close and the transitions are similar, causing errors in the detection and quantification of pes-ticides involved. Gradient B (Figure 4), a modification of gradient A, showed improvement in the region between 9.0 and 11.0 min. However, many peaks in turn were concentrated between 3.5 and
Figure 1. Total ion chromatogram (TIC) obtained by LC–MS/MS all analytes at 10.0 µg L-1 using gradient B (Table 3). The chromatograms show the analytes
well distributed through the chromatographic window. Note that the last two minutes are used to equilibrate the method to the next injection
Table 3. Composition gradient optimization
Gradient A Time (min)
Ammonium acetate 10 mmol L-1 with 0.01%
formic acid (%)
Methanol (%)
1.00 60 40
8.00 30 70
9.00 10 90
11.00 10 90
11.50 60 40
13.00 60 40
Gradient B Time (min)
Ammonium acetate 10 mmol L-1 with 0.01%
formic acid (%)
Methanol (%)
1.00 60 40
6.00 20 80
11.00 10 90
11.50 60 40
13.00 60 40
- -
-Gradient C Time (min)
Ammonium acetate 10 mmol L-1 with 0.01%
formic acid (%)
Methanol (%)
1.00 50 50
7.00 20 80
11.00 10 90
11.50 50 50
13.00 50 50
-Figure 2. Chromatograms extracted ions of the 20 pesticides from this study showing the retention time (in minutes) for each compound, obtained from the total ion chromatogram (TIC) of the Figure 1
Figure 3. Total ion chromatogram (TIC) obtained by LC–MS/MS all analytes at 10.0 µg L-1 using gradient A (Table 3). Chromatogram with unequal distribution
of analytes in the chromatographic window. There is a large concentration of analytes in the final portion including compounds eluting in the time window in which aimed to restore the initial conditions of the method for the next injection
5.5 min. In addition, some of the peaks were broader, indicating the need for a new gradient.
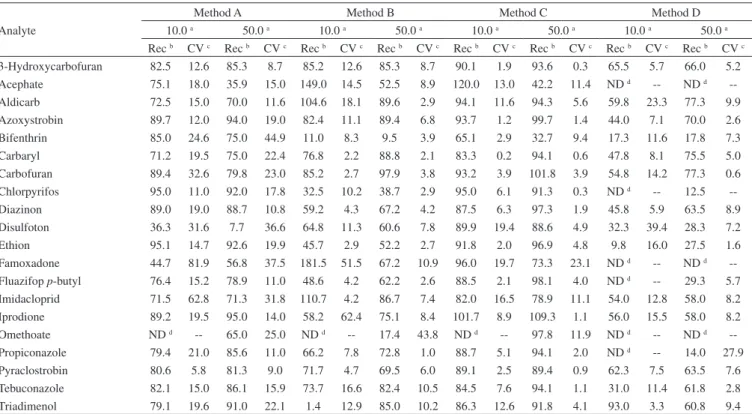
Comparison of the efficiency of methods A, B, C, and D
Table 4 shows the mean recoveries and coefficients of variation for all extraction methods. Omethoate showed no recovery at 10 µg kg-1 for any method. This suggests that interactions between milk
components and omethoate can occur at low concentrations, affec-ting recovery. In comparing methods A and C, both of which lacked a workup step, method A showed far worse results than method C. It is possible that the ethyl acetate used in method A extracts higher amounts of the less polar compounds commonly found in milk, such as cholesterol and fatty acids (whose compositions in raw milk are, respectively, 140 mg L-1 and 3.2%).25,27 Furthermore, the sonication
step in method A may allow for the additional extraction of unwan-ted components, leading to very high recovery dispersion and high coefficients of variation (see Table 4).
Meanwhile, in comparing methods B and D, both of which included a workup step, method D showed far lower recoveries than method B. In this case, the C-18 stationary phase of the cartridge likely retains the analytes more effectively, such that the solvent volume was insufficient for complete extraction. However, while method B showed a higher recovery, it was insufficient to meet international standards.25 The amount of PSA used far exceeded
that of the original QuEChERS method; this may have favored retention of the analytes in the dispersed phase. Method C showed better performance for almost all pesticides. The recoveries obtained by this method are within the acceptable range of 70 to 120%.25
Furthermore, the repeatability (calculated as the relative standard deviation) was lower than 20%, as recommended by the Brazilian INMETRO,28 SANCO/12495/2011,25 Directive 2002/657,29 and the
Codex Alimentarius.30 Only bifenthrin, at both concentrations, and
Figure 4. Total ion chromatogram (TIC) obtained by LC–MS/MS all analytes at 10.0 µg L-1 using gradient B (Table 3). Chromatogram with unequal distribution of analytes in the chromatographic window. There is a great concentration of analytes in the initial portion of the chromatogram and also presence of compounds eluting in the time window in which aimed to restore the initial conditions of the method for the next injection
Table 4. Evaluation of recovery (Rec) and coeficiente of variation (CV) for methods of extraction A, B, C and D using a common external calibration curve solvent
Analyte
Method A Method B Method C Method D
10.0 a 50.0 a 10.0 a 50.0 a 10.0 a 50.0 a 10.0 a 50.0 a Rec b CV c Rec b CV c Rec b CV c Rec b CV c Rec b CV c Rec b CV c Rec b CV c Rec b CV c 3-Hydroxycarbofuran 82.5 12.6 85.3 8.7 85.2 12.6 85.3 8.7 90.1 1.9 93.6 0.3 65.5 5.7 66.0 5.2 Acephate 75.1 18.0 35.9 15.0 149.0 14.5 52.5 8.9 120.0 13.0 42.2 11.4 ND d -- ND d --Aldicarb 72.5 15.0 70.0 11.6 104.6 18.1 89.6 2.9 94.1 11.6 94.3 5.6 59.8 23.3 77.3 9.9 Azoxystrobin 89.7 12.0 94.0 19.0 82.4 11.1 89.4 6.8 93.7 1.2 99.7 1.4 44.0 7.1 70.0 2.6 Bifenthrin 85.0 24.6 75.0 44.9 11.0 8.3 9.5 3.9 65.1 2.9 32.7 9.4 17.3 11.6 17.8 7.3 Carbaryl 71.2 19.5 75.0 22.4 76.8 2.2 88.8 2.1 83.3 0.2 94.1 0.6 47.8 8.1 75.5 5.0 Carbofuran 89.4 32.6 79.8 23.0 85.2 2.7 97.9 3.8 93.2 3.9 101.8 3.9 54.8 14.2 77.3 0.6 Chlorpyrifos 95.0 11.0 92.0 17.8 32.5 10.2 38.7 2.9 95.0 6.1 91.3 0.3 ND d -- 12.5 --Diazinon 89.0 19.0 88.7 10.8 59.2 4.3 67.2 4.2 87.5 6.3 97.3 1.9 45.8 5.9 63.5 8.9 Disulfoton 36.3 31.6 7.7 36.6 64.8 11.3 60.6 7.8 89.9 19.4 88.6 4.9 32.3 39.4 28.3 7.2 Ethion 95.1 14.7 92.6 19.9 45.7 2.9 52.2 2.7 91.8 2.0 96.9 4.8 9.8 16.0 27.5 1.6 Famoxadone 44.7 81.9 56.8 37.5 181.5 51.5 67.2 10.9 96.0 19.7 73.3 23.1 ND d -- ND d --Fluazifop p-butyl 76.4 15.2 78.9 11.0 48.6 4.2 62.2 2.6 88.5 2.1 98.1 4.0 ND d -- 29.3 5.7 Imidacloprid 71.5 62.8 71.3 31.8 110.7 4.2 86.7 7.4 82.0 16.5 78.9 11.1 54.0 12.8 58.0 8.2 Iprodione 89.2 19.5 95.0 14.0 58.2 62.4 75.1 8.4 101.7 8.9 109.3 1.1 56.0 15.5 58.0 8.2 Omethoate ND d -- 65.0 25.0 ND d -- 17.4 43.8 ND d -- 97.8 11.9 ND d -- ND d --Propiconazole 79.4 21.0 85.6 11.0 66.2 7.8 72.8 1.0 88.7 5.1 94.1 2.0 ND d -- 14.0 27.9 Pyraclostrobin 80.6 5.8 81.3 9.0 71.7 4.7 69.5 6.0 89.1 2.5 89.4 0.9 62.3 7.5 63.5 7.6 Tebuconazole 82.1 15.0 86.1 15.9 73.7 16.6 82.4 10.5 84.5 7.6 94.1 1.1 31.0 11.4 61.8 2.8 Triadimenol 79.1 19.6 91.0 22.1 1.4 12.9 85.0 10.2 86.3 12.6 91.8 4.1 93.0 3.3 60.8 9.4 a. concentrations are presented as µg kg-1; b. presented as %; c. presented as %; d. ND = not detected.
observed repeatability of less than 15% for both pesticides suggests a reproducible method. Note that this method includes a freezing step; this likely contributed to the cleaner extracts observed, because the polar and fatty compounds present in milk were more likely to be arrested in the solid phase. This is reinforced by the observation that visual separation occurred after cooling.
CONCLUSIONS
ammonium acetate 10 mmol L-1 solution containing 0.01% formic
acid and methanol. The modified QuEChERS procedure provided the best results, yielding a higher number of analytes and meeting the requirements of recovery (70–120%) and coefficient of variation requirements (<20%). This procedure lacks additional workup steps, leading to reduced extraction time and cost, because it removes one step from the overall procedure and the adsorbents used in cleaning are very expensive. The addition of a freezing step allowed for cle-aner extracts.
ACKNOWLEDGEMENT
Marina G. Ferreira was supported by a postdoctoral fellowship from FAPEMIG. This research has been supported by a grant from the CNPq and FAPEMIG; language editing support was provided by the Pró-Reitoria de Pesquisa of the Universidade Federal de Minas Gerais.
REFERENCES
1. Fernandez-Alvarez, M.; Llompart, M.; Lamas, J.P.; Lores, M.; Garcia-Jares, C.; Cela, R.; Dagnac, T.; Anal. Chim. Acta 2008, 617, 37. 2. Mishra, K.; Sharma, R. C.; Sci. Total Environ. 2011, 409, 4939. 3. Seccia, S.; Albrizio, S.; Fidente, P.; Montesano, D.; J. Chromatogr. A
2011, 1218, 1253.
4. Tsiplakou, E.; Anagnostopoulos, C. J.; Liapis, K.; Haroutounian, S. A.; Zervas, G.; Chemosphere 2010, 80, 504.
5. European Commission. Regulation (EC) No 1107/2009 of the European Parliament and of the council of 21 October 2009 concerning the placing of plant protection products on the market and repealing Council Directives 79/117/EEC and 91/414/EEC. Official Journal of European Community. 2009, 309, 1.
6. Brasil, Ministério da Agricultura, Pecuária e Abastecimento, Secretaria de Defesa Agropecuária. Instrução Normativa nº 42. Institui o Plano Nacional de Controle de Resíduos e Contaminantes em Produtos de Origem Vegetal - PNCRC/Vegetal, Diário Oficial da União, Brasília, 2008.
7. Bastos, L. H. P.; Gouvêa, A. V.; Málaga, F.; Cardoso, M. H. W. M.; Jacob, S. C.; Nóbrega, A. W.; Quim. Nova 2012, 35, 1657.
8. Koesukwiwat, U.; Lehotay, S. J.; Leepipatpiboon, N.; J. Chromatogr. A
2011, 1218, 7039.
9. Fang, G.; Lau, H. F.; Law, W. S.; Li, S. F. Y.; Food Chem. 2012, 134, 2473.
10. Núñez, O.; Gallart-Ayala, H.; Ferrer, I.; Moyano, E.; Galceran, M. T.; J. Chromatogr. A 2012, 1249, 164.
11. Campoy, C.; Jimenez, M.; Olea-Serrano, M. F.; Moreno Frias, M.; Cañabate, F.; Olea, N.; Bayés, R.; Molina-Font, J. A.; Early Hum. Dev.
2001, 65, S183.
12. Di Muccio, A.; Pelosi, P.; Camoni, I.; Attard Barbini, D.; Dommarco, R.; Generali, T.; Ausili, A.; J. Chromatogr. A 1996, 754, 497.
13. Xie, W.; Han, C.; Qian, Y.; Ding, H.; Chen, X.; Xi, J.; J. Chromatogr. A
2011, 1218, 4426.
14. Stolker, A.; Rutgers, P.; Oosterink, E.; Lasaroms, J.; Peters, R.; van Rhijn, J.; Nielen, M.; Anal. Bioanal. Chem. 2008, 391, 2309.
15. Asensio-Ramos, M.; Hernández-Borges, J.; Ravelo-Pérez, L. M.; Afonso, M. M.; Palenzuela, J. A.; Rodríguez-Delgado, M. Á.; Electrophoresis 2012, 33, 1449.
16. Jeong, I. -S.; Kwak, B. -M.; Ahn, J. -H.; Jeong, S. -H.; Food Chem.
2012, 133, 473.
17. LeDoux, M.; J. Chromatogr. A 2011, 1218, 1021.
18. Jeong, I. S.; Kwak, B. M.; Ahn, J. H.; Jeong, S. H.; Food Chem. 2012, 133, 473.
19. Cassini, S. T. A.; Antunes, P. W. P.; Keller, R.; Quim. Nova 2013, 36, 1208.
20. Codex Alimentarius. Report of the 44th Session of the Codex Committee on Pesticide Residues. Codex Alimentarius: Rome, 2012.
21. European Food Safety Authority. EFSA J. 2013, 11, 3130.
22. Salste, L.; Edwardsson, M.; Pagard, U.; Flygh, E.; Liedgren, A.; Rebedy, J.; Pihlstöm, T.; Abstracts of the 8th European Pesticide Residue Workshop, Strasbourg, France, 2010.
23. Anastassiades, M.; Lehotay, S. J.; Stajnbaher, D.; Schenck, F. J.; J. AOAC Int. 2003, 86, 412.
24. Dagnac, T.; Garcia-Chao, M.; Pulleiro, P.; Garcia-Jares, C.; Llompart, M.; J. Chromatogr. A 2009, 1216, 3702.
25. European Commission Health & Consumer Protection Directorate-General. Method validation and quality control procedures for pesticides residues analysis in food and feed. Document No SANCO/12495/2011, 2011.
26. Thompson, M.; Ellison, S.L.R.; Wood, R.; Pure Appl. Chem. 2002, 74, 835.
27. Weerheim, A.; Ponec, M.; Arch. Dermatol. Res. 2001, 293, 191. 28. INMETRO – Instituto Nacional de Metrologia, Normalização e
Qualidade Industrial; Orientação sobre Validação de Métodos Analíticos: DOQ-CGCRE-008. 3 rev. INMETRO: Rio de Janeiro, 2010. 29. European Commission. Commission Decision 2002/657/EC of 12
August 2002. Implementing Council Directive 96/23/EC concerning performance of analytical methods and the interpretation of results. Official Journal of the European Communities. Bruxelas. 12 Ago 2002, L 221/8.