www.biogeosciences.net/6/2245/2009/
© Author(s) 2009. This work is distributed under the Creative Commons Attribution 3.0 License.
Biogeosciences
Nutrient budgets for large Chinese estuaries
S. M. Liu1, G.-H. Hong2, J. Zhang3, X. W. Ye1,*, and X. L. Jiang1
1Key Laboratory of Marine Chemistry Theory and Technology Ministry of Education, Ocean University of China, Qingdao
266100, China
2Korea Ocean Research and Development Institute, Ansan P.O. Box 29, Kyonggi 425-600, Republic of Korea 3State Key Laboratory of Estuarine and Coastal Research, East China Normal University, Shanghai 200062, China
*now at: Qingdao Entry-Exit Inspection and Quarantine Bureau of the People’s Republic of China, Qingdao, 266001, China
Received: 16 September 2008 – Published in Biogeosciences Discuss.: 8 January 2009 Revised: 5 August 2009 – Accepted: 2 October 2009 – Published: 26 October 2009
Abstract. Chinese rivers deliver about 5–10% of global freshwater input and 15–20% of the global continental sed-iment to the world ocean. We report the riverine fluxes and concentrations of major nutrients (nitrogen, phosphorus, and silicon) in the rivers of the contiguous landmass of China and Korea in the northeast Asia. The rivers are generally enriched with dissolved inorganic nitrogen (DIN) and de-pleted in dissolved inorganic phosphate (PO34−) with very high DIN: PO34−concentration ratios. DIN, phosphorus, and silicon levels and loads in rivers are mainly affected by agri-culture activities and urbanization, anthropogenic activities and adsorption on particulates, and rock types, climate and physical denudation intensity, respectively. Nutrient trans-ports by rivers in the summer are 3–4 times higher than those in the winter with the exception of NH+4. The flux of NH+4 is rather constant throughout the year due to the anthropogenic sources such as the sewer discharge. As nutrient composi-tion has changed in the rivers, ecosystems in estuaries and coastal sea have also changed in recent decades. Among the changes, a shift of limiting nutrients from phosphorus to nitrogen for phytoplankton production with urbanization is noticeable and in some areas silicon becomes the limiting nutrient for diatom productivity. A simple steady-state mass-balance box model was employed to assess nutrient budgets in the estuaries. The major Chinese estuaries export<15% of nitrogen,<6% of phosphorus required for phytoplankton production and∼4% of silicon required for diatom growth in the Chinese Seas (Bohai, Yellow Sea, East China Sea, South China Sea). This suggests that land-derived nutrients are
Correspondence to:S. M. Liu ([email protected])
largely confined to the immediate estuaries, and ecosystem in the coastal sea beyond the estuaries is mainly supported by other nutrient sources such as regeneration, open ocean and atmospheric deposition.
1 Introduction
The coastal ocean represents an area of only 10% of the global ocean surface, but accounts for∼25% of global ocean primary production and 80% of global organic carbon burial (Berner, 1982; Smith and Hollibaugh, 1993). Drastic in-creases in delivery of river-borne nutrients owing to land-use changes and anthropogenic emissions are known to result in eutrophication, modifying aquatic food webs and provok-ing more severe hypoxic events in coastal marine environ-ments (Humborg et al., 1997; Ragueneau et al., 2002; Pahlow and Riebesell, 2000; Turner and Rabalais, 1994; Turner et al., 2003). Estuaries, seaward continuum of rivers, modify riverine nutrient fluxes to the sea significantly through bio-geochemical processes. The estuarine processes in turn af-fect the sustainability of near-shore ecosystems, and perhaps over long periods of time, the open ocean ecosystems as well (Nixon et al., 1986).
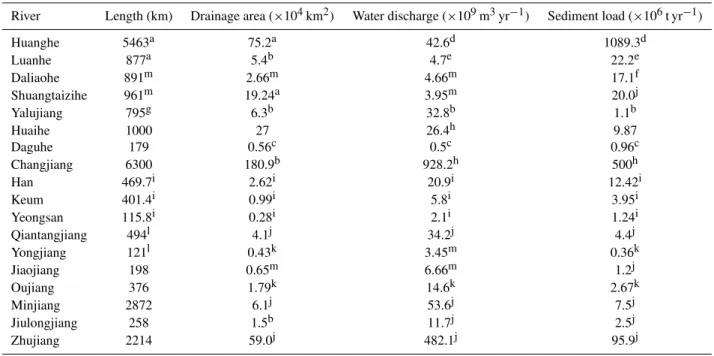
Table 1.Length, drainage area, long-term average water and sediment loads of large rivers discharging into the Chinese Seas.
River Length (km) Drainage area (×104km2) Water discharge (×109m3yr−1) Sediment load (×106t yr−1)
Huanghe 5463a 75.2a 42.6d 1089.3d
Luanhe 877a 5.4b 4.7e 22.2e
Daliaohe 891m 2.66m 4.66m 17.1f
Shuangtaizihe 961m 19.24a 3.95m 20.0j
Yalujiang 795g 6.3b 32.8b 1.1b
Huaihe 1000 27 26.4h 9.87
Daguhe 179 0.56c 0.5c 0.96c
Changjiang 6300 180.9b 928.2h 500h
Han 469.7i 2.62i 20.9i 12.42i
Keum 401.4i 0.99i 5.8i 3.95i
Yeongsan 115.8i 0.28i 2.1i 1.24i
Qiantangjiang 494l 4.1j 34.2j 4.4j
Yongjiang 121l 0.43k 3.45m 0.36k
Jiaojiang 198 0.65m 6.66m 1.2j
Oujiang 376 1.79k 14.6k 2.67k
Minjiang 2872 6.1j 53.6j 7.5j
Jiulongjiang 258 1.5b 11.7j 2.5j
Zhujiang 2214 59.0j 482.1j 95.9j
Note: aRen et al. (2002);bZhang (1996);cLiu et al. (2005a);dNational Compilation Committee of River and Sediment Communiqu´e (2000);e Feng and Zhang (1998);fNational Compilation Committee of Hydrology Almanac (1982); gLiu and Zhang (2004);hLiu et al. (2003a);iHong et al. (2002);jZhang (2002);kMinistry of Hydrology Power of People’s Republic of China (2004);lGao et al. (1993); mChinese Compilation of Embayment (1998b).
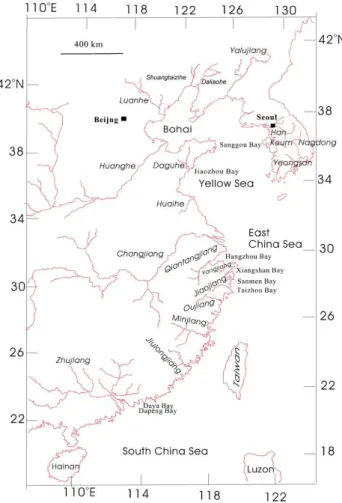
emptying into the Northwest Pacific Ocean (Fig. 1). There-fore, the Chinese rivers are ideal place for investigating lat-itudinal climate influence on weathering and erosion of the continent across the climate zones. The Changjiang may be regarded as a boundary which separates the hot and wet cli-mate in the south (annual average air temperature: >15◦C, annual precipitation: >1000 mm, aridity: <0.75) from the cool and dry climate in the north (annual average air tem-perature: <15◦C, annual precipitation: <1000 mm, aridity: >0.75). The estuaries along the coast of China are heav-ily inhabited including several megacities (>1.6 million) and human alterations of the coastal environment and ecosystems are easily seen.
The present work attempts to provide holistic view on the material fluxes from rivers to sea via estuaries and their trans-formations along their paths and the ecosystem effects using previous biogeochemical surveys in major Chinese rivers and estuaries, including the Changjiang, Zhujiang (Pearl River), and Huanghe during the last 20 years. Several rivers empty-ing into the Yellow Sea from South Korea are also included. This work will provide practical database to solve some en-vironmental problems in coastal ecosystems in the region (Dennison, 2008).
2 Study areas
Studied estuaries for nutrient budgets are shown in Fig. 2. The Yalujiang is the boundary system between China and North Korea, of which 50–60% is in China. The Yalujiang drains a region with well-developed vegetation upstream and extensive cultivation in the lower reaches. The Yalujiang es-tuary is characterized by semi-diurnal tides, with tidal current of 1.5–2.0 m s−1, and tidal range of 4–6 m at spring tide and 2–4 m at neap tide. The semi-diurnal tides affect a region 40 km inland from the river mouth. The turbidity maximum zone stretches over a distance of ca. 10 km in the upper es-tuary of Yalujiang, where concentration of total suspended matter reaches 1.0–2.0 g l−1and has significant impact on the
pathways of terrigenous materials to the Yellow Sea (Zhang et al., 1997). Moreover, industrial and urban areas in the lower reaches introduce ca. 20–30×103t d−1of liquid wastes to the Yalujiang (Zhang et al., 1997).
Fig. 1.Map of the east China and South Korea, showing the location of large rivers and adjacent shelf regions from north to south in the Chinese Seas dealt with in this study.
Daliaohe estuary is a typically frigid-temperate zone system: it is dry in the winter and wet in the summer.
The Huanghe originates on the eastern Qinghai-Tibet Plateau at an altitude of 4500 m, and it flows eastward through northwestern China. It drains a wide basin that exhibits a variety of geological and climatic features. The Huanghe is regarded as the second largest river of the world in terms of sediment load over the last several thousand years, with a widely cited annual sediment load, which rep-resents 6% of the estimated global river sediment flux to the ocean. However, in the last 6 years (2000–2005) the Huanghe sediment load decreased, reverting to its pristine levels of the middle Holocene, prior to human intervention (Saito et al., 2001; Wang et al., 2007a). Historically, the Huanghe has shifted between the Yellow Sea and the Bo-hai. It changed its course from the Yellow Sea to the Bohai in 1855; since then the river has been emptying into the Bo-hai, except for the period between 1939 and 1947 when it reverted to the Yellow Sea as a result of man-made diversion. The Huanghe now enters directly into the Laizhou Bay
lo-cated in the southern part of the Bohai. The decline of the Huanghe sediment load, as well as synchronous decreases in water discharge has had profound physical, ecological, and geomorphological effects on the lower reaches of the river and the coastal areas of the Bohai (Liu et al., 2008b; Wang et al., 2007a). The Huanghe estuary is characterized by irreg-ular semidiurnal tides with the tidal current attaining speeds of 1.5–2.0 m s−1.
The Changjiang originates in the Qinghai-Tibet Pleateau at an altitude>5000 m and flows eastwards to the East China Sea. The Changjiang is the largest river in Euro-Asian conti-nent. Its drainage basin is characterized by large industrial and agricultural activities, which provides 24% of the na-tional arable land, 35% of the nana-tional crop production, 32% of the national gross output of agriculture and industry. It passes through high densely populated areas with about 35% of the national population living in the Changjiang drainage basin in 1992 (Liu et al., 2003a). The “Three Gorges Project” will have far-reaching effects on environment and human health over the drainage basin and adjacent East China Sea (Zhang et al., 1999).
The Minjiang has its origin in the Wuyishan in southeast China. It is the largest river in Fujian Province, which flows to the East China Sea. It is a mountainous stream system significantly affected by typhoons. About 75% of total an-nual water flow in this river occurs during the wet season from April to September. The area of cultivated land in the Minjiang drainage is 55×104ha, with irrigated area of 38×104ha and forestland of 350×104ha. About 150–200 hydropower stations have been constructed over the drainage basin (Xiong et al., 1989). The Minjiang estuary is a macro-tidal delta where macro-tidal influence extends up to 59 km from the river mouth. The estuary is mainly affected by freshwa-ter flow and tidal current.
The Jiulongjiang is the second largest river in Fujian Province. The river catchment is politically administrated by six counties and two cities. Of the land uses in the catch-ment, 12% is arable land, 7% horticultural, 66% forestland, and 1% urban. Physiographically, the Jiulongjiang estuary is a relatively enclosed system. The Jiulongjiang estuary is a typically subtropical system, with temperate climate and average annual rainfall of 1200 mm. The water temperature fluctuates from 13 to 32◦C and pH from 7.77 to 8.47 (Cao et al., 2005).
Fig. 2. Studied estuaries with bars showing boundaries of the budgeted systems, including: Yalujiang Estuary(a), Daliaohe Estuary(b), Huanghe Estuary(c), Changjiang Estuary(d), Minjiang Estuary(e), Jiulongjiang Estuary(f), and Zhujiang Estuary(g).
of about 1 m (Su, 2004) on the south coast of China, and connects to the northern part of the South China Sea. The estuary serves as an important waterway to contact the main land with Hong Kong and Macao and from South China to other economic centers in the world and hence is character-ized by heavy traffic. About 70–80% of total annual water flow in the river occurs during the wet season from April to September.
3 Materials and methods
Eighteen rivers including Huanghe and Changjiang, four coastal seas of Bohai, Yellow, East China and South China were subjected to our analysis (Fig. 1, Tables 1, 2, and 5). Korean rivers discharged into the Yellow Sea were also in-cluded here to complement our basin wide survey. Nutrient budgets were focused on 7 estuaries (Fig. 2).
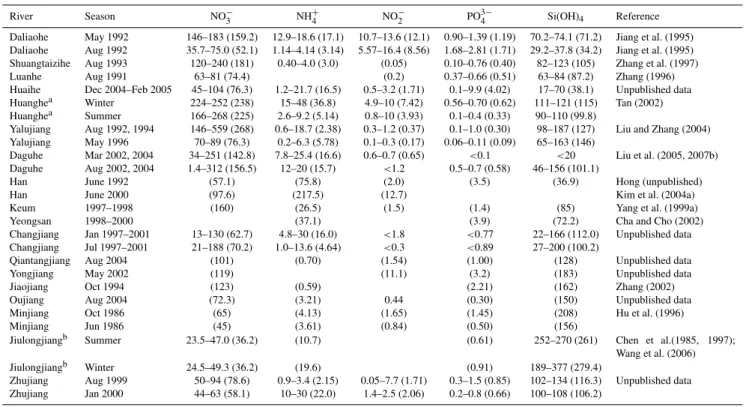
Table 2.Concentrations (µM) of various nutrient species in the major Chinese and Korean rivers discharging into the Chinese Seas, in which the given values in parentheses are the average.
River Season NO−3 NH+4 NO−2 PO34− Si(OH)4 Reference
Daliaohe May 1992 146–183 (159.2) 12.9–18.6 (17.1) 10.7–13.6 (12.1) 0.90–1.39 (1.19) 70.2–74.1 (71.2) Jiang et al. (1995) Daliaohe Aug 1992 35.7–75.0 (52.1) 1.14–4.14 (3.14) 5.57–16.4 (8.56) 1.68–2.81 (1.71) 29.2–37.8 (34.2) Jiang et al. (1995) Shuangtaizihe Aug 1993 120–240 (181) 0.40–4.0 (3.0) (0.05) 0.10–0.76 (0.40) 82–123 (105) Zhang et al. (1997) Luanhe Aug 1991 63–81 (74.4) (0.2) 0.37–0.66 (0.51) 63–84 (87.2) Zhang (1996) Huaihe Dec 2004–Feb 2005 45–104 (76.3) 1.2–21.7 (16.5) 0.5–3.2 (1.71) 0.1–9.9 (4.02) 17–70 (38.1) Unpublished data Huanghea Winter 224–252 (238) 15–48 (36.8) 4.9–10 (7.42) 0.56–0.70 (0.62) 111–121 (115) Tan (2002) Huanghea Summer 166–268 (225) 2.6–9.2 (5.14) 0.8–10 (3.93) 0.1–0.4 (0.33) 90–110 (99.8)
Yalujiang Aug 1992, 1994 146–559 (268) 0.6–18.7 (2.38) 0.3–1.2 (0.37) 0.1–1.0 (0.30) 98–187 (127) Liu and Zhang (2004) Yalujiang May 1996 70–89 (76.3) 0.2–6.3 (5.78) 0.1–0.3 (0.17) 0.06–0.11 (0.09) 65–163 (146)
Daguhe Mar 2002, 2004 34–251 (142.8) 7.8–25.4 (16.6) 0.6–0.7 (0.65) <0.1 <20 Liu et al. (2005, 2007b) Daguhe Aug 2002, 2004 1.4–312 (156.5) 12–20 (15.7) <1.2 0.5–0.7 (0.58) 46–156 (101.1)
Han June 1992 (57.1) (75.8) (2.0) (3.5) (36.9) Hong (unpublished)
Han June 2000 (97.6) (217.5) (12.7) Kim et al. (2004a)
Keum 1997–1998 (160) (26.5) (1.5) (1.4) (85) Yang et al. (1999a)
Yeongsan 1998–2000 (37.1) (3.9) (72.2) Cha and Cho (2002)
Changjiang Jan 1997–2001 13–130 (62.7) 4.8–30 (16.0) <1.8 <0.77 22–166 (112.0) Unpublished data Changjiang Jul 1997–2001 21–188 (70.2) 1.0–13.6 (4.64) <0.3 <0.89 27–200 (100.2)
Qiantangjiang Aug 2004 (101) (0.70) (1.54) (1.00) (128) Unpublished data Yongjiang May 2002 (119) (11.1) (3.2) (183) Unpublished data Jiaojiang Oct 1994 (123) (0.59) (2.21) (162) Zhang (2002) Oujiang Aug 2004 (72.3) (3.21) 0.44 (0.30) (150) Unpublished data Minjiang Oct 1986 (65) (4.13) (1.65) (1.45) (208) Hu et al. (1996) Minjiang Jun 1986 (45) (3.61) (0.84) (0.50) (156)
Jiulongjiangb Summer 23.5–47.0 (36.2) (10.7) (0.61) 252–270 (261) Chen et al.(1985, 1997);
Wang et al. (2006) Jiulongjiangb Winter 24.5–49.3 (36.2) (19.6) (0.91) 189–377 (279.4)
Zhujiang Aug 1999 50–94 (78.6) 0.9–3.4 (2.15) 0.05–7.7 (1.71) 0.3–1.5 (0.85) 102–134 (116.3) Unpublished data Zhujiang Jan 2000 44–63 (58.1) 10–30 (22.0) 1.4–2.5 (2.06) 0.2–0.8 (0.66) 100–108 (106.2)
aFor the Huanghe, monthly cruises between March 2001 and February 2002.
bFor the Jiulongjiang, NO−
3, Si(OH)4: monthly cruises during November 1982–December 1983; NH+4: July 2003 and January 2003; PO 3−
4 : monthly cruises during March 1995 to February 1996.
2004), Fulongshan in Qingdao during 2004–2005, Qianliyan Island in the northwest of the Yellow Sea during 2000–2005, and Shengsi Archipelago in the East China Sea during 2000– 2004 (Bi, 2006; Zhang et al., 2007a). The wet depositional fluxes of nutrients were determined from volume-weighted average concentration and rainfall rate. Dry depositional fluxes of nutrients were estimated from nutrient concentra-tion in the aerosol and the estimated dry deposiconcentra-tion velocity (Zhang et al., 2007a).
Water samples were taken with Niskin water samplers in estuaries and adjacent seas and 2 l acid-cleaned polyethylene bottles attached to the end of a fiber-glass reinforced plas-tic pole in the rivers. Water samples were filtered immedi-ately through acid-cleaned 0.45µm pore size acetate cellu-lose filters in a clean plastic tent, and the filtrates were poi-soned with saturated HgCl2 solution. All nutrient
concen-trations were measured using spectrophotometric methods. NO−2 was measured using diazo-azo method. NO−3 was mea-sured using the zinc-cadmium reduction method before 1993 and using the cadmium-copper reduction method thereafter. These two NO−3 reduction methods were comparable (Chen et al., 1998a; Yu et al., 1998). NH+4 was measured using the sodium hypobromite oxidation method. PO34−was
mea-sured using phosphomolybdenum blue method and Si(OH)4
with the silicomolybdic complex method (Liu et al., 2003a; Zhang et al., 2007b; State Oceanic Administration (SOA), 1998). The analytical precision of NO−2, NO−3, NH+4, PO34−, and Si(OH)4 were 0.006µM, 0.06µM, 0.09µM, 0.03µM,
and 0.15µM, respectively. Salinity was measured using in-duction salinometer in the upper reaches of the rivers and Sea-Bird CTD in the estuaries and adjacent seas with accu-racy of 0.01.
4 Estuarine nutrient budgets-LOICZ approach
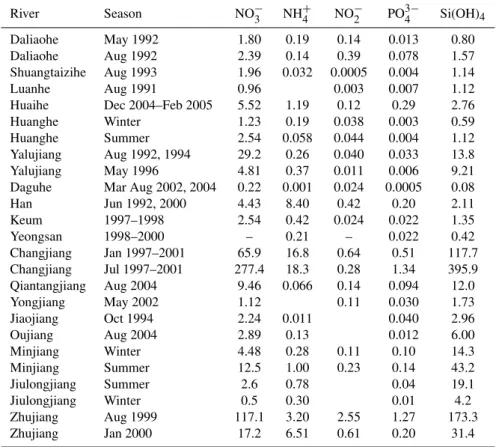
Table 3.Nutrient fluxes (×106mol/day) from rivers to the Chinese Seas.
River Season NO−3 NH+4 NO−2 PO34− Si(OH)4
Daliaohe May 1992 1.80 0.19 0.14 0.013 0.80 Daliaohe Aug 1992 2.39 0.14 0.39 0.078 1.57 Shuangtaizihe Aug 1993 1.96 0.032 0.0005 0.004 1.14
Luanhe Aug 1991 0.96 0.003 0.007 1.12
Huaihe Dec 2004–Feb 2005 5.52 1.19 0.12 0.29 2.76 Huanghe Winter 1.23 0.19 0.038 0.003 0.59 Huanghe Summer 2.54 0.058 0.044 0.004 1.12 Yalujiang Aug 1992, 1994 29.2 0.26 0.040 0.033 13.8 Yalujiang May 1996 4.81 0.37 0.011 0.006 9.21 Daguhe Mar Aug 2002, 2004 0.22 0.001 0.024 0.0005 0.08 Han Jun 1992, 2000 4.43 8.40 0.42 0.20 2.11 Keum 1997–1998 2.54 0.42 0.024 0.022 1.35 Yeongsan 1998–2000 – 0.21 – 0.022 0.42 Changjiang Jan 1997–2001 65.9 16.8 0.64 0.51 117.7 Changjiang Jul 1997–2001 277.4 18.3 0.28 1.34 395.9 Qiantangjiang Aug 2004 9.46 0.066 0.14 0.094 12.0 Yongjiang May 2002 1.12 0.11 0.030 1.73 Jiaojiang Oct 1994 2.24 0.011 0.040 2.96
Oujiang Aug 2004 2.89 0.13 0.012 6.00
Minjiang Winter 4.48 0.28 0.11 0.10 14.3 Minjiang Summer 12.5 1.00 0.23 0.14 43.2 Jiulongjiang Summer 2.6 0.78 0.04 19.1
Jiulongjiang Winter 0.5 0.30 0.01 4.2
Zhujiang Aug 1999 117.1 3.20 2.55 1.27 173.3 Zhujiang Jan 2000 17.2 6.51 0.61 0.20 31.4
which is well-mixed both vertically and horizontally and as-sumed to be at a steady-state.
Nutrient budgets are constructed based on the water and salt budgets. Briefly, the water mass balance was estimated using:
VR=Vin−Vout=dVS/dt−VQ−VP −VG−VW+VE
=dVS/dt−VQ∗ (1)
WhereVR is denoted as the residual flow, which is equal to
the net input of freshwater;VS is the volume of the system;
VQ,VP,VE,VG,VW,Vin,Voutare the mean flow rate of river
water, precipitation, evaporation, groundwater, waste water, advective inflow and outflow of water from the system of in-terest, respectively. All freshwater inputs minus evaporation are combined into a single term (VQ∗). And the system water volume remains to be constant. Thus the derivative (dVS/dt)
becomes zero.VGin Chinese rivers and coastal areas is
rel-atively small and negligible in this calculation. For exam-ple, the contributions of DIN, PO34−and Si(OH)4fluxes from
groundwater were 2.5×10⁻⁴%–2.0×10⁻³% of the riverine nutrient fluxes in the Huanghe delta (Tan, 2002), and sub-marine groundwater nutrient discharge to the Jiaozhou Bay accounts for only 0.06% for PO34−, 5% for NO−3 and 2.6% for Si(OH)4 of the riverine nutrient fluxes due to the
con-struction of a low permeability subsurface dam and excessive groundwater withdrawal (Liu et al., 2007a, b). The volume of wastewater (VW)directly discharged into the estuaries in
China is not considered, as no data are available. However, potential consequences of water and nutrient budgets with waste load are considered (see discussion below). Taking salinity as 0 for fresh water (VQ,VP andVE), the salt
bal-ance in the system of interest, therefore, can be derived: VX(Ssyst−Socn)=SRVR+VSdSsyst/dt (2)
WhereSR=(Ssyst+Socn)/2 andSsystandSocn are mean
salin-ity in the system of interest and adjacent system; VXis the
water exchange flow or mixing flow between the system of interest and adjacent system. The total water exchange time (τ) of the system of interest can be estimated from the ra-tioVS/(VR+VX). The time-dependent term,VSdSsyst/dt, is
zero under the steady state assumption. However, it may be ignored, if the following condition holds:
VS|dSsyst/dt| ≪ |SRVR| (3)
If Eq. (3) does not hold, then, it may be assessed through the following approximation:
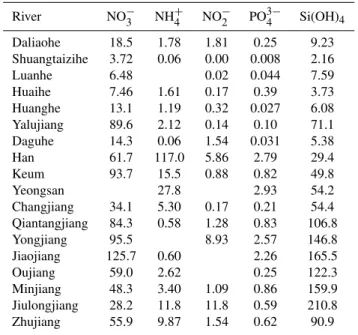
Table 4.The areal yields of nutrients (×103mol km−2yr−1)in the major Chinese and Korean rivers.
River NO−3 NH+4 NO−2 PO34− Si(OH)4
Daliaohe 18.5 1.78 1.81 0.25 9.23 Shuangtaizihe 3.72 0.06 0.00 0.008 2.16 Luanhe 6.48 0.02 0.044 7.59 Huaihe 7.46 1.61 0.17 0.39 3.73 Huanghe 13.1 1.19 0.32 0.027 6.08 Yalujiang 89.6 2.12 0.14 0.10 71.1 Daguhe 14.3 0.06 1.54 0.031 5.38 Han 61.7 117.0 5.86 2.79 29.4 Keum 93.7 15.5 0.88 0.82 49.8
Yeongsan 27.8 2.93 54.2
Changjiang 34.1 5.30 0.17 0.21 54.4 Qiantangjiang 84.3 0.58 1.28 0.83 106.8 Yongjiang 95.5 8.93 2.57 146.8 Jiaojiang 125.7 0.60 2.26 165.5 Oujiang 59.0 2.62 0.25 122.3 Minjiang 48.3 3.40 1.09 0.86 159.9 Jiulongjiang 28.2 11.8 11.8 0.59 210.8 Zhujiang 55.9 9.87 1.54 0.62 90.9
where (t2–t1)represents the time span of the period
exam-ined by the model. In this study, the winter and summer con-ditions are examined. Therefore the time span is 6 months. Thus Eq. (3) can be expressed as the following:
VS(|Ssyst(t2)−Ssyst(t1)|)/(t2−t1)/|SRVR| ≪1 (5)
This condition was examined with the data presented in Table 5. The index expressed as the left hand side of Eq. (5) (VS(|Ssyst(t2)–Ssyst(t1)|)/ (t2–t1)/|SRVR|)ranges
be-tween 0.00002 to 0.08 for estuaries. If 0.1 is taken as the cut-off point, all cases for the estuary in Table 5 qualify for steady state assumption.
Non-conservative fluxes of nutrient elements (1Y) can be derived based on water budgets and nutrient concentrations: 1Y =6outflux −6influx
=VRCR+VXCX−VQCQ−VPCP (6)
whereCQ, Csyst, Cocn, CP, CR and CX denote mean
el-ement concentration in the river runoff, system of interest, adjacent ocean system, precipitation, residual-flow boundary (CR=(Csyst+Cocn)/2) and mixing flow (CX=Csyst–Cocn). A
negative and positive sign of1Y indicates that the system of interest is a sink and a source, respectively.
5 Results
5.1 Nutrients in the rivers
Nutrient levels in the Chinese rivers are shown in Table 2. NH+4, NO−3, PO34−, and Si(OH)4 concentrations vary 30–
60, 8, 30–60, and 8 times, respectively. In the Korean rivers, the concentrations of NH+4 and PO34−are higher than those in the Chinese rivers, while NO−3 and Si(OH)4
con-centrations in rivers of the two countries are comparable (Ta-ble 2). All considered riverine nutrient fluxes to the Chinese Seas are 125×109mol yr−1for NO−3, 2.08×10⁹mol yr−1for NO−2, 20.7×10⁹mol yr−1 for NH+
4, 1.11×10⁹mol yr−1 for
PO34− and 186×109mol yr−1 for Si(OH)4 (Table 2). The
Changjiang and Zhujiang represent more than 80% of total riverine nutrient fluxes to the Chinese Seas except for PO34− in the winter and NO−2 in both winter and summer. Nutri-ent fluxes in the summer were higher than those in the winter (Table 3) related to seasonal changes in the magnitude of wa-ter discharges. There are remarkable correlations among the nutrient loads (R for log DIN versus log PO34− is approxi-mately 0.86; R for log Si(OH)4versus log PO34−is
approxi-mately 0.87; and R for log Si(OH)4versus log DIN is
approx-imately 0.93), and these correlations are very similar to the relationship between DIN and PO34− loads observed on the global scale (Smith et al., 2003). Even though DIN, PO34− and Si(OH)4 follow substantially different biogeochemical
cycles, their loading is tightly coupled. The flux ratio of DIN to PO34−is approximately 160:1 and the Si(OH)4:DIN
load-ing ratio is 1.3:1. The DIN: PO34−loading ratio derived by us (160:1) is 8∼9 times higher than global DIN: PO34−loading ratio (18:1) (Meybeck, 1982; Smith et al., 2003). This indi-cates that the nutrient loading is affected by decomposition of organic matter, different chemical reaction pathways, and human production (such as sewage, waste, and fertilizer).
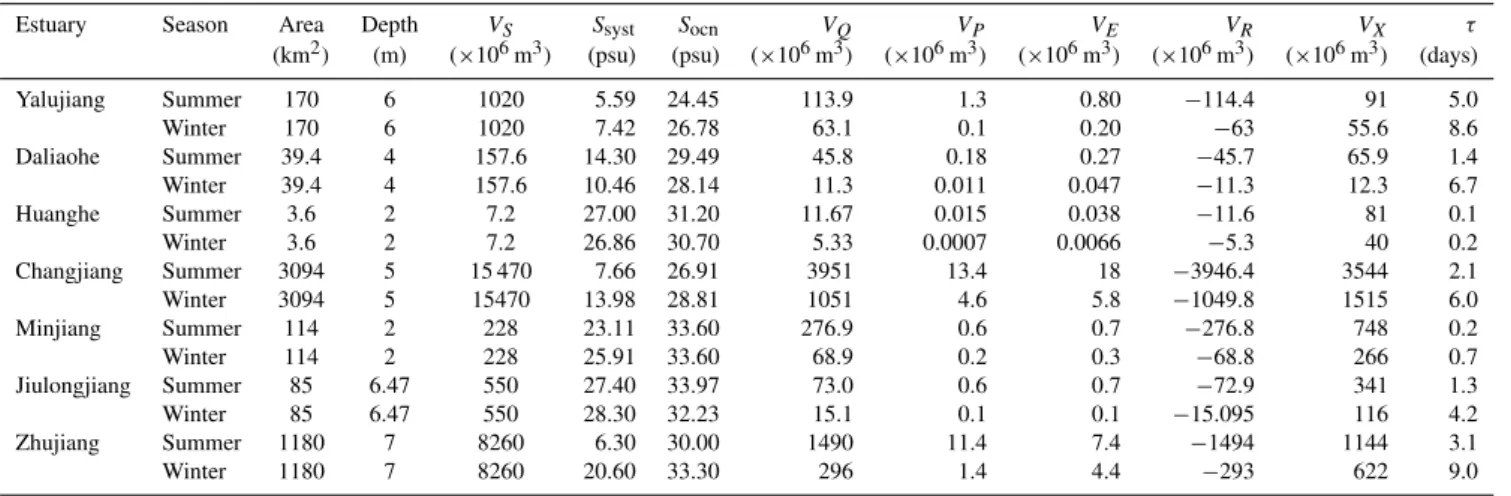
Table 5.Water and salt budgets for the Chinese estuaries.
Estuary Season Area Depth VS Ssyst Socn VQ VP VE VR VX τ
(km2) (m) (×106m3) (psu) (psu) (×106m3) (×106m3) (×106m3) (×106m3) (×106m3) (days)
Yalujiang Summer 170 6 1020 5.59 24.45 113.9 1.3 0.80 −114.4 91 5.0
Winter 170 6 1020 7.42 26.78 63.1 0.1 0.20 −63 55.6 8.6
Daliaohe Summer 39.4 4 157.6 14.30 29.49 45.8 0.18 0.27 −45.7 65.9 1.4
Winter 39.4 4 157.6 10.46 28.14 11.3 0.011 0.047 −11.3 12.3 6.7
Huanghe Summer 3.6 2 7.2 27.00 31.20 11.67 0.015 0.038 −11.6 81 0.1
Winter 3.6 2 7.2 26.86 30.70 5.33 0.0007 0.0066 −5.3 40 0.2
Changjiang Summer 3094 5 15 470 7.66 26.91 3951 13.4 18 −3946.4 3544 2.1
Winter 3094 5 15470 13.98 28.81 1051 4.6 5.8 −1049.8 1515 6.0
Minjiang Summer 114 2 228 23.11 33.60 276.9 0.6 0.7 −276.8 748 0.2
Winter 114 2 228 25.91 33.60 68.9 0.2 0.3 −68.8 266 0.7
Jiulongjiang Summer 85 6.47 550 27.40 33.97 73.0 0.6 0.7 −72.9 341 1.3
Winter 85 6.47 550 28.30 32.23 15.1 0.1 0.1 −15.095 116 4.2
Zhujiang Summer 1180 7 8260 6.30 30.00 1490 11.4 7.4 −1494 1144 3.1
Winter 1180 7 8260 20.60 33.30 296 1.4 4.4 −293 622 9.0
to that in the Zhujiang affected by bedrock and weathering rate (see discussion below).
5.2 Nutrients in the Chinese estuaries
Nutrients in the Chinese estuaries behave either conserva-tively or non-conservaconserva-tively depending on the chemistry of nutrient elements, estuarine circulation system, and season. It appears that river water stages related to dry and flood seasons and in situ biological uptake and regeneration are important factors affecting nutrients distribution in the estu-ary (Zhang, 1996). The concentrations of nutrients in Chi-nese estuaries and their adjacent seas are provided in Table 6 to construct nutrient budgets (see discussion below). While Si(OH)4and NO−3 appear to be largely subjected to a simple
estuarine dilution (Jiang et al., 1995; Zhang, 1996), NH+4 and PO34−undergo desorption/adsorption from suspended parti-cles along the salinity gradient and/or degradation of organic matter in the estuary (Chen et al., 1985; Zhang et al., 1997, 2007b). For example, in the Yalujiang Estuary, the regen-erated nutrient contributed 70–80% for PO34− and 75–85% for NH+4 fluxes to the sea (Liu and Zhang, 2004). Non-conservative distributions were observed in the upper estu-ary, where remobilization of nutrients may take place due to the desorption/release of nutrients from solid phases with increase of ionic strength. Although there are very few bio-logical studies conducted in the upper section of the estuary in either the dry or wet seasons, and hence there is a need for further research in this region of the river, high turbidity inhibits biological production and uptake of nutrients. For example, in July 1999, the phytoplankton productivity in the freshwater-dominated estuary was only<2% of that at the edge of the estuarine coastal plume south of Hong Kong pos-sibly due to light limitation as a result of dilution/mixing and turbidity (Harrison et al., 2008; Yin et al., 2004). In high salinity regions, nutrients may become depleted in the
sur-face waters due to consumption by biological uptake and en-richment by decomposition of organic material in deep wa-ters (Zhang, 1996). Direct discharge of municipal wastewa-ter was noted in some estuaries; for example, in the Yalujiang estuary, NO−3 supply from waste discharge accounted for 30% in the flood and 5% in the dry season (Liu and Zhang, 2004).
6 Discussion
6.1 Biogeochemistry of nutrients in the river/estuarine systems
6.1.1 River eutrophication
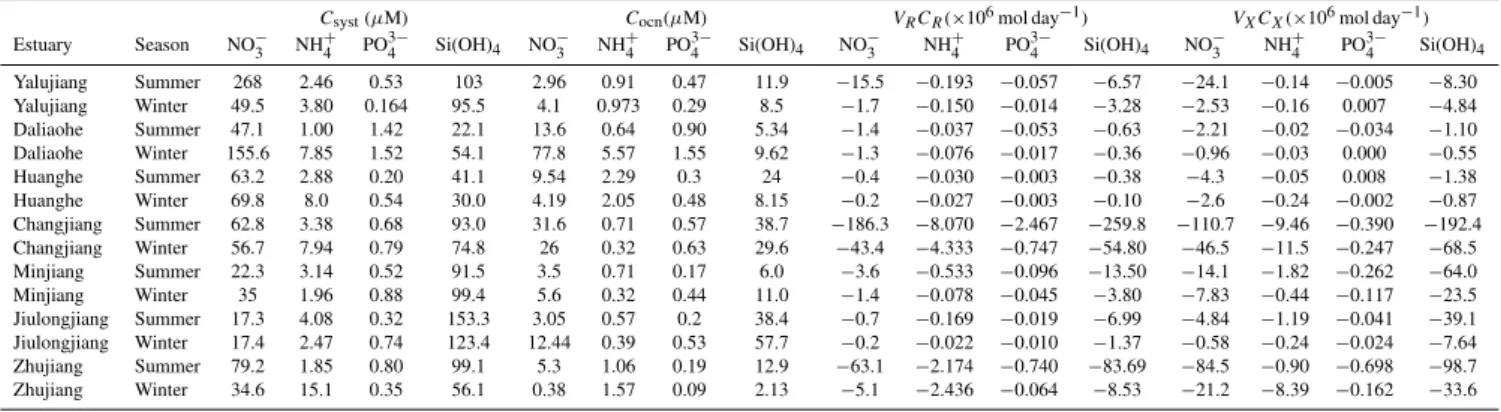
Table 6. Box model outputs of nutrient budgets in the Chinese estuaries. CsysandCocn are nutrient concentrations in the systems and offshore ocean, respectively. VPCP, VQCQ, VRCR, VXCXare atmospheric nutrients deposition, riverine input, the residual nutrients transport out of the system, and mixing exchange fluxes of nutrients, respectively.1is nutrients sink and/or source within the system.
Csyst(µM) Cocn(µM) VRCR(×106mol day−1) VXCX(×106mol day−1)
Estuary Season NO−3 NH
+
4 PO 3−
4 Si(OH)4 NO−3 NH
+
4 PO 3−
4 Si(OH)4 NO−3 NH
+
4 PO 3−
4 Si(OH)4 NO−3 NH
+
4 PO 3−
4 Si(OH)4
Yalujiang Summer 268 2.46 0.53 103 2.96 0.91 0.47 11.9 −15.5 −0.193 −0.057 −6.57 −24.1 −0.14 −0.005 −8.30 Yalujiang Winter 49.5 3.80 0.164 95.5 4.1 0.973 0.29 8.5 −1.7 −0.150 −0.014 −3.28 −2.53 −0.16 0.007 −4.84 Daliaohe Summer 47.1 1.00 1.42 22.1 13.6 0.64 0.90 5.34 −1.4 −0.037 −0.053 −0.63 −2.21 −0.02 −0.034 −1.10 Daliaohe Winter 155.6 7.85 1.52 54.1 77.8 5.57 1.55 9.62 −1.3 −0.076 −0.017 −0.36 −0.96 −0.03 0.000 −0.55 Huanghe Summer 63.2 2.88 0.20 41.1 9.54 2.29 0.3 24 −0.4 −0.030 −0.003 −0.38 −4.3 −0.05 0.008 −1.38 Huanghe Winter 69.8 8.0 0.54 30.0 4.19 2.05 0.48 8.15 −0.2 −0.027 −0.003 −0.10 −2.6 −0.24 −0.002 −0.87 Changjiang Summer 62.8 3.38 0.68 93.0 31.6 0.71 0.57 38.7 −186.3 −8.070 −2.467 −259.8 −110.7 −9.46 −0.390 −192.4 Changjiang Winter 56.7 7.94 0.79 74.8 26 0.32 0.63 29.6 −43.4 −4.333 −0.747 −54.80 −46.5 −11.5 −0.247 −68.5 Minjiang Summer 22.3 3.14 0.52 91.5 3.5 0.71 0.17 6.0 −3.6 −0.533 −0.096 −13.50 −14.1 −1.82 −0.262 −64.0 Minjiang Winter 35 1.96 0.88 99.4 5.6 0.32 0.44 11.0 −1.4 −0.078 −0.045 −3.80 −7.83 −0.44 −0.117 −23.5 Jiulongjiang Summer 17.3 4.08 0.32 153.3 3.05 0.57 0.2 38.4 −0.7 −0.169 −0.019 −6.99 −4.84 −1.19 −0.041 −39.1 Jiulongjiang Winter 17.4 2.47 0.74 123.4 12.44 0.39 0.53 57.7 −0.2 −0.022 −0.010 −1.37 −0.58 −0.24 −0.024 −7.64 Zhujiang Summer 79.2 1.85 0.80 99.1 5.3 1.06 0.19 12.9 −63.1 −2.174 −0.740 −83.69 −84.5 −0.90 −0.698 −98.7 Zhujiang Winter 34.6 15.1 0.35 56.1 0.38 1.57 0.09 2.13 −5.1 −2.436 −0.064 −8.53 −21.2 −8.39 −0.162 −33.6
Table 6.Continued.
VQCQ(×106mol day−1) VPCP(×106mol day−1) 1(×106mol day−1) Estuary Season NO−3 NH+4 PO43− Si(OH)4 NO−3 NH4+ PO34− Si(OH)4 NO3− NH+4 PO34− Si(OH)4
Yalujiang Summer 29.2 0.26 0.033 13.8 0.024 0.048 0.000 0.001 10.4 0.03 0.03 1.0 Yalujiang Winter 3.88 0.083 0.0059 7.42 0.014 0.018 0.000 0.000 0.33 0.21 0.00 0.7 Daliaohe Summer 2.39 0.14 0.078 1.57 0.009 0.020 0.001 0.001 1.20 −0.099 0.009 0.16 Daliaohe Winter 1.80 0.19 0.013 0.80 0.002 0.005 0.001 0.001 0.47 −0.091 0.003 0.11 Huanghe Summer 2.54 0.06 0.004 1.12 0.001 0.001 0.000 0.000 2.2 0.02 −0.01 0.6 Huanghe Winter 1.23 0.36 0.003 0.59 0.000 0.000 0.000 0.000 1.59 −0.10 0.00 0.4 Changjiang Summer 277.4 18.3 1.34 395.9 0.188 0.402 0.001 0.024 19.5 −1.20 1.51 56.3 Changjiang Winter 65.9 16.8 0.51 117.7 0.357 0.641 0.001 0.009 23.6 −1.59 0.48 5.6 Minjiang Summer 12.5 1.00 0.14 43.2 0.007 0.015 0.000 0.001 5.2 1.34 0.22 34.3 Minjiang Winter 4.48 0.28 0.10 14.3 0.013 0.024 0.000 0.000 4.7 0.21 0.06 13.0 Jiulongjiang Summer 2.64 0.78 0.04 19.1 0.005 0.011 0.000 0.001 2.9 0.57 0.02 27.1 Jiulongjiang Winter 0.55 0.30 0.014 4.22 0.010 0.018 0.000 0.000 0.25 −0.05 0.02 4.8 Zhujiang Summer 117.1 3.20 1.27 173.3 0.072 0.153 0.000 0.009 30.5 −0.28 0.17 9.1 Zhujiang Winter 17.2 6.51 0.20 31.4 0.136 0.245 0.000 0.003 9.0 4.07 0.03 10.7
This is due to the application of inorganic N fertilizer (am-monium bicarbonate) in the drainage basins and wastewater discharge (Cao et al., 2005; Sheldrick et al., 2003; Yan et al., 1999; Millennium Ecosystem Assessment, 2005). Phosphate concentrations in 13 rivers are at the pristine level (0.5µM) and in 5 rivers are at average level (3µM) compared to the global river data (Smith et al., 2003). The lower concentra-tions of phosphate in the Chinese rivers are related to adsorp-tion onto particulates (Zhang, 2007, unpublished data), as suspended particulate matters are abundant in the river water. Therefore, N: P ratios varied greatly from 24 to 2000 among Chinese rivers and they also varied seasonally. Very high ra-tios of N/P might result from very low phosphate values. N/P ratios in Chinese rivers are higher than the other rivers in the world; for example N: P ratio is 24 in Amazon River, 13–38 in Po River, Rhine River and Seine River (Billen and Garnier, 2007).
from human settlements. Recently Millennium Ecosystem Assessment argued that nitrogen fluxes in the rivers to the sea over the past four decades have increased 17 times in South Korea, mostly due to the application of fertilizers, which is the largest change in the world (Millennium Ecosystem As-sessment, 2005, Table 4-1). Baskin et al. (2002) had also asserted that a doubling of N content in the Yellow Sea oc-curred every 3 years during 1994–1997 due to the human de-rived N inputs. These two assessments need to be appraised independently for clear understanding of nutrient dynamics in the Yellow Sea in future.
6.1.2 Dissolved silicate
Dissolved silicate is mainly delivered via weathering, which is constrained by the interaction of tectonic activities, rock type and climate. Dissolved silicate levels in the rivers and areal yields in their watersheds in general are higher in the warm and wet south than in the cold and dry north of the Changjiang. The solute discharge flux is widely used in the literature as an indicator of chemical weathering rate (White and Blum, 1995; Gaillardet et al., 1999). For the studied river systems, the dissolved loads of rivers indicated a car-bonate weathering origin except in the Yalujiang, Yongjiang, Oujiang, Minjiang, Jiulongjiang, Dongjiang (a tributary of the Zhujiang), and Ganjiang (a tributary of the Changjiang) where the dissolved loads indicated a silicate weathering ori-gin (Li, 2003) with high concentrations of dissolved silicate. The total weathering rate is obviously higher than that of ma-jor world watersheds and in general with higher erosion rates in the southern China than in the northern China. The chem-ical weathering rate is always far less than the mechanchem-ical denudation rate in the same watershed. The highest physical denudation rate is observed in the Huanghe (Li and Zhang, 2003). Although chemical weathering rates were mainly determined by the rock type and regional climate, the to-pography (relative elevation) driven mechanical denudation has been greatly accelerated by human activities, e.g., road construction (Li, 2003). For example, Si(OH)4in the
Yalu-jiang largely originated from Si-bearing granite basin (Li and Zhang, 2003), and Si(OH)4in the Huanghe largely originated
from mechanical denudation and a much higher evaporation over precipitation rate in a large part of its river basin (Cai et al., 2008; Li and Zhang, 2003) which enhances Si(OH)4
con-centrations. As a result, the concentrations and areal yield of Si(OH)4 in the Yalujiang are comparable to those in the
Changjiang and Zhujiang. The Si(OH)4level in the Huanghe
is similar to those in the Changjiang and Zhujiang.
6.1.3 Natural nutrient load estimation in the Chinese rivers
Information on nutrient composition and concentrations in pristine state rivers are needed to evaluate quantitatively the anthropogenic influence on them with time. We estimated
naturally generated nutrient concentration in each river as-suming that biological N2 fixation for DIN and chemical
weathering for PO34− and silicate are the dominant mecha-nisms. Additionally we assumed that the nutrient levels ob-served in the upper reaches of the rivers are reflecting the nat-ural (pristine) background levels for their respective rivers. The nutrient concentrations (3.59µM for DIN, 0.16µM for PO34−, 116.5µM for Si(OH)4)3300–3600 km upstream from
the Changjiang river mouth were regarded here as the natural levels, which are 4.6% for DIN, 21.9% for PO34−, and 112% for Si(OH)4of those within 500 km of the river mouth (Liu
et al., 2003a). Historical data in the Changjiang river mouth were estimated to be 10–20µM for DIN and∼120µM for Si(OH)4)in the early of 1960s, and 0.1–0.2µM for PO34−
before 1980s (Li et al., 2007). These values are similar to PO34− and Si(OH)4 levels but higher for DIN levels than
in the upper reaches of the Changjiang indicating that our assumption of pristine data are acceptable. In the upper reaches of the Yalujiang, 32.7µM for DIN, 0.13µM for PO34−, and 102.2µM for Si(OH)4 were observed (Liu and
Zhang, 2004). The averages of these two rivers are 18.1µM for DIN, 0.15µM for PO34−, and 109.4µM for Si(OH)4).
The natural loads estimated from the natural nutrient concen-trations and the total annual water discharge for all consid-ered rivers (1650.2×109m3yr−1)are 29.9×10⁹mol yr−1for DIN, 0.25×10⁹mol yr−1for PO34−, and 180.5×10⁹mol yr−1 for Si(OH)4. While these extrapolations are inevitably rough,
they give some indication that anthropogenic activities have increased DIN and PO34− loading above natural fluxes by more than a factor of 3–4. Si(OH)4 loads originated from
rock weathering, however, are similar to present average val-ues with little additional Si(OH)4entering downstream, and
Si(OH)4losses from large dam construction are not obvious
on national scale. For individual rivers, Si(OH)4losses from
large dam construction can not be compensated for as river water flows to the sea (such as the Changjiang) (Li et al., 2007).
6.1.4 Changing nutrient composition and fluxes in the Chinese rivers for recent decades
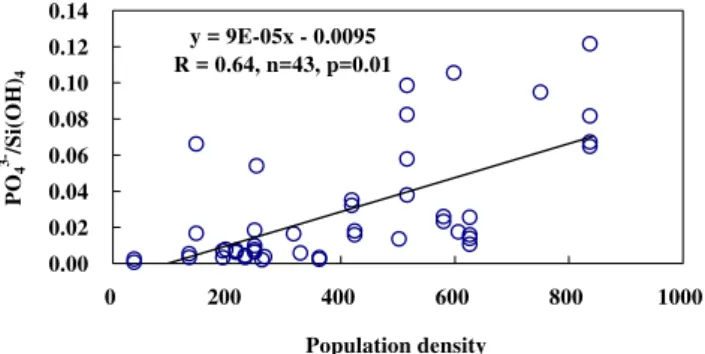
y = 9E-05x - 0.0095 R = 0.64, n=43, p=0.01
0.00 0.02 0.04 0.06 0.08 0.10 0.12 0.14
0 200 400 600 800 1000
Population density
PO
4
3-/Si(OH)
4
Fig. 3. Molar ratios of PO34−to Si(OH)4versus population den-sity (people/km2)in the large Chinese and Korean rivers and em-bayments. Data sources for the rivers are shown in Table 2. Data sources for embayments are from investigations in 2006–2007 for Sanggou Bay (Unpublished data), 1997–1998 and 2001–2003 for Jiaozhou Bay (Liu et al., 2005a, 2007b), 1981–1982 and 1989– 1990 for Hangzhou Bay (Gao et al., 1993), 2000 and 2002–2005 for Xiangshan Bay (Zhang et al., 2006; Zhang et al., 2003), 2005 for Sanmen Bay (Wang et al., 2007b), 1981–1982 and 1990 for Taizhou Bay (Chinese Compilation Committee of Embayments, 1993), 1997–2002 for Daya Bay (Qiu et al., 2005), and 1993– 2003 for the summer and 1991–1992 for the winter for Dapeng Bay (Li et al., 2004; Chinese Compilation Committee of Embayments, 1998a).
The most frequently sampled Changjiang is given as an ex-ample. The DIN concentrations and load in the Changjiang increased about 6–10 times in the last thirty years. The increase was attributed to the intensification of agriculture and the use of mineral fertilizers. The amount of N fertil-izer applied to the Changjiang drainage basin increased 15 times during that period (Li et al., 2007; M¨uller et al., 2008). The PO34− levels showed negligible increases (Duan et al., 2007; Liu et al., 2003a; M¨uller et al., 2008), even though P fertilizer use in the Changjiang drainage basin has also increased substantially (Liu et al., 2003a). This is perhaps because phosphate was more likely to be adsorbed onto par-ticles (Zhang, 2007). Phosphate concentrations are generally higher in the rivers flowing through urban areas due to do-mestic wastewater discharge. For example, the concentra-tions of PO34− in wastewater from sewage treatment plants in Qingdao are more than 80µM (Liu et al., 2005). Molar ratios of PO34−to Si(OH)4 can be used to infer the nutrient
contributions from urban areas relative to rock weathering in the drainage basin. When nutrient data from the major Chinese and Korean rivers and embayments are put together, molar ratios of PO34−to Si(OH)4increase linearly (R=0.64,
n=43) with increase in population density atp=0.01 (Fig. 3). The scatter in Fig. 3 comes from uneven distribution of pop-ulation, very low concentration of phosphate and low ratios of PO34−/Si(OH)4, and the different chemical reaction
path-ways for PO34− and Si(OH)4. DIN concentrations in the
rivers are mainly correlated with fertilizer application (Liu et
al., 2003a; Zhang, 1996). These compositional relationships among nutrient compounds in the river water indicate that ecosystem dynamics including primary production and phy-toplankton species composition in coastal waters also have been altered as coastal zones become urbanized. The lim-iting nutrient may be changed from phosphorus to nitrogen with urbanization and in some areas silicon becomes limit-ing nutrient, such as Jiaozhou Bay (Liu et al., 2008a). More studies are needed to further investigate this phenomenon.
6.2 Water and nutrient budgets in estuaries
6.2.1 Estuarine nutrient budgets
Water and salt budgets for large Chinese estuaries are shown in Table 5. As freshwater discharge surpasses both precipi-tation and evaporation, the residual flow is off the estuaries and is similar to the river water discharge. Both the residual flow and water exchange flow or mixing flow in the sum-mer are higher than those in the winter. The total water ex-change time of the estuaries is less than 10 days, and it is 2–5 times longer in the winter than in the summer. Wastew-ater discharge to the estuaries is not included in the wWastew-ater budgets. The Zhujiang delta region has become one of the most densely populated and economically developed regions in China. The industrial wastewater and domestic sewage discharged from the Zhujiang delta, Hong Kong and Macau to the Zhujiang Estuary amounts to 3.02×10⁶m3day−1and 3.35×10⁶m3day−1, respectively, of which, more than 50% of domestic sewage is not treated and discharged into coastal water directly (Huang et al., 2003). These wastewater dis-charge accounts for less than 0.5% and 2% of the Zhujiang freshwater discharge in summer and winter, respectively. The proportion of wastewater to river freshwater discharge is less than 5% in the Huanghe (Tan, 2002), ∼1% in the Daliaohe and less than 1% in the Yalujiang (Zhang et al., 1997). The uncertainties can be up to 5% as we don not in-clude wastewater in the water budgets.
The nutrient budgets for large Chinese estuaries are pro-vided in Table 6. Atmospheric deposition of nutrients is very limited relative to riverine input owing to limited surface area. Both the residual and mixing flows transport nutrients off the estuaries. Table 6 reveals net source of NO−3, PO34− and Si(OH)4in large Chinese estuaries except for PO34− in
Wastewater discharge was not considered for nutrient bud-gets as no data are available. However, the nutrient con-centration in wastewater can play a considerable role in the nutrient budgets especially when considering estuaries in such a heavily populated area as the Chinese coast ex-cept for dissolved silicate. Potential consequences on nu-trient budgets are estimated in case wastewater data are available. For the Zhujiang estuary, the water quality has been extensively examined, indicating that the estu-ary exhibits some symptoms of eutrophication and low dis-solved oxygen due to anthropogenic activities, such as in-creased agricultural activities and sewage effluents (Dai et al., 2006; Huang et al., 2003; Yin et al., 2004). Model output indicated that in the Zhujiang estuary, the propor-tion of waste load to riverine flux was 0.1% in July 1999 and 1.0% in January 1999 for nitrate plus nitrite, 28.2% in July 1999 and 178% in January 1999 for ammonium, and 9.9% in July 1999 and 63.9% in January 1999 for phos-phate (Hu and Li, 2009). Non-conservative fluxes should be 30.4×10⁶mol day−1in the summer and 8.8×10⁶mol day−1 in the winter for nitrate, −1.18×10⁶mol day−1 in the summer and −7.5×10⁶mol day−1 in the winter for am-monium, and 0.044×10⁶mol day−1 in the summer and −0.098×10⁶mol day−1in the winter for phosphate. This in-dicates that nitrate budget is similar when waste load is con-sidered, while both ammonium and phosphate budgets are affected switching from a source to a sink when waste load is considered.
For the Jiulongjiang estuary, model output indicated that the DIN load from domestic sewage and industrial wastew-ater was less than 1% of riverine input (Cao et al., 2005). Therefore, the budget results may not be affected when wastewater data are considered for the Jiulongjiang estuary. For the Yalujiang estuary, the proportion of waste load from urbanized region to seaward fluxes from the Yalujiang to the Yellow Sea was 32% in the flood season in 1994 and 4% in the dry season in 1996 for nitrate, 25% in the flood sea-son in 1994 and 8% in the dry seasea-son in 1996 for ammo-nium, and 4% in the flood season in 1994 and 2% in the dry season in 1996 for phosphate (Liu and Zhang, 2004). Non-conservative fluxes should be−3.98×10⁶mol day−1in the flood season and 0.17×10⁶mol day−1 in the dry sea-son for nitrate, −0.061×10⁶mol day−1 in the flood sea-son and 0.20×10⁶mol day−1 in the dry season for ammo-nium, and 0.028×10⁶mol day−1 in the flood season and
0.001×10⁶mol day−1in the dry season for phosphate. This
indicates that both nitrate and ammonium budgets in the flood season are affected switching from a source to a sink when waste load is considered, while phosphate budget is not affected when waste load is considered for the Yalujiang estuary. These results are different from those in the Zhu-jiang estuary; that is, both nitrate and ammonium budgets in the flood season in the Yalujiang estuary are affected when waste load is considered rather than in the dry season. In the Yalujiang, it seems that water flow in the dry season is
sup-plied in a certain amount by ground water and tributaries in the upstream forest, which have a rather stable flow rate and chemical compositions. However, heavy rainfalls in the sum-mer season could induce an intensive leaching of cultivated areas, the temporal transport of nutrients in the flood season could be nearly one order of magnitude higher than in the dry season in the Yalujiang (Zhang et al., 1998). For the other estuaries, both nitrogen and phosphorus budgets may be af-fected when waste load is considered to some extent depend-ing on the system, element, and waste load. More studies are needed to investigate this phenomenon in detail.
6.2.2 Nutrient fluxes from estuaries to the Chinese Seas
Eutrophication has been a growing problem in many coastal and estuarine ecosystems around the world (Justi´c et al., 2003; Rabalais et al., 2002). The transformation of nu-trients within estuaries affects the movement of nunu-trients from land to the ocean and eventually the sustainability of nearshore ecosystems (Nixon, 1995). Nutrient fluxes from estuaries to the Chinese Seas are estimated as sum of net residual flux (CRVR) and mixing flux (CXVX):
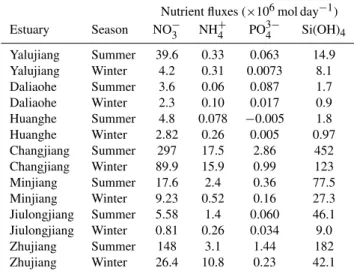
Fmodel=CRVR+CXVX. Nutrient fluxes were higher in the
summer than in the winter except for NH+4 in the Zhujiang (Table 7) due to wastewater discharge (Hu and Li, 2009). Total nutrient fluxes from major Chinese estuaries to the coastal region in the summer are 516×106mol day−1 for NO−3, 24.8×10⁶mol day−1 for NH+4, 4.86×10⁶mol day−1 for PO34− and 777×106mol day−1 for Si(OH)4, which are
3–4 times greater than those in the winter except for NH+4. These fluxes are 1.0–1.7 times of the riverine input (Friver=CVQ), indicating that estuarine processes the most
amplify the riverine flux by a factor of 1.7, and these estu-arine processes may include scavenging, regeneration, and waste discharge. The nutrient load from major Chinese estu-aries to the coastal seas represent 9% for DIN and 1.5% for PO34−of the global load (DIN: 1350×109mol yr−1; PO34−: 74×109mol yr−1)(Smith et al., 2003) with more nitrogen than phosphorus related to adsorption of phosphorus due to high total suspended matter load.
6.3 The effect of increased riverine N and P fluxes on the ecosystems of the Chinese Seas
6.3.1 The contribution of N and P fluxes to the Chinese Seas
Table 7. Total nutrient fluxes (residual flux and mixing exchange flux) derived from steady state 1 box model. Please see the detailed model description in the text. Positive values indicate efflux from the studied system and negative sign indicates influx to the system.
Nutrient fluxes (×106mol day−1) Estuary Season NO−3 NH+4 PO34− Si(OH)4
Yalujiang Summer 39.6 0.33 0.063 14.9 Yalujiang Winter 4.2 0.31 0.0073 8.1 Daliaohe Summer 3.6 0.06 0.087 1.7 Daliaohe Winter 2.3 0.10 0.017 0.9 Huanghe Summer 4.8 0.078 −0.005 1.8 Huanghe Winter 2.82 0.26 0.005 0.97 Changjiang Summer 297 17.5 2.86 452 Changjiang Winter 89.9 15.9 0.99 123 Minjiang Summer 17.6 2.4 0.36 77.5 Minjiang Winter 9.23 0.52 0.16 27.3 Jiulongjiang Summer 5.58 1.4 0.060 46.1 Jiulongjiang Winter 0.81 0.26 0.034 9.0 Zhujiang Summer 148 3.1 1.44 182 Zhujiang Winter 26.4 10.8 0.23 42.1
166.0×10⁴ tonnes C day−1 in the Bohai, Yellow Sea, East
China Sea shelf and South China Sea shelf in the sum-mer, respectively; and 1.2, 2.9, 15.7, 164.0×10⁴ tonnes C day−1 in the Bohai, Yellow Sea, East China Sea shelf and South China Sea shelf in the winter, respectively. Taking into account applying the Redfield stoichiometric ratio for phytoplankton nutrients (C:N:P=106:16:1), primary produc-ers would assimilate 3.77–208.6×10⁸mol day−1of nitrogen, and 0.24–13.0×10⁸mol day−1 of phosphorus in the sum-mer, and 1.51–206.1×10⁸mol day−1of nitrogen, and 0.09– 12.9×10⁸mol day−1of phosphorus in the winter. The estu-arine contribution to the Chinese Seas can account for 4.1– 15.1% of N and 1.6–5.7% of P in the Bohai, 6.7–12.3% of N and 0.6–2.1% of P in the Yellow Sea, 5.1–13.4% of N and 0.6–1.1% of P in the East China Sea shelf, and 0.1–1.0% of N and 0.02–0.17% of P in the South China Sea shelf required for phytoplankton growth. These results suggest that other nutrient sources, such as regenerated nutrients in water col-umn and sediments and open ocean, play an important role for phytoplankton growth. Atmospheric deposition may be another important source of nutrients for the Chinese Seas. For example in the Yellow Sea, surrounded by the continu-ous land mass of China and Korea, atmospheric deposition represents 51% of the nitrogen load (Liu et al., 2003b).
6.3.2 Changing nutrient composition in the Chinese Seas
It is well known that N and P enrichment may lead to defi-ciency of dissolved silicate, hence, limit diatom growth, and result in food web changes in aquatic system (Conley et al., 1993). As discussed above, the riverine nutrient fluxes with more nitrogen than phosphorus may lead to potential
Table 8.Seasonal primary production (mg C m−2day−1)in the Chinese Seas.
Region Spring Summer Fall Winter Reference
Bohai 300±73 390±201 232±72 161±33 Fei et al. (1991); L¨u et al. (1999); Sun et al. (2003) Yellow Sea 2066 (66–5303) 331 (67–1020) 702 (281–1341) 75 (15–221) Yang et al. (1999b) East China Sea 307±156 515±315 371±154 297±121 Gong et al. (2003) Northern South China Sea
Shelf (<200 m) 620±220 830±420 450±240 820±40
Chen and Chen (2006) Basin (>2000 m) 440±300 310±140 320±140 530±190
6.4 Riverine inputs of silicon to the Chinese Seas
For biogenic silica, there are limited data from these estuar-ies. In May 2003, dissolved silicate, biogenic silica (BSi) and lithogenic silica (LSi) were measured in the mainstream and major tributaries of the Changjiang when the river discharge was approaching the annual average. The average concentra-tions were of 88.1±28.4µM of Si(OH)4, 2.0±1.6µM of BSi
and 21.1±12.1µM of LSi (unpublished data). With respect to total silicon, Si(OH)4represented 79%, BSi accounted for
1.8% and LSi was 19%, of which BSi accounted for 2% of BSi plus Si(OH)4. It was also reported that BSi
concentra-tions in the Yongjiang were 1.7±0.36µM, representing∼1% of silicic acid plus BSi (Liu et al., 2005b). While BSi concen-trations in the rivers of the Jiaozhou Bay (such as the Daguhe and Yanghe) accounted for 12% of BSi plus Si(OH)4(Liu et
al., 2008a). BSi percent in the Changjiang and Yongjiang is lower than the global average values (Conley, 1997) due to high sediment load. The BSi percent in the rivers around the Jiaozhou Bay is similar to the value of 16% found for other world rivers (Conley, 1997). As most of the Chinese rivers are characterized by high contents of suspended par-ticulate matter, we suppose that the contribution of BSi in the Changjiang is similar to the other major Chinese large rivers, and BSi fluxes from large Chinese estuaries to the Chinese Seas would be 15.8×10⁶mol day−1. Therefore, the total Si(OH)4and BSi fluxes from large Chinese estuaries would
be 691×106mol day−1. In the Bohai, the proportion of di-atoms in the total phytoplankton population decreased from 98% in 1959–1960 to 90% in 1982–1993 and 87% in 1998– 1999 (Wang and Kang, 1998; Kang, 1991; Sun et al., 2002). In the Yellow Sea, the proportion of diatoms decreased from 89% in the spring 1986 to 70% in the spring 1998 (Wang, 2001), but it was 97–99% in the autumn 2001 and the winter 2002 (Wang, 2003). In the inner shelf of the East China Sea, the proportion of diatoms showed a decreasing trend from about 85% in 1984 to about 60% in 2000 (Zhou et al., 2008). In the Zhujiang Estuary, diatom accounted for 86.8% of all phytoplankton in the wet season and 70% in the dry season (Huang et al., 2004). We assume that diatoms account for ca. 75% of the primary production in coastal areas of the
Chi-nese Seas as the lower limit and taking into account apply-ing the Redfield stoichiometric ratio for phytoplankton nutri-ents (C:N:Si=106:16:16), diatom primary producers would assimilate 185×108mol day−1of silicon. Thus, both
river-ine Si(OH)4and BSi fluxes may contribute 3.7% of silicon
required for diatom growth in the Chinese Seas.
6.5 Particulate and organic P and N fluxes to the Chi-nese Seas
the Changjiang, Jiulongjiang and Daguhe and total water dis-charge (1607.6×109m3yr−1) were 29.4×10⁹mol yr−1 for
DON, 0.88×10⁹mol yr−1 for DOP, 28.0×10⁹mol yr−1 for
PN, and 4.39×10⁹mol yr−1 for PP. Therefore, the total fluxes from the Chinese rivers were 31.1×10⁹mol yr−1 for DON, 0.89×10⁹mol yr−1 for DOP, 29.7×10⁹mol yr−1 for PN, and 5.08×10⁹mol yr−1 for PP. While these extrapola-tions are inevitably rough, they indicate that DON represents 18% of TDN, DOP is 47% of TDP, PN is 15% of total N, and PP accounts for 73% of total P. This indicates that fluxes of both dissolved organic and particulate N and P, especially P, to the Chinese Seas are important and may determine the impact on receiving coastal marine ecosystems. There is growing evidence that phytoplankton can use both phosphate and DOP (Cotner and Wetzel, 1992; Huang et al., 2005) and DON is implicated in the formation of some coastal harmful algal blooms (Berg et al., 1997; Seitzinger et al., 2002).
7 Conclusions
The present work summarizes data from biogeochemical sur-veys of the major Chinese estuaries including the Changjiang and Zhujiang. The longer residence time in the estuaries al-lows greater utilization of nutrients by phytoplankton than in the rivers. The Chinese rivers are characterized by high DIN and low PO34− concentrations. DIN: PO34−ratios var-ied widely and were higher (up to 2000) than other rivers in the world. The dissolved silicate levels and areal yields in general are higher in the warm and wet South China rivers than those in the cold and dry North China rivers, due to differences in climate, rock type and physical and chemical weathering. Silica leaching from drainage areas is greater in subtropical zones relative to temperate zones.
Nutrient levels in the Chinese rivers are higher than those from the large and less-disturbed rivers in the world such as the Amazon and the Zaire, but comparable to the values for the European and North American polluted and eutrophic rivers such as the Loire, Po, Rhine, and Seine. Both nitro-gen and phosphorus originate from agricultural and domes-tic wastes, and nitrogen is preferentially leached from the drainage basin compared to reactive phosphorus. With ur-banization, the change in nutrient composition in the Chinese and Korean rivers may result in a change of limiting nutrient from phosphorus to nitrogen for phytoplankton production, and silicon for diatom productivity, and thereby modifying coastal ocean ecosystem.
For the large Chinese estuaries, atmospheric deposition of nutrients is limited relative to riverine inputs. Both the residual and mixing flow transport nutrients off the estuar-ies. Nutrient fluxes from major Chinese estuaries to coastal areas in the summer are 3–4 times higher than those in the winter except for NH+4. Taking into account considering the Redfield stoichiometric ratio for phytoplankton nutri-ents (C:N:P=106:16:1), the major Chinese estuaries transport
0.1–15.1% of nitrogen, 0.02–5.7% of phosphorus for phyto-plankton production and 3.7% of silicon required for diatom growth in the continental shelf of the Chinese Seas. This demonstrates that other sources, such as regenerated nutri-ents in water column and sedimnutri-ents, exchange between the Chinese Seas and open Pacific Ocean and atmospheric depo-sition, play major role for phytoplankton growth.
Acknowledgements. This study was funded by the Chinese
Natural Sciences Foundation (Nos. 40925017, 40876054 and 40730847), the Ministry of Education (Nos. 108081), the Special Funds from National Key Basic Research Program of P. R. China (Nos. 2006CB400602 and 2007DFB20380), and Korea Ocean Research and Development Institute (GHH, PE98120). The authors would like to thank Hou Jie Wang, Qing Zhen Yao, Hong Tao Chen for providing us with the important data, and Chao LU for providing us with maps of some estuaries. Thanks are also extended to S. W. A. Naqvi and the two anonymous reviewers for their constructive comments on improving the original manuscript.
Edited by: S. W. A. Naqvi
References
Baskin, V. N., Park, S. U., Choi, M. S., and Lee, C. B.: Nitrogen budgets for the Republic of Korea and the Yellow Sea region, Biogeochemistry, 57/58, 387–403, 2002.
Berg, G. M., Glibert, P. M., Lomas, M. W., and Burford, M. A.: Organic nitrogen uptake and growth by the chrysophyte Aureo-coccus anophagefferensduring a brown tide event, Mar. Biol., 129, 377–387, 1997.
Berner, R. A.: Burial of organic carbon and pyrite sulfur in the modern ocean: its geochemical and environmental significance, Am. J. Sci., 282, 451–473, 1982.
Bi, Y. F.: Atmospheric nutrient deposition at the East China coast and its impact on marine primary production, M.S. thesis, Ocean University of China, Qingdao, P. R. China, 87 pp., 2006 (in Chi-nese with English abstract).
Billen, G. and Garnier, J.: River basin nutrient delivery to the coastal sea: Assessing its potential to sustain new production of non-siliceous algae, Mar. Chem., 106, 148–160, 2007.
Cai, W.-J., Guo, X., Chen, C.-T. A., Dai, M., Zhang, L., Zhai, W., Lohrenz, S. E., Yin, K., Harrison, P. J., and Wang, Y.: A com-parative overview of weathering intensity and HCO−3 flux in the world’s major rivers with emphasis on the Changjiang, Huanghe, Zhujiang (Pearl) and Mississippi Rivers, Cont. Shelf Res., 28, 1538–1549, 2008.
Cao, W., Hong, H., and Yue, S.: Modelling agricultural nitro-gen contributions to the Jiulong River estuary and coastal water, Global Planet. Change, 47, 111–121, 2005.
Cha, H. J. and Cho, Y. G.: Transport and loading of nutrients and dissolved major and trace elements in the Yeongsan River, Korea, J. Korean Soc. Oceanogr., 37, 66–75, 2002 (in Korean). Chen, C.-C., Gong, G.-C., and Shiah, F.-K.: Hypoxia in the East
China Sea: One of the largest coastal low-oxygen areas in the world, Mar. Environ. Res. 64, 399–408, 2007.
Chen, C.-T. A., Wang, S.-L., Wang, B.-J., and Pai, S.-C.: Nutrient budgets for the South China Sea basin, Mar. Chem., 75, 281–300, 2001.
Chen, H., Yu, Z., Zhang, J., and Chen, S. Z.: Spectrophotomet-ric determination of nitrate in natural waters by a new Zn-Cd reduction method, Analytical Laboratory, 17, 28–30, 1998a (in Chinese).
Chen, S., Liao, W., and Xu, A.: Transfer of phosphorus in Jiu-longjiang Estuarine water, J. Oceaography in Taiwan Strait, 17, 71–74, 1998b (in Chinese with English Abstract).
Chen, S., Lu, M., and Fu, T.: Behaviors of various phosphorus forms in Jiulongjiang estuarine water, J. Oceanogr. Taiwan Strait, 16, 299–305, 1997 (in Chinese with English abstract).
Chen, S., Ruan, W., and Zhang, L.: Chemical characteristics of nutrient elements in the Jiulong Estuary and the calculation of its flux, Trop. Oceanol., 4, 16–24, 1985 (in Chinese with English abstract).
Chen, Y. L. L. and Chen, H. Y.: Seasonal dynamics of primary and new production in the northern South China Sea: The signifi-cance of river discharge and nutrient advection, Deep-Sea Res. Pt.I, 53, 971–986, 2006.
Chinese Compilation Committee of Embayment (Eds.): Chapter 6 (bays in the southern part of Zhejiang Province), China Ocean Press, Beijing, 1993 (in Chinese).
Chinese Compilation Committee of Embayment (Eds.): Chapter 9 (bays in the eastern part of Guangdong Province), China Ocean Press, Beijing, 1998a (in Chinese).
Chinese Compilation Committee of Embayment (Eds.): Chapter 14 (major estuaries), China Ocean Press, Beijing, 1998b (in Chi-nese).
Conley, D. J.: Riverine contribution of biogenic silica to the oceanic silica budget, Limnol. Oceanogr., 42, 774–777, 1997.
Conley, D. J., Schelske, C. L., and Stoermer, E. F.: Modification of the biogeochemical cycle of silica with eutrophication, Mar. Ecol.-Prog. Ser., 101, 179–192, 1993.
Cotner Jr., J. B. and Wetzel, R. G.: Uptake of dissolved inorganic and organic phosphorus compounds by phytoplankton and bac-terioplankton, Limnol. Oceanogr., 37, 232–243, 1992.
Dai, M., Guo, X., Zhai, W., Yuan, L., Wang, B., Wang, L., Cai, P., Tang, J., and Cai, W. J.: Oxygen depletion in the upper reach of the Pearl River estuary during a winter drought, Mar. Chem., 102, 159–169, 2006.
de Madron, X. D., Denis, L., Diaz, F., Garcia, N., Guieu, C., Grenz, C., Lo¨ye-Pilot, M. D., Ludwig, W., Moutin, T., Raimbault, P., and Ridame, C.: Nutrients and carbon budgets for the Gulf of Lion during the Moogli cruises, Oceanol. Acta, 26, 421–433, 2003.
Dennison, W. C.: Environmental problem solving in coastal ecosys-tems: A paradigm shift to sustainability, Estuar. Coast. Shelf S., 77, 185–196, 2008.
Duan, S., Liang, T., Zhang, S., Wang, L., Zhang, X., and Chen, X.: Seasonal changes in nitrogen and phosphorus transport in the lower Changjiang River before the construction of the Three Gorges Dam, Estuar. Coast. Shelf S., 79, 239–250, 2008. Duan, S., Xu, F., and Wang, L.-J.: Long-term changes in nutrient
concentrations of the Changjiang River and principal tributaries, Biogeochemistry, 85, 215–234, 2007.
Fei, Z., Mao, X., Zhu, M., Li, B., Li, B., Guan, Y., Zhang, X., and L¨u, R.: The study of primary productivity in the Bohai Sea:
Chlorophyll a, primary productivity and potential fisheries re-sources, Mar. Fish. Res., 12, 55–69, 1991 (in Chinese with En-glish abstract).
Feng, J. L. and Zhang, W.: The evolution of the modern Luanhe River delta, north China, Geomorphol., 25, 269–278, 1998. Froelich, P. N.: Kinetic control of dissolved phosphate in natural
rivers and estuaries: A primer on the phosphate buffer mecha-nism, Limnol. Oceanogr., 33, 649–668, 1988.
Gaillardet, J., Dupre, B., Laouvat, P., and Allegre, C. J.: Global silicate weathering and CO2consumption rates deduced from the chemistry of large rivers, Chem. Geol., 159, 3–30, 1999. Gao, S., Yu, G., and Wang, Y.: Distribution features and fluxes of
dissolved nitrogen,phosphorus and silicon in the Hangzhou Bay, Mar. Chem., 43, 65–81, 1993.
Gong, G.-C., Wen, Y.-H., Wang, B.-W., and Liu, G.-J.: Seasonal variation of chlorophyll a concentration, primary production and environmental conditions in the subtropical East China Sea, Deep-Sea Res. Pt. II, 50, 1219–1236, 2003.
Gordon, D. C., Jr., Boudreau, P. R., Mann, K. H., Ong, J.-E., Silvert, W. L., Smith, S. V., Wattayakorn, G., Wulff, F., and Yanagi, T. (Eds.): LOICZ Biogeochemical Modelling Guidelines, LOICZ Reports and Studies, 5, LOICZ, Texel, The Netherlands, 96 pp., 1996.
Harrison, P. J., Yin, K., Lee, J. H. W., Gan, J., and Liu, H.: Physical-biological coupling in the Pearl River Estuary, Cont. Shelf Res., 28, 1405–1415, 2008.
Hong, G. H. (Ed.): A study on the geochemistry of the Han River system and Soyang Lake, Technical Report BSPE00115-185-4, Korea Ocean Research and Development, Ansan, Korea, 180 pp., 1988.
Hong, G. H., Zhang, J., Kim, S. H., Chung, C. S., and Yang, S. R.: East Asian marginal seas: river-dominated ocean margin, in: Im-pact of Interface Exchange on the Biogeochemical Processes of the Yellow and East China Seas, edited by: Hong, G. H., Zhang, J., and Chung, C. S., Bum Shin Press, Seoul, 233–260, 2002. Hu, J. and Li, S.: Modeling the mass fluxes and transformations
of nutrients in the Pearl River Delta, China, J. Marine Syst., 78, 146–167, 2009.
Hu, M., Yang, Y., and Xu, Q.: Estuarine geochemistry of the Min-jiang River, in: The Biogeochemistry of the Main Estuaries in China – the Migrating and Environment of Chemical Substances, edited by: Zhang, J., China Ocean Press, Beijing, 68–78, 1996 (in Chinese with English abstract).
Huang, B. Q., Ou, L. J., Hong, H. S., Luo, H. W., and Wang, D. Z.: Bioavailability of dissolved organic phosphorus compounds to typical harmful dinoflagellateProrocentrum donghaienseLu, Mar. Pollut. Bull., 51, 838–844, 2005.
Huang, L., Jian, W., Song, X., Huang, X., Liu, S., Qian, P., Yin, K., and Wu, M.: Species diversity and distribution for phytoplankton of the Pearl River estuary during rainy and dry seasons, Mar. Pollut. Bull., 49, 588–596, 2004.
Huang, X. P., Huang, L. M., and Yue, W. Z.: The characteristics of nutrients and eutrophication in the Pearl River estuary, South China, Mar. Pollut. Bull., 47, 30–36, 2003.
Humborg, C., Ittekkot, V., Cociasu, A., and Bodungen, B. V.: Effect of Danube River dam on Black Sea biogeochemistry and ecosys-tem structure, Nature, 386, 385–388, 1997.
Estuar. Coast. Shelf S., 54, 887–900, 2002.
Hung, J.-J. and Hung, P.-Y.: Carbon and nutrient dynamics in a hypertrophic lagoon in southwestern Taiwan, J. Mar. Syst., 42, 97–114, 2003.
Jiang, Y., Chen, S., Guan, D., and Fu, Y.: The chemical character-istics and influx calculation of the nutrients in Liaohe Estuary, Mar. Environ. Sci., 14, 39–45, 1995 (in Chinese with English abstract).
Jin, X.: Long-term changes in fish community structure in the Bohai Sea, China, Estuar. Coast. Shelf S., 59, 163–171, 2004. Justi´c, D., Turner, R. E., and Rabalais, N. N.: Climatic influences
on riverine nitrate flux: implications for coastal marine eutroph-ication and hypoxia, Estuaries, 26, 1–11, 2003.
Kang, Y.: Distribution and seasonal variation of phytoplankton in the Bohai Sea, Mar. Fish. Res., 12, 31–54, 1991 (in Chinese with English abstract).
Kim, D. W., Park, Y. C., Lee, H. J., and Son, J. W.: Characteristics of geochemical processes along the salinity gradient in the Han River estuary, The Sea, 9, 196–203, 2004a (in Korean). Kim, L. H., Choi, E., Gil, K. I., and Stenstrom, M. K.: Phosphorus
release rates from sediments and pollutant characteristics in Han River, Seoul, Korea, Sci. Total Environ., 321, 115–125, 2004b. Li, D. J., Zhang, J., Huang, D. J., Wu, Y., and Liang, J.: Oxygen
depletion off the Changjiang (Yangtze River) Estuary, Sci. China, 45D, 1137–1146, 2002.
Li, G., Lin, H., Chen, K., and Dong, Y.: Study on eutrophication and annual change of nutrients in Dapeng Bay, Marine Science Bulletin, 23, 61–65, 2004 (in Chinese with English abstract). Li, J.-Y.: A study on the chemical weathering, mechanical
de-nudation correlative with river water and sediment geochemistry and CO2consumption budget and controlling factors in the ma-jor drainage basins of China, PhD Thesis, Ocean University of China, Qingdao, China, 195 pp., 2003.
Li, J.-Y. and Zhang, J.: Natural controls of fluvial denudation rates in major drainage basins of China, Scientia Geographica Sinica, 23, 434–440, 2003 (in Chinese with English abstract).
Li, M., Xu, K., Watanabe, M., and Chen, Z.: Long-term varia-tions in dissolved silicate, nitrogen, and phosphorus flux from the Yangtze River into the East China Sea and impacts on estuar-ine ecosystem, Estuar. Coast. Shelf S., 71, 3–12, 2007.
Lin, C., Ning, X., Su, J., Lin, Y., and Xu, B.: Environmental changes and the responses of the ecosystems of the Yellow Sea during 1976–2000, J. Marine Syst., 55, 223–234, 2005. Liu, G. Q., Wang, S. Y., Zhu, X. J., Liu, S. M., and Zhang, J.:
Groundwater and nutrient discharge into Jiaozhou Bay, North China, Water Air Soil Poll., Focus, 7, 593–605, 2007a.
Liu, S. M., Li, X. N., Zhang, J., Wei, H., Ren, J. L., and Zhang, G. L.: Nutrient dynamics in Jiaozhou Bay, Water Air Soil Poll., Focus, 7, 625–643, 2007b.
Liu, S. M. and Zhang, J.: Nutrient dynamics in the macro-tidal Yalujiang Estuary, J. Coastal Res., SI, 147–161, 2004.
Liu, S. M., Zhang, J., Chen, H. T., Xiong, H., Wu, Y., and Zhang, Z. F.: Nutrients in the Changjiang and its tributaries, Biogeochem-istry, 62, 1–18, 2003a.
Liu, S. M., Zhang, J., Chen, S. Z., Chen, H. T., Hong, G.H., Wei, H., and Wu, Q. M.: Inventory of nutrient compounds in the Yellow Sea, Cont. Shelf Res., 23, 1161–1174, 2003b.
Liu, S. M., Zhang, J., Chen, H. T., and Zhang, G. S.: Factors influ-encing nutrient dynamics in the eutrophic Jiaozhou Bay, North
China, Prog. Oceanogr., 66, 66–85, 2005a.
Liu, S. M., Zhang, J., and Li, R. X.: Ecological significance of biogenic silica in the East China Sea, Mar. Ecol.-Prog. Ser., 290, 15–26, 2005b.
Liu, S. M., Ye, X. W., Zhang, J., Zhang, G. S., and Wu, Y.: The silicon balance in Jiaozhou Bay, North China, J. Marine Syst., 74, 639–648, 2008a.
Liu, S. M., Zhang, J., Gao, H. W., and Liu, Z.: Historic changes in flux of materials and nutrient budgets in the Bohai, Acta Oceanol. Sin., 27, 1–17, 2008b.
L¨u, R., Xia, B., Li, B., and Fei, Z.: The fluctuations of primary productivity in Bohai Sea waters over ten years, J. Oceanogr. Huanghai Bohai Seas, 17, 80–86, 1999 (in Chinese with English abstract).
Meybeck, M.: Carbon, nitrogen and phosphorus transport by world rivers, Am. J. Sci., 282, 401–450, 1982.
Millenium Ecosystem Assessment: Ecosystems and human well-being, Synthesis, Island Press, Washington, D.C., 137 pp., 2005. Ministry of Hydrology Power of People’s Republic of China: Na-tional Bulletin of River Sediment: 2003, Beijing, 93 pp., 2004 (in Chinese).
M¨uller, B., Berg, M., Yao, Z. P., Zhang, X. F., Wang, D., and Pfluger, A.: How polluted is the Yangtze river? Water quality downstream from the Three Gorges Dam, Sci. Tot. Environ., 402, 232–247, 2008.
National Compilation Committee of Hydrology Almanac (Eds.): The Main River Hydrology Statistics of China, Hydrology and Electric Power Hydrological Bureau, China, 943 pp., 1982 (in Chinese).
National Compilation Committee of River and Sediment Com-muniqu´e (Eds.): Chinese River and Sediment ComCom-muniqu´e (Changjiang and Huanghe), Hydrology Power Press, China, 75 pp., 2000 (in Chinese).
Nixon, S. W.: Coastal marine eutrophication: A definition, social causes, and future concerns, Ophelia, 41, 199–219, 1995. Nixon, S. W., Oviatt, C. A., Frithsen, J., and Sullivan, B.: Nutrients
and the productivity of estuarine and coastal marine ecosystems, J. Limnol. Soc. S. Afr., 12, 43–71, 1986.
Pahlow, M. and Riebesell, U.: Temporal trends in deep ocean Red-field ratios, Science, 287, 831–833, 2000.
Peng, X., Ning, X.-R., Sun, J., and Le, F.-F.: Responses of phyto-plankton growth on nutrient enrichments in the northern South China Sea, Acta Ecologica Sinica, 26, 3959–3968, 2006 (in Chi-nese with English Abstract).
Qiu, Y.-W., Wang, Z.-D., and Zhu, L.-S.: Variation trend of nutrient and chlorophyll contents and their effects on ecological environ-ment in Daya Bay, J. Oceanogr. Taiwan Strait, 24, 131–139, 2005 (in Chinese with English abstract).
Qu, C. H., Chen, C. Z., Yang, J. R., Wang, L. Z., and Lu, Y. L.: Geochemisry of dissolved and particulate elements in the major rivers of China (the Huanghe, Changjiang and Zhujiang rivers), Estuaries, 16, 475–487, 1993.
Rabalais, N. N., Turner, R. E., Dortch, Q., Justi´c, D., Bierman Jr., V. J., and Wiseman Jr., W. J.: Review. Nutrient-enhanced produc-tivity in the northern Gulf of Mexico: past, present and future, Hydrobiologia, 475/476, 39–63, 2002.