www.biogeosciences.net/7/3019/2010/ doi:10.5194/bg-7-3019-2010
© Author(s) 2010. CC Attribution 3.0 License.
Biogeosciences
Density/area power-law models for separating multi-scale anomalies
of ore and toxic elements in stream sediments in Gejiu mineral
district, Yunnan Province, China
Q. Cheng1,2, Q. Xia1,3, W. Li4, S. Zhang5, Z. Chen1,3, R. Zuo1, and W. Wang2
1State Key Laboratory of Geological Processes and Mineral Resources, China University of Geosciences, Wuhan 430074,
Beijing 100087, China
2Department of Earth and Space Engineering, Department of Geography, York University, Toronto, 4700 Keele Street,
M3J 1P3, Ontario, Canada
3Faculty of Resources, China University of Geosciences, China
4Yunnan Academy of Geological Survey, Kunming 650051, Yunnan, China
5Institute of Resources and Environment, Shijianzhuang University of Economics, Shijiazhuang, China
Received: 1 April 2010 – Published in Biogeosciences Discuss.: 7 June 2010
Revised: 9 September 2010 – Accepted: 17 September 2010 – Published: 6 October 2010
Abstract. This contribution introduces a fractal filtering technique newly developed on the basis of a spectral energy density vs. area power-law model in the context of multifrac-tal theory. It can be used to map anisotropic singularities of geochemical landscapes created from geochemical concen-tration values in various surface media such as soils, stream sediments, tills and water. A geochemical landscape can be converted into a Fourier domain in which the spectral energy density is plotted against the area (in wave number units), and the relationship between the spectrum energy density (S) and the area (A) enclosed by the above-threshold spectrum energy density can be fitted by power-law models. Mixed geochemical landscape patterns can be fitted with different S-A power-law models in the frequency domain. Fractal fil-ters can be defined according to these different S-A models and used to decompose the geochemical patterns into com-ponents with different self-similarities. The fractal filtering method was applied to a geochemical dataset from 7,349 stream sediment samples collected from Gejiu mineral dis-trict, which is famous for its word-class tin and copper pro-duction. Anomalies in three different scales were decom-posed from total values of the trace elements As, Sn, Cu, Zn, Pb, and Cd. These anomalies generally correspond to various geological features and geological processes such as sedimentary rocks, intrusions, fault intersections and miner-alization.
Correspondence to:Q. Cheng ([email protected])
1 Introduction
area. It has been proven that arsenic contamination of soil, water and air can cause various health problems such as lung cancer. It was reported that in Gejiu city, 0.27% of the pop-ulation is detected as having lung cancer each year, which is the highest lung cancer death rate of any city in China (Xie et al., 2000). To understand the spatial distribution of arsenic in surface media and to identify the various main sources of arsenic contamination are therefore critical issues both for environmental management and environmental remediation. To identify anomalous areas of these types of toxic contam-ination in association with mineralization and mining is an interesting subject attracting a great deal of attention from the ore geology and environmental geosciences community. To separate the influence of the natural process of mineral-ization from that of human mining activities is a critical task for environmental and mineral resource assessments. Due to the superimposed and complex processes involved in the formation of element concentrations in the secondary media, it is a challenge to fully understand the processes and the properties of their distribution. For example, various cascade geo-processes and bio-processes can cause singular distribu-tions of element concentradistribu-tions in primary and second me-dia. This paper investigates the scaling properties of toxic elements in stream sediments by identifying components of anomalies that can be isolated to reveal the various causes of elevated toxic element concentrations in surface media
2 Study area and materials
2.1 Study area
The area chosen for the case study is Gejiu district, a word-class tin production region that is located along the suture zone of the Indian and Eurasian plates on the southwestern edge of the China sub-plate, approximately 200 km south of the city of Kunming, capital of Yunnan Province. The mining of, exploration for and utilization of tin resources play an im-portant role in economic development in both Gejiu city and Yunaan province. The tin resources in Gejiu are important for both the international and domestic non-ferrous metals industries. However, there is a current shortage of Gejiu tin resources because the tin reservoir has been mined for several decades. Therefore, mineral exploration in the deeper and peripheral spaces has become a top priority in Gejiu district. Contamination by toxic elements caused by natural mineral-ization processes and the mining activity has also become a critical issue for the sustainable development of the region.
To assess toxic element contamination in surface media and implement environment remediation, one needs to un-derstand the sources of the contamination and their spatial distribution. These are the main objectives of the current study.
2.2 Materials and data
The dataset used in this paper comprises (1) a detailed 1:200 000 scale geological map (2) geochemical data regard-ing As, Cd, Cu, Pb, Zn and Sn derived from 7,349 stream sediment samples, and (3) Sn mineral distribution informa-tion that includes geographic coordinates and other geolog-ical attributes. The geochemgeolog-ical data were the main dataset for the study. The area chosen for this study was covered by about 7,349 evenly distributed stream sediment samples, each covering a 2 km×2 km (4 km2)area. These samples were collected and analyzed by the Chinese National Geo-chemical Mapping Project as part of the Regional Geochem-istry National Reconnaissance (RGNR) Project, which was initiated in 1979. Between 1979 and 1997, the project has generated a vast quantity of geochemical data covering a total area of 5.17 million km2in China (Xie et al., 1997). For each sample, the concentrations of 39 geochemical elements and 7 compounds were measured at equally spaced 2-km inter-vals throughout the study area. The data used in the current paper are geochemical concentration values in unit of ppm of As, Sn, Cd, Cu, Pb, and Zn trace elements. Further de-tails about the processes involved in sampling and analyzing the stream sediment geochemical data can be found in Xie et al. (1997). The trace elements and their associations with Sn mineralization in the area were previously studied (Cheng, 2007; Cheng and Agterberg, 2009; Cheng et al., 2009). 2.3 Geology of Gejiu district
193649/2657588
397586/2508392 193649/2657588
397586/2508392
Fig. 1. Simplified geology of the study area derived from four 1:200 000 scale maps (Southwestern Geological Exploration Team, 1984). Pink represents Proterozoic metamorphic rocks, yellow is for the Gejiu Formation of Paleozoic carbonate sedimentary rocks, grey is for other sedimentary rocks, dark red is for mafic igneous rocks including basalts, red is for felsic intrusive rocks, solid lines are for faults systems and the two types of point symbols, black tri-angles and green circles, respectively represent Sn and Cu mineral deposits and occurrences.
descriptions of the geology, geochemistry and mineralogy of the area can be found in Qing et al. (2004) and Yu et al. (1988).
3 Methodology
A fractal filtering method developed on the basis of the gen-eralized self-similarity principle (Cheng et al., 1999; Cheng, 2004) was used to separate the mixing patterns of As in the area.
3.1 A generalized self-similarity and spectrum density/area power-law model
Scale invariance, including similarity (or isotropic), self-affinity (or stratification) and generalized self-similarity (or anisotropy) is a common property of spatial patterns gener-ated from various geological processes and events. Fractal and multifractal models have been applied in various fields as powerful tools to characterize the scale invariance of geo-processes and geo-events. Multiple successes have been re-ported with the application of fractal and multifractals in the context of geocomplexity (Lovejoy et al., 2009). While most of the fractal models were used to deal with isotropic scale invariance, several models have been investigated for modeling anisotropic scale invariance. For example, a new formalism of generalized scale invariance (GSI) was pro-posed and utilized by Schertzer and Lovejoy (1985, 1987)
to model scale invariance more generally. This formalism states that large and small scales of geo-fields can be related by general scale-transform operations without introducing a characteristic size. Various models were developed to simu-late geo-fields with anisotropic scale invariance (Lovejoy and Schertzer, 2007; Lovejoy et al., 2009). A different model was proposed on the basis of extreme value distributions of 2-D multifractal fields stating that the concentration value (C) and the area enclosed by the cutoff concentration value (A[> C]) follow a power-law relation (Cheng et al., 1994).
A[> C] ∝C−β (1)
This concentration-area model (C-A model) idea was further extended to characterize the spectral energy density/area re-lation in frequency domains (Cheng et al., 1999). A power-law was proposed to relate the spectral energy density (S[ω], whereωis wave number vector) to the area with thresholdS
(A[> S]), and
A[≥S] ∝S−2d/β (2)
where∝ stands for “proportional to”, β is the anisotropic scaling exponent, and d is a parameter representing degree of overall contraction (Cheng et al., 1999; Cheng, 2004). Since the shape ofAinvolved in these models (C-A and S-A) at different concentrations (C) or spectral energy densities (S) can be any self-similarly shaped contour, these self-similar contours characterize the anisotropic scale invariance of the density distribution. Thus, the exponent of the power-law re-lation becomes an essential index that characterizes general-ized self-similarity, implying that a geo-field shows diversity in the spatial domain and depicting self-similarity in a special domain such as a Fourier domain (Cheng 2004, 2005). 3.2 Fractal filtering technique
The fractal filtering technique was developed on the basis of the S-A power-law model by Cheng, Xu and Grunsky (1999) for decomposing mixing patterns into components ac-cording to distinct self-similarities identified in Fourier do-mains. According to the power-law relation betweenS and
A, when the data ofS andAare plotted on a log-log plot, several straight-line segments can usually be fitted to the re-lation S-A. Each spectral energy density range within which
S andAis fitted by a straight-line segment can be used to define a fractal filter. For example, if two straight-line seg-ments are fitted to the data and these straight-lines yield the thresholdS0, then two filters can be defined as:GB(ω)=1 if S(ω) > S0, and if otherwise,GB(ω)=0; and asGA(ω)=1
ifS(ω)≤S0, and if otherwise, GA(ω)=0. From the
def-initions ofGA(ω) andGB(ω), we can see that the shapes
of the filters could be irregular depending on the complexity of the spectral energy density distribution. However, in gen-eral, the wave numbersωin filterGA(ω)are relatively larger
than those inGB(ω), implying that the frequency inGA(ω)
corresponds to a relatively high frequency component and
GB(ω)to a relatively low frequency component. However,
one must keep in mind that the two filters are not sharply bounded either by frequency or by wave number. They are defined in such a way that the spectral energy density distri-butions on the two filters satisfy distinct power-laws or have different anisotropic scaling properties that, in a simple situ-ation, may correspond to distinct (isotropic) self-similarities or self-affinities (stratification). Applying the inverse Fourier transformation with these two filters applied to the Fourier-transformed functions we get decomposed components in the space domain:
TB=F−1[F (T)GB)],TA=F−1[F(T)GA)] (3)
whereF andF−1represent the Fourier and inverse Fourier transformations of a map T, respectively. From the property of the Fourier transformations, we can see that the total field T is decomposed into two components TAand TB with
dif-ferent frequency properties, T = TA+ TB. The frequencies
of TA and TB may not be totally different but they must
show distinct scaling properties in their spatial distribution as quantified by two distinct power-laws in the frequency do-main. Depending upon the actual property of the spectral energy density distribution of the field, one may define two or three filters on the basis of the power-law relations ofS
andA.
We know there are many different types of filtering tech-niques such as frequency – based high- low- and band-pass filters and wavelet filters. Most of these filters are involved filters defined with predetermined functions. The problem for these types of filters is how to decide the separation of low- and high-pass filters. In some cases these types of deci-sions are made arbitrarily. The method S-A introduced in the current paper involves separation of filters based on distinct self-similarities as defined using S-A plots. However, to em-pirically and systematically compare the results obtained by S-A method and many other filtering methods are still needed for a comprehensive evaluation of the effectiveness of S-A on filtering. This should be studied in our future research. This paper introduces a simple version of S-A so that it can be readily used in the field of soil imaging and non-linear imag-ing processimag-ing.
4 Results and discussion
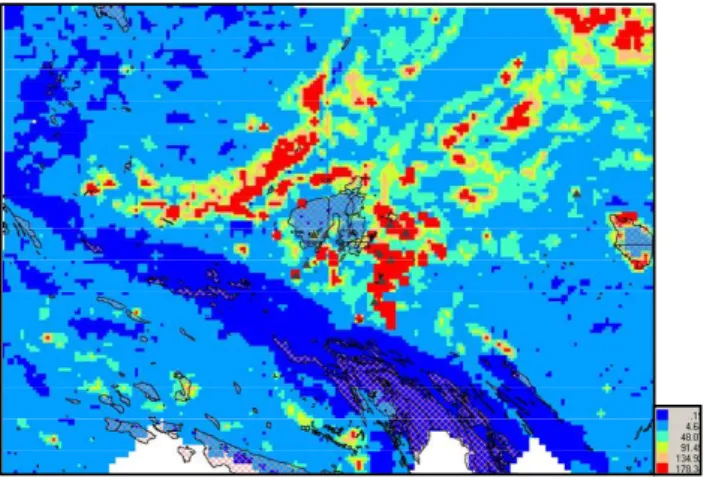
The original geochemical data for Sn, As, Cu, Pb, Zn and Cd were converted into a grid with 2-km intervals without interpolation. For example, the concentration distribution of the element As (Fig. 2) shows that the high values are mainly distributed in the central and upper parts of the study area where carbonate sedimentary rocks of the Gejiu formation and basalts are the dominate rock types. High anomalies of As are also found around the felsic intrusions and around several large tin deposits. The elevated values of Sn, Cu, Zn,
Fig. 2. A geochemical landscape created by As concentration val-ues in ppm of stream sediment samples. The black polygons are mapped intrusions. The black triangles are tin mineral deposits.
Pb, Cd and As are generally in agreement with the locations of known tin and copper mineral deposits (the results for the other elements are not shown here). The patterns of As in Fig. 2 represent the total values analyzed in the stream sed-iment samples and these values were caused by overlapping processes such as sedimentation, volcanic activity, igneous activity, faulting activity and mineralization. They can also be influenced by surface weather processes and human ac-tivities, among other things. Due to the different nature of these processes, the patterns related to these types of pro-cesses may be distinguishable according to various proper-ties such as frequency distribution when the patterns treated as space series. It is its distinctive frequency distribution and scaling property that allow the S-A fractal filtering technique to separate patterns according to their distinct self-similarity observed from the spatial patterns in the frequency domain.
(A) (B)
(C) (D)
III
II
I
Fig. 3. (A)Plot showing the S-A relationship between the spec-tral energy density (S) and area (A). The dots are the calculated results and the three red lines labeled as I, II, and III were fitted by the LS method. The logarithmic transformations are base ten.(B– D)Decomposed background, anomalous and noise components of As using filters I, II and III, respectively. The black polygons are mapped intrusions. The black triangles are tin mineral deposits.
are separated by two cutoff values,S=662.95 and 2295.79. The slopes of these three straight lines are significantly dif-ferent, for example,−1.33,−1.97,−1.68, and the intercepts of the three straight-lines are 16.21, 20.34, and 18.15, re-spectively. The standard errors related to these three linear fits are 0.007, 0.002 and 0.004, respectively. These stan-dard errors (values<0.01) indicate the fittings of all three straight lines are statistically significant. The cutoff values
S=662.95 and 2295.79 were used to define three filters: one consists of wave numbers withS≤662.95 as the noise filter, 662.95< S≤2295.79 as the anomaly filter and wave num-bers withS >2295.79 as the background filter. The shapes of the three filters are irregular and maintain the anisotropic properties and spatial structure of the geochemical pattern. Within these three filtersSandAfollow three distinct power-law relations each with its own exponent, implying that the signals in these ranges are self-similar.
Applying the three filters with ranges ofS defined as I, II and III in Fig. 3a to the Fourier-transformed functions and then converting them back to the spatial domain, three de-composed maps were created and are shown in Figs. 3b, c and d. Figure 3b represents the background component of the geochemical landscape, which generally coincides with the Gejiu formation except for an anomaly located east of the Gejiu Batholite coinciding with known mineral deposits. It was proposed that these areas are underlined by buried Gejiu Batholite (Cheng et al., 2009). However, Fig. 3c shows that local As anomalies are distributed not only in the central re-gion but also in other areas. The anomalous areas are spa-tially in good agreement with the locations of known mineral deposits, along faults or around fault intersections. Figure 3d
Fig. 4. Distribution of first principal component scores calculated using principal component analysis with a correlation coefficient matrix for the log-transformed values of the elements Sn, As, Zn, Pb, Zn and Cd. The loadings of these elements are similar and the first component accounts for 67% of the variance of the total dataset. The black polygons are mapped intrusions. The black triangles are tin mineral deposits.
shows patterns generally of a random nature except for some locations with individually high values.
To further investigate the association of As and other rel-evant ore elements found in tin and copper mineral deposits, six maps were created for the elements Sn, As, Pb, Zn, Cu and Cd in the same way as the As map. These six maps were combined by means of principal component analysis with a correlation coefficient matrix model. More about the general use of principal component analysis (PCA) and some new extensions of PCA can be found in many references, such as Cheng et al. (2006). The first principal component reflects the combination of all six elements with evenly distributed positive loading. This indicates that the component repre-sents the main elements associated with Sn and Cu mineral-ization. This component accounts for 67% of the variance of the entire dataset. The scores of the six elements on the first principal component were calculated and are shown in Fig. 4. The score patterns in Fig. 4 generally show high values in the area of the Gejiu formation and around the Gejiu Batho-lite and other felsic intrusions. Again, the patterns represent the overlapping contributions of various geological features and processes. In order to further decompose the score pat-terns on the basis of self-similarity using the S-A method, the score map was further converted into a frequency domain by means of Fourier transformation. The S-A plot is shown in Fig. 5a. The values ofSandAgenerally show a descending trend. Three straight-line segments were fitted to the data by means of the LS method. Using processes similar to those used in Fig. 3a, three straight lines yield two cutoff values of
(A) (B)
III
II
I
(C) (D)
Fig. 5. (A)Plot showing the S-A relationship between the spec-tral energy density (S) and area (A). The dots are the calculated results and the three red lines labeled as I, II, and III were fitted by the LS method. The logarithmic transformations are base ten.(B– D)Decomposed background, anomalous and noise components of As using filters I, II and III, respectively. The black polygons are mapped intrusions. The black triangles are tin mineral deposits.
three linear fits are 0.006, 0.004 and 0.005, respectively. The cutoff valuesS=487.57 and 2387.63 were used to define three filters: one consists of wave numbers withS≤487.57 as the noise filter, 487.57< S≤2387.63 as the anomaly filter and wave numbers withS >2387.63 as the background filter. Applying these three filters to the Fourier-transformed func-tions and then converting them back to the spatial domain generates the three decomposed maps: background, anomaly and high frequency (noise) maps as shown in Fig. 5b, c and d, respectively. The background map (Fig. 5b) shows the general trend with elevated values located in the areas around the Gejiu formation and basalts. This implies that the Gejiu formation must be favorable rock for Sn miner-alization. In addition, a distinct anomaly is highlighted in the east Gejiu Batholite where igneous rocks are observed in drill halls and buried intrusions were inferred by process-ing geophysical data (Cheng et al., 2009). In this anomaly, most tin and copper mineral deposits are found. In Fig. 5c, the local anomalies appear as elongated or chain patterns. These linear anomalies are highly associated with either the known mineral deposits, faults or the intersections of fault systems, implying that these types of anomalies may indi-cate locations where mineralization occurred on the surface or at depth. These anomalies provide small target areas for further mineral exploration. It was reported that some new mineral deposits have been found in the areas identified by S-A method (Li et al., 2006). Fig. 5d shows the high frequency component of the geochemical landscape, which mainly re-flects random noise except some locations with individually high values. This small-scale highly noisy pattern may also be related to mine tailings and ore transportation in the area.
This case study, where we separated the geochemical land-scape into various components on the basis of generalized self-similarities quantified in frequency domains, has demon-strated that the low-frequency background component is gen-erally related to favorable rock types as well as the influ-ence of intrusions, whereas the anomalies as intermediate frequency components are generally related to fault systems and intersections of faults, which are favorable areas for lac-tating mineral deposits. Most of the known large mineral deposits are located in these anomalous areas. The high-frequency component decomposed with the high-pass filter is generally random noise except some locations with individu-ally high values that may be due to mining activities and tail-ing storage. It has been shown that the self-similarity prop-erty quantified by the S-A power-law model in a frequency domain can be used to decompose the total and often mixed geochemical patterns into separate components with distinct frequency distribution self-similarities that are related to var-ious geological features and/or processes. This example has also demonstrated that igneous intrusions (such as the Gejiu and Rushan Batholiths), sedimentary rocks (Gejiu Forma-tion) and various fault systems in the study area play impor-tant roles in controlling mineralization. The Gejiu formation of carbonates shows high concentrations of element associa-tions and the igneous rocks intruded into the Gejiu formation caused large anomalies in their outer contact zones that pro-vide a favorable background environment for mineralization. Fault activity and intersections of fault systems provide a fa-vorable environment for local anomalies and for the occur-rence of mineral deposits. Due to the dimensional distinction of these types of features and processes and their influences on the patterns of the geochemical landscape, it is possible to decompose the geochemical patterns according to the contri-butions of these features and processes.
5 Conclusions
function is established between energy density (S) and area (A), these types of filters can be termed multifractal filters. The results obtained from this study also indicate that there are potential areas for the discovery of new mineral deposits. The favorable areas are those places with local geochemical anomalies and other geological factors including the Gejiu formation, intrusions and fault systems. Toxic elements and ore elements are closely associated in this area, which indi-cates a potential for toxic element contamination due both to natural processes and human activity. Although strategically planning for both resource utilization and environmental pro-tection is challenging, our results indicate that such planning will be required in order to maintain sustainable development in the region.
Acknowledgements. Thanks A. M. Tarquis for her kind invitation
to write this paper. The research was financially supported by a Distinguished Young Researcher Grant (40525009)”, a Strategic Research Grant (40638041) awarded by the Natural Science Foun-dation of China, a High-Tech Research and Development Grant (2006AA06Z115, 2008AA121103) by the Ministry of Science and Technology of China and Grants from Ministry of Education of China (No. IRT0755 and No. 104244).
Edited by: A. M. Tarquis
References
Ashley, P. M. and Lottermoser, B. G.: Arsenic contamination at the Mole River mine, northern New South Wales, Aust. J. Earth Sci., 46, 861–874, 1999.
Cheng, Q: A new model for quantifying anisotropic scale invariance and for decomposition of mixing patterns, Math. Geol., 36, 345– 360, 2004.
Cheng, Q.: Multifractal distribution of eigenvalues and eigenvectors from 2D multiplicative cascade multifractal fields, Math. Geol., 37, 915–927, 2005.
Cheng, Q.: Mapping singularities with stream sediment geochemi-cal data for prediction of undiscovered mineral deposits in Gejiu, Yunnan Province, China, Ore Geol. Rev., 32, 314-324, 2007. Cheng, Q. and Agterberg, F. P.: Singularity analysis of ore-mineral
and toxic trace elements in stream sediments, Comput. Geosci., 35, 234–244, 2009.
Cheng, Q., Agterberg, F. P., Ballantyne, S. B.: The separation of geochemical anomalies from background by fractal methods, J. Geochem. Explor., 51, 109–130, 1994.
Cheng, Q., Xu, Y., and Grunsky, E.: Integrated spatial and spectral analysis for geochemical anomaly separation, August 6-11, 6th Annual Conference of the International Association for Mathe-matical Geology, Trondheim, Norway, 1999.
Cheng, Q., Jing, L., and Panahi, A.: Principal component analy-sis with optimum order sample correlation coefficient for image enhancement, Int. J. Remote Sens., 27(16), 3387–3401, 2006.
Cheng, Q., Zhao, P., Zhang, S., Xia, Q., Chen, Z., Chen, J., Xu, D., and Wang, W.: Application of singularity in mineral deposit pre-diction in Gejiu district: Information integration and delineation of target areas, Earth Science, 34(1), 243–252, (in Chinese with English abstract), 2009.
Gan, F., Fang, W., Wang, X., Yang, S., and Zheng, H.: Ecology and environment, the heavy metal contamination in soil-potato and pea of tin tailings, 17(5), 1847–1852, (in Chinese with English Abstract), 2008.
Jung, M. C., Thornton, I., and Chonc, H. T.: Arsenic, Sb and Bi contamination of soils, plants, waters and sediments in the vicin-ity of the Dalsung Cu–W mine in Korea, Science of the Total Environment, 295, 81–89, 2002.
Li, W., Li, L., and Yi, G.: Different data-processing methods for geochemical data from southern part of “Sanjiang (Three River)” region in south western China and their application results, Min-eral Deposits 25(4), 501–510, (in Chinese with English Ab-stract), 2006.
Lovejoy, S. and Schertzer, D.: Scaling and multifractal fields in the solid earth and topography, Nonlinear Processes of Geophysics, 14, 465–502, 2007.
Lovejoy, S., Agterberg, F., Carsteanu, A., et al.: Nonlinear Geo-physics: Why we need it, EOS, 90(48), 455–456, 2009. Meharg, A. A. and Maziburrahman, M. D.: Arsenic contamination
of Bangladesh paddy field soils: Implications for rice contribu-tion to Arsenic consumpcontribu-tion, Environ. Sci. Technol., 37, 229– 234, 2003.
Pandey, P. K., Nair, S., Bhui, A., and Pandey, M.: Sediment con-tamination by arsenic in parts of central-east India and analyti-cal studies on its mobilization, Current Science, 86(1), 190–197, 2004.
Qing, D., Tan, S., and Fab, Z.: Geotectonic evolution and tin-ploymetallic metallogenesis in Gejiu Dachang area, Acta Miner-alogica Sinica, 24, 117–123, (in Chinese with English abstract), 2004.
Schertzer, D. and Lovejoy, S.: Generalised scale invariance in tur-bulent phenomens, Physico-Chemical Hydrodynamics Journal, 6, 623–635, 1985.
Schertzer, D. and Lovejoy, S.: Physical modeling and analysis of rain and clouds by anisotropic scaling of multiplicative pro-cesses, J. Geophys. Res., 92, 9693–9714, 1987.
Southwestern Metallurgy Exploration Company of the Ministry of Metallurgy Industry, Geology of Gejiu mineral district, Metal-lurgy Industry Press, Beijing, 1984.
Xie, S., Zhao, Y., and Xue, C.: Environmental issue and sustainable development in Gejiu, Yunnan, China, Population, Resources and Environment, 10(special issue), 89–90, (in Chinese), 2000. Xie, X., Mu, X., and Ren, T.: Geochemical mapping in China, J.
Geochem. Explor., 60, 99–113, 1997.
Yu, C., Tang, Y., Shi, P., and Deng, B.: The dynamic system of en-dogenic ore formation in Gejiu tin–polymetallic ore region, Yun-nan Province. China University of Geosciences Press, Wuhan, China, 394 pp., (in Chinese with English Abstract), 1988. Zhou, Y., Liu, J., Gao, Q., Han, H., Liu, D., and Zhang, C.: