1Universidade Federal de Viçosa, Centro de Ciências Biológicas, Departamento de Nutrição. Campus Universitário, s/n., 36570-900, Viçosa, MG, Brasil. Correspondência para/Correspondence to: JC MACHADO. E-mail: <[email protected]>. 2Universidade Federal de Viçosa, Centro de Ciências Biológicas, Departamento de Enfermagem e Medicina. Viçosa, MG, Brasil.
Support: Coordenação de Aperfeiçoamento de Pessoal de Nível Superior (AUX-PE-Pro-Ensino Saúde 2034/2010, Process nº 23038.009788.12010-78) e Fundação de Amparo à Pesquisa de Minas Gerais (Edictal 14/2012, Process nº CDS-APQ-03594-12).
Adherence to non-pharmacological
treatment: Analysis of the impact
of three health educational and
nutritional strategies in
hypertensive patients
Adesão ao tratamento não farmacológico
:
análise do impacto de três estratégias
de educação em saúde e nutrição
em portadores de hipertensão
arterial
Juliana Costa MACHADO1
Rosângela Minardi Mitre COTTA1
Tiago Ricardo MOREIRA2
Luciana Saraiva da SILVA1
A B S T R A C T
Objective
To evaluate adherence to non-pharmacological treatment of hypertension by comparing biochemical, clinical, anthropometric, and dietary parameters before and after three health educational and nutritional strategies.
Methods
This longitudinal clinical trial included 212 hypertensive individuals who met the inclusion criteria. The participants were allocated to three groups to assess the impact of monthly intervention methods over twelve months.
Results
in Groups 1 and 2. The interventions also reduced the mean per capita intakes of oil, sugar, and salt in all groups.
Conclusion
Educational interventions promoted adherence to non-pharmacological treatment of treatment of hypertension evidenced by anthropometric (weight, body mass index, and waist circumference), biochemical (blood glucose, total cholesterol, and low-density lipoprotein cholesterol), and dietary (mean per capita intake of oil, sugar, and salt) parameters.
Keywords: Food and nutrition education. Health education. Hypertension.
R E S U M O
Objetivo
Avaliar a adesão ao tratamento não farmacológico da hipertensão arterial sistêmica por meio de parâmetros antropométricos, bioquímicos, clínicos e dietéticos antes e após três estratégias de educação em saúde e nutrição.
Métodos
Trata-se de um estudo de intervenção longitudinal, do tipo ensaio comunitário, comparativo, de abordagem quantitativa. A amostra foi constituída de 212 indivíduos com diagnóstico de hipertensão arterial sistêmica que atenderam aos critérios de inclusão/exclusão. Os participantes foram alocados em três grupos de forma a avaliar o impacto das modalidades de intervenção realizadas mensalmente durante 12 meses.
Resultados
No grupo 1, houve redução estatisticamente significante da circunferência da cintura. Nos grupos 2 e 3, os resultados foram estatisticamente significantes para o peso, índice de massa corporal e circunferência da cintura. Foram verificadas reduções estatisticamente significantes na glicemia, no colesterol total e lipoproteína de baixa densidade nos grupos 1 e 2. As intervenções também foram capazes de promover alterações favoráveis no consumo médio per capita de óleo, açúcar e sal em todos os grupos.
Conclusão
As intervenções educativas propiciaram resultados positivos sobre a adesão ao tratamento não farmacológico da hipertensão arterial sistêmica, considerando os parâmetros antropométricos (peso, índice de massa corporal e circunferência da cintura), bioquímicos (glicemia, colesterol total e lipoproteína de baixa densidade), e dietéticos (consumo médio per capita de óleo, açúcar e sal).
Palavras-chave: Educação alimentar e nutricional. Educação em saúde. Hipertensão.
I N T R O D U C T I O N
Hypertension is a multifactorial clinical condition characterized by high and sustained blood pressure levels. It is considered a chronic Non-Communicable Disease (NCD) and an independent and modifiable risk factor for cardiovascular and renal diseases. Hypertension is responsible for 13.5% of all deaths in the world, representing a severe public health problem because of its high prevalence, low control rate,
and high economic and social costs1,2. The
prevalence of hypertension in Brazil varies by region and age group; the mean prevalence is
32.5%, but the prevalence increases to 50.0% in individuals aged 60 to 69 years and to 75.0% in individuals aged more than 69 years1.
Although the available therapies have proven effective, many studies show low adherence to hypertension treatment. If low adherence could be remediated, it could reduce morbidity and mortality. Adherence rates to hypertension treatment in Brazil are low, varying from 23.0 to 62.1%3-5.
individual corresponds to and agrees with the therapeutic recommendations made by a health professional5. Behavioral risk factors constitute the
main targets of hypertension prevention and treatment because when corrected, they effectively reduce blood pressure and its complications. The main non-pharmacological recommendations to prevent primary hypertension are: losing weight, reducing salt and alcohol intakes, quitting smoking, practicing physical activity regularly, and eating healthy1,6-8.
Community-based intervention programs that associate health promotion with disease prevention have been conducted in different countries since the early 1970s. The objective of these programs is to reduce NCD morbidity and mortality by providing community health education, thereby reducing NCD-associated risk factors. These programs have had different levels of impact on hypertension risk factors9.
Health education strategies are an important instrument for encouraging lifestyle changes and reducing cardiovascular risk factors. Education reduces blood pressure, body weight, and waist circumference; and improves lipid profile, blood glucose, habitual food intake, and knowledge about the health-disease-care process8,10.
In agreement with the WHO recommen-dations, the Strategic Action Plan against NCD launched in Brazil (2011-2022) recommends controlling hypertension using health promotion and protection policies in Primary Health Care5,6.
In order to increase adherence, Primary Health Care must develop educational activities that promote care and increase the effectiveness of lifestyle modification processes7. In this sense, the
objective of the present study was to assess adherence to a non-pharmacological treatment of hypertension by measuring anthropometric, biochemical, clinical, and dietary parameters before and after three health and nutrition education strategies.
M E T H O D S
This longitudinal clinical trial was conducted at a Primary Health Care unit located in the urban area of a small municipality from July 2012 to July 2013.
The sample consisted of 212 individuals formally diagnosed with hypertension and followed by the Hiperdia Program. The participants agreed to participate in the study. All participants were taking antihypertensive medications. The inclusion criteria were: age of 18 years or more; presence of hypertension; not receiving nutritional follow-up; and availability to participate in group activities. The exclusion criteria included possible confounders, such as pregnancy, severe clinical conditions such as dementia, advanced multiple sclerosis, blindness, deafness, active tuberculosis, disabling paralysis, and a history of alcohol or illicit drug abuse.
The study health education model was based on criteria of interactivity, dialogue, and problematization of reality experienced by the participants that help them fight non-adherence to treatment11. All interventions involved active
education methods that opened critical, participative, and co-responsibility spaces between Primary Health Care users and health teams. The workshops, which lasted approximately one hour each, were held once a month at the Primary Health Care facility and used different teaching resources, such as posters, videos, and hands-on cooking demonstrations, with active pupil participation. Monthly home visits lasting roughly 45 minutes were scheduled with the participants in advance. The home visits had a systematized plan, and practical advice was shaped to the reality of each family by checking the acquired food items and how they were prepared and consumed. The workshops and home visits were planned and made by two research dieticians. The program content was based on Cervatto12.
Group 1: Monthly workshops to educate and prevent diseases, emphasizing on dietary hypertension therapy using participative and interlocutory educational activities. The group consisted of individuals who attended at least eight group workshops.
Group 2: Monthly workshops and home visits. The home visits were made during the main daily meal and followed a systematic nutrition education plan. The group consisted of 21 individuals chosen randomly. The sample size was defined in advance for home visit feasibility.
Group 3: Monthly workshops to educate and prevent diseases, as in Group 1. The group consisted of individuals who attended fewer than eight group workshops spontaneously.
The participants were allocated to these three groups based on the number of workshops they attended and/or whether they received home visits. The lowest acceptable workshop attendance (n=8) was given by the median attendance and the results obtained by Ribeiro et al.8, who found
that five months of intervention were not enough for participants to incorporate long-term changes in health and eating behaviors. Based on this
criterion, individuals were allocated to groups 1 or 3 after the intervention.
Socioeconomic and lifestyle data were collected during individual interviews before the intervention. Anthropometric and biochemical variables, systolic and diastolic blood pressures, and physical activity and habitual food intake data were collected before and after the interventions. Smoking status was considered positive if the individual self-reported as a smoker at the time of the interview. Individuals were considered alcohol users if they had consumed alcohol in the last 30 days, regardless of amount.
Weight was measured by the electronic scale Marte® (MarteCientífica, São Paulo, Brazil)
with a capacity of 199.95 kg and accuracy of 50 g; height was measured by the platform stadiometer
Alturexata® (Belo Horizonte, Minas Gerais, Brazil)
with a length of 213 cm and vertical accuracy of 1 mm, as recommended by Jelliffe13. Body Mass
Index (BMI) was calculated and classified as
recommended by the WHO for adults14 and by
Lipschitz15 for older adults. Waist circumference
was measured at the midpoint between the iliac crest and the lowest rib upon exhalation using
Chart 1. Composition of the groups and workshops on health education for hypertensive individuals. Brazil, 2014.
1.
2.
3.
4.
5.
6.
7.
8.
9.
10.
11.
12.
Hypertension: Concept, risk factors, and dietary treatment measures Brazilian Food Pyramid
Health: Changing health habits from (dis)information to awareness - promoting adherence
Intake of fat/oil and sugar: recommendation and dangers of excessive intake, processed and ultra-processed foods Sodium intake: Recommendation and dangers of excessive intake; how to prepare the “herb salt”
Intake of fruits, vegetables, and legumes; ways of preparing these foods
Reinforce the advice given in the previous workshops, clarify doubts, and discuss the next subjects according to the group’s need and interest
Food labeling: Understanding and interpreting labels Dietary information and advice disseminated by the media Food away from home/how to make a healthy eating plate
Discussion about how to solve hypertension-related problems raised by the participants
Reflection about the main dietary changes made by the participants and their families, sharing the personal achievements of the group
Workshops Workshop content
an inelastic tape and classified according to the cut-off points proposed by the WHO16.
Laboratory tests included total cholesterol and fractions (Low Density Lipoprotein -cholesterol [LDL-c], high density lipoprotein, and very low density lipoprotein), triglycerides, and fasting blood glucose. The participants were asked to fast for 12 hours before blood collection. The laboratory reference techniques and criteria were used for quantifying and classifying the results. Biological material collection and analysis were performed at a laboratory certified by the Ministry of Health. Blood was collected by venipuncture. The quantifications were made by the equipment A15 (Biosystems®, Curitiba, Paraná, Brazil)
according to the automation protocol of the abovementioned laboratory kit. Blood pressure was measured during the workshops indirectly using auscultation and the aneroid
sphygmo-manometer (Premium®, Accumed, Duque de
Caxias, Rio de Janeiro, Brazil). Two measurements
were made at a one-minute interval. Blood pressure was classified according to the procedures and parameters provided by the “VI Brazilian Guidelines on Hypertension”1.
Habitual food intake was investigated to determine per capita oil, salt, and sugar intakes.
The daily per capita amounts were given by
estimating the monthly household consumption of these items and dividing the estimate by the number of days in the month and household members.
The level of physical activity was estimated by the short version of the International Physical Activity Questionnaire created by the WHO, and translated into Brazilian Portuguese and validated for Brazil by Matsudo et al.17. Individuals who
practiced a total of at least 30 minutes of moderate physical activity a day in five or more days a week were considered active.
The data were analyzed by the programs Statistical Package for the Social Sciences (SPSS Inc., Chicago, Illinois, United States) for Windows, version 20.0 and Excel 2010 (Microsoft Coporation, Redmond, Washington, United States). The descriptive analysis of the quantitative
variables included measures of central tendency (mean) and variability (standard deviation). The Kruskal-Wallis test measured homogeneity between the groups. The Kolmogorov-Smirnov test determined whether the variables had normal distribution. The variables with and without normal distribution were compared by the paired t test and Wilcoxon test (nonparametric variables), respectively. The significance level was set at 5% (p<0.05).
The study was approved by the Research Ethics Committee of the Universidade Federal de
Viçosa under Protocol nº 044/2012/CEPH, in
agreement with Resolution nº 466/2012 of the National Health Council.
R E S U L T S
Eighty (27.0%) out of the 292 study participants dropped out; of these, 65 (22.0%) did not spontaneously participate in the second stage of the study; 6 (2.0%) died; 4 (1.3%) moved to another municipality; and 5 (1.7%) developed a disabling illness. Hence, the 212 individuals that composed the final sample represented 31.0% of the municipal hypertensive population. The mean age was 66.94 years (minimum age of 29 years and maximum age of 90 years, Standard Deviation-SD=±11.29). Most participants were females (75.5%), and had low education level (84.0%) and low income (84.2%).
Table 1 shows the demographic and socioeconomic characteristics of the study sample according to the intervention groups. The groups did not differ significantly: all groups were homogeneous with respect to the baseline characteristics. Therefore, the three groups had similar demographic and socioeconomic characteristics. Most individuals were female older adults or adults aged 30 to 59 years; were married, retired, or pensioners; had never smoked; had fewer than four years of formal education; and had an income of 1 to 3 minimum salaries
per month. Most participants with income
Table 1. Demographic and socioeconomic characteristics of hypertensive individuals who participated in three types of intervention (Groups 1, 2, and 3). Brazil, 2014.
Sex
Female Male
Age group (years)
Up to 30 years old 30-60 years old 61 or more years old
Marital status Married Widowed Separated Single Education level Illiterate
1-4 years of formal education 5-8 years of formal education 9-11 years of formal education 12 or more years of formal education
Occupation Retired/pensioner Homemaker Formally employed Informally employed Rural worker
Income (minimum salaries)
Less than 1 1-3 3 or more Did not know
Contributes to income
Yes No
Did not know
Home ownership status
Owner Tenant
Number of household members
Lives alone Up to 5 members 6 or more members
Smoking status
Has never smoked Smoker Ex-smoker Alcohol user Yes No Variables 74 27 2 25 74 66 28 5 2 25 60 5 8 3 69 18 5 6 3 2 83 12 4 82 9 10 2 9 12 81 8 62 11 28 16 85 73.3 26.7 02.0 24.8 73.3 65.0 28.0 05.0 02.0 24.6 59.4 05.0 08.0 03.0 68.3 17.8 04.9 06.0 03.0 02.0 82.2 11.9 03.9 81.0 08.9 10.1 91.0 09.0 11.9 80.1 08.0 61.4 10.9 27.7 15.9 84.1 Group 1 n % 16 5 0 6 15 15 5 1 0 3 15 3 0 0 15 3 2 1 0 2 18 1 0 21 0 0 20 1 2 15 4 13 2 6 18 3 076.2 023.8 000.0 028.6 071.4 001.4 023.8 004.8 000.0 014.3 071.4 014.3 000.0 000.0 071.4 014.3 009.5 004.8 000.0 009.5 085.7 004.8 000.0 100.0 000.0 000.0 095.2 004.8 009.5 071.4 019.1 061.9 009.5 028.6 085.7 014.3 Group 2 n % 70 20 4 19 67 49 26 8 7 21 52 10 4 3 66 15 6 1 2 6 71 7 6 69 4 17 81 9 12 72 6 64 20 6 68 22 077.7 022.3 004.4 021.1 074.5 054.4 028.8 008.8 008.0 023.3 057.7 011.1 004.4 003.5 073.4 016.7 006.7 001.0 002.2 006.7 078.9 007.7 006.7 076.7 004.4 018.9 090.0 010.0 013.3 080.0 006.7 071.1 022.2 006.7 075.5 024.5 Group 3 n % 0.527 1.253 0.700 0.305 0.348 2.714 2.890 0.504 0.591 2.509 2.148 Z-score 0.768 0.534 0.965 0.853 0.840 0.257 0.236 0.777 0.744 0.285 0.342 p*
The percentage of alcohol users varied: Groups 2 and 3 had a higher percentage of individuals who reported having consumed alcoholic beverages in the last 30 days, regardless of amount (85.7 and 75.5%, respectively), but the differences were not significant.
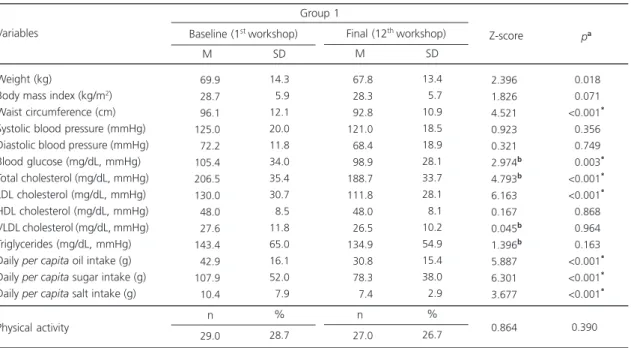
Tables 2, 3, and 4 shows the anthropometric, blood pressure, biochemical, dietary, and physical activity data of Groups 1, 2, and 3 before and after the intervention. Regarding anthropometric variables, Group 1 lost a mean of 3.3 cm of waist circumference, a significant difference. The following biochemical parameters also decreased significantly: fasting glucose (105.4 mg/dL to 98.9 mg/dL), total cholesterol (206.5 mg/dL to 188.7 mg/dL), and LDL-c (130 mg/dL to 111 mg/dL). All dietary variables also decreased significantly: percapita oil intake had a mean decrease of 12.1 mL; per capita sugar
intake had a mean decrease of 30 g; and per
capita salt intake decreased from 10.4 g to 7.4 g.
Regarding physical activity, only 28% of the group
was considered active and the intervention did not promote any change.
Group 2 also saw reductions in all their anthropometric variables. They lost an average of 4.4 cm of waist circumference. Their biochemical parameters also decreased significantly: fasting glucose from 112.3 mg/dL to 101 mg/dL; total cholesterol from 204.8 mg/dL to 185.2 mg/dL; and LDL-c from 124.7 mg/dL to 110 mg/dL. Triglyceride levels also decreased on average 28.0 mg/dL, but the reduction was not significant.
Per capita oil intake decreased by 11 mL, also not
significant. The percentage of physically active individuals decreased with the intervention, but not significantly.
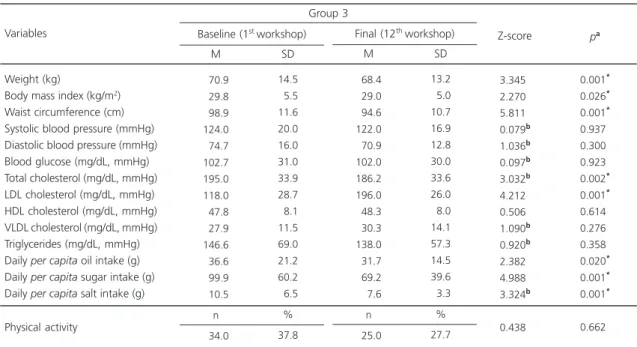
Group 3 experienced significant reductions in the following variables: weight, BMI, and waist circumference. However, of the biochemical parameters, only total cholesterol decreased (195 mg/dL to 186 mg/dL). LDL-c had a mean significant increase of 78 mg/dL. The dietary
Table 2. Anthropometric, blood pressure, biochemical, dietary, and level of physical activity characteristics of Group 1 before and after the intervention. Brazil, 2014.
Weight (kg)
Body mass index (kg/m2) Waist circumference (cm) Systolic blood pressure (mmHg) Diastolic blood pressure (mmHg) Blood glucose (mg/dL, mmHg) Total cholesterol (mg/dL, mmHg) LDL cholesterol (mg/dL, mmHg) HDL cholesterol (mg/dL, mmHg) VLDL cholesterol (mg/dL, mmHg) Triglycerides (mg/dL, mmHg) Daily per capita oil intake (g) Daily per capita sugar intake (g) Daily per capita salt intake (g) Variables
069.9
028.7
096.1 125.0
072.2 105.4 206.5 130.0
048.0
027.6 143.4
042.9 107.9
010.4
n
029.0
14.3
05.9 12.1 20.0 11.8 34.0 35.4 30.7
08.5 11.8 65.0 16.1 52.0
07.9
% 28.7 Baseline (1stworkshop)
M SD
067.8
028.3
092.8 121.0
068.4
098.9 188.7 111.8
048.0
026.5 134.9
030.8
078.3
007.4
n
027.0
13.4
05.7 10.9 18.5 18.9 28.1 33.7 28.1
08.1 10.2 54.9 15.4 38.0
02.9
%
26.7 Final (12thworkshop)
M SD
Group 1
2.396b
1.826b
4.521b
0.923b
0.321b
2.974b
4.793b
6.163b
0.167b
0.045b
1.396b
5.887b
6.301b
3.677b
0.864b
<0.018*
<0.071*
<0.001*
<0.356*
<0.749*
<0.003*
<0.001*
<0.001*
<0.868*
<0.964*
<0.163*
<0.001*
<0.001*
<0.001*
<
0.390*
Z-score pa
Note:ap-value for the difference of the values before and after the intervention for Group 1 according to the paired t test or bWilcoxon test at a
significance level of 5%. *Statistically significant value.
Table 3. Anthropometric, blood pressure, biochemical, dietary, and level of physical activity characteristics of Group 2 before and after the intervention. Brazil, 2014.
Weight (kg)
Body mass index (kg/m2) Waist circumference (cm) Systolic blood pressure (mmHg) Diastolic blood pressure (mmHg) Blood glucose (mg/dL, mmHg) Total cholesterol (mg/dL, mmHg) LDL cholesterol (mg/dL, mmHg) HDL cholesterol (mg/dL, mmHg) VLDL cholesterol (mg/dL, mmHg) Triglycerides (mg/dL, mmHg) Daily per capita oil intake (g) Daily per capita sugar intake (g) Daily per capita salt intake (g) Variables 073.6 030.0 098.5 117.0 070.6 112.3 204.8 124.7 044.8 030.1 173.5 041.2 088.3 008.7 n 7.0 18.7 07.3 14.0 14.8 11.6 06.0 39.0 32.0 06.2 13.4 96.0 22.1 49.3 04.8 % 33.3 Baseline (1stworkshop)
M SD 071.2 028.6 094.1 119.0 069.5 101.0 185.2 110.1 047.5 030.0 146.0 030.0 081.0 008.4 n 04.0 17.8 06.7 12.2 18.0 16.0 18.0 37.0 31.0 06.8 14.0 61.6 13.1 50.4 07.3 % 19.0 Final (12thworkshop)
M SD Group 2 3.024b 2.763b 2.964b 0.203b 0.241b 2.870b 2.033b 2.053b 0.941b 0.597b 1.130b 1.476b 1.177b 1.036b 1.547b
<0.002*
<0.006*
<0.003*
<0.839*
<0.809*
<0.004*
<0.042*
<0.040*
<0.343*
<0.550*
<0.259*
<0.140*
<0.239*
<0.300*
<0.122*
Z-score pa
Note:ap-value for the difference of the values before and after the intervention for Group 2 according to the paired t test or bWilcoxon test at a
significance level of 5%. *Statistically significant value.
M: Mean; SD: Standard Deviation; LDL: Low-Density Lipoprotein; HDL: High-Density Lipoprotein; VLDL: Very Low-Density Lipoprotein.
Table 4. Anthropometric, blood pressure, biochemical, dietary, and level of physical activity characteristics of Group 3 before and after the intervention. Brazil, 2014.
Weight (kg)
Body mass index (kg/m2) Waist circumference (cm) Systolic blood pressure (mmHg) Diastolic blood pressure (mmHg) Blood glucose (mg/dL, mmHg) Total cholesterol (mg/dL, mmHg) LDL cholesterol (mg/dL, mmHg) HDL cholesterol (mg/dL, mmHg) VLDL cholesterol (mg/dL, mmHg) Triglycerides (mg/dL, mmHg) Daily per capita oil intake (g) Daily per capita sugar intake (g) Daily per capita salt intake (g) Variables 070.9 029.8 098.9 124.0 074.7 102.7 195.0 118.0 047.8 027.9 146.6 036.6 099.9 010.5 n 034.0 14.5 05.5 11.6 20.0 16.0 31.0 33.9 28.7 08.1 11.5 69.0 21.2 60.2 06.5 % 37.8 Baseline (1stworkshop)
M SD 068.4 029.0 094.6 122.0 070.9 102.0 186.2 196.0 048.3 030.3 138.0 031.7 069.2 007.6 n 025.0 13.2 05.0 10.7 16.9 12.8 30.0 33.6 26.0 08.0 14.1 57.3 14.5 39.6 03.3 % 27.7 Final (12thworkshop)
M SD Group 3 3.345b 2.270b 5.811b 0.079b 1.036b 0.097b 3.032b 4.212b 0.506b 1.090b 0.920b 2.382b 4.988b 3.324b 0.438b 0.001* 0.026* 0.001* 0.937* 0.300* 0.923* 0.002* 0.001* 0.614* 0.276* 0.358* 0.020* 0.001* 0.001* 0.662*
Z-score pa
Note:ap-value for the difference of the values before and after the intervention for Group 3 according to the paired t test or bWilcoxon test at a
significance level of 5%. *Statistically significant value.
M: Mean; SD: Standard Deviation; LDL: Low-Density Lipoprotein; HDL: High-Density Lipoprotein; VLDL: Very Low-Density Lipoprotein. Physical activity
variables also presented significant differences: mean per capita oil, sugar, and salt intakes decreased by 5 mL, 30 g, and 3 g, respectively. Regarding physical activity, this group had a higher percentage of active individuals than Groups 1 and 2 (37.8%). After the intervention this percentage decreased to 27.7%, but the difference was not significant.
D I S C U S S I O N
The study results show that the educational interventions increased adherence to non-pharmacological hypertension treatment, as evidenced by anthropometric (weight, Body Mass Index, and waist circumference), biochemical (blood glucose, total cholesterol, and LDL-c), and dietary (mean per capita intakes of oil, sugar, and salt) parameters. It is consensus that structured health education programs for hypertension patients improve their health conditions, including risk factors and adherence to the recommended
treatment7,18. Studies that analyzed the
effectiveness of educational interventions in hypertension individuals found that education programs improved their behavior and adherence to non-pharmacological treatment considerably8,19,20.
However, the reluctance of patients and health professionals to believe in the effectiveness of health education actions for a number of reasons is also discussed, such as: the method used, which is often prescriptive, normative, and out of context with respect to the population’s reality; the
trumping of professional knowledge over popular knowledge and of clinical practice over promotive and preventive actions; the tendency of health actions to be fragmented, disarticulated, and not multidisciplinary; and the population’s little interest in changing life habits19-22.
The socioeconomic characteristics of the study population were similar to those of other samples, where most participants in educational activities provided by Primary Health Care services are female older adults, have low education level
and income, and are retired or pensioners8,19. In
face of the current demographic, epidemiological, and nutritional transitions, and the increase in life expectancy and prevalence of NCD, the health care provided by Primary Health Care needs to be reassessed, prioritizing actions that meet individuals’ needs and that help them to adopt healthy habits23. Regarding life habits, only Group
3 had a higher proportion of smokers (22.0%) than the national mean (11.3%)24. On the other
hand, the proportions of individuals in Groups 2 and 3 who had consumed alcohol in the last thirty days were higher than those reported by other studies21,22,25.
Obesity is closely related to hypertension. There is a positive and linear relationship between BMI and blood pressure. It is estimated that each
1.25 kg/m2 increase in BMI in women and
1.70 kg/m2 in men increase systolic blood pressure
by 1 mmHg. Likewise, a body weight loss of 10 kg can reduce systolic blood pressure by 5-20 mmHg. Another factor that influences blood pressure is body fat distribution. A waist circumference increase of 2.5% in men and 4.5% in women is estimated to increase systolic blood pressure by 1 mmHg26. High waist circumference is a risk factor
for metabolic and cardiovascular diseases, even when BMI is appropriate27.
Regarding anthropometric parameters, all groups lost weight, BMI, and waist circumference. Only Group 1 had significant waist circumference reduction. Groups 2 and 3 had significant weight, BMI, and waist circumference reductions. The better results achieved by Group 2 are justified by their participation in educational workshops and home visits, which intensify the intervention. Home visits allow focusing educational practice on the difficulties faced by the participants and their families, contributing to adherence to treatment and maintenance of healthy habits20. Meanwhile in Group 3, anthropometric
Studies have observed how challenging it is for hypertension patients to control their blood pressure, even when receiving primary care follow-up28,29. In the present study, mean systolic
and diastolic blood pressure did not change significantly, remaining close to 120/80 mmHg, a result similar to that of another educational intervention study30.
Groups 1 and 2 experienced significant reductions in blood glucose, total cholesterol, and LDL-c. A five-month study that compared two intervention strategies found that only blood glucose improved among individuals who received home visits8. The results of interventions that aim
to change habits depend on intervention frequency and type, whether individual or group31.
The 12-month interventions of the present study may have contributed to the positive results of the group that attended the most workshops and the group that attended workshops and received home visits.
The study interventions were capable of
promoting favorable changes in the mean per
capita intakes of oil, sugar, and salt in all groups.
However, the per capita intakes of these food items are still above the intakes recommended for the Brazilian population. Oil intake should not exceed 16 mL per capita31. Hence, the per capita
intake of soybean oil was twice the recommended amount, and this did not take into account the intake of other oils, fats, and respective sources throughout the day. The present results regarding
per capita sugar intake are in agreement with a
study that estimated the sugar intake of the Brazilian population, which found that intake was excessive, exceeding by more than 60% the
maximum amount recommended by the WHO32.
The current recommendation is that calories from sugar should not exceed 10% of the daily calorie intake in a healthy diet. More health benefits can be achieved if daily intake of calories from sugar does not exceed 5% of the daily calorie intake (roughly 25 g of sugar a day). The WHO recommendation regards all types of sugar (sucrose, glucose, and fructose), and their sources, such as refined sugar, honey, fruit juices, fruit pulps, and sugar added to commercially processed
foods. Salt intake also exceeds the recommended amount, which is of less than 5 g of salt/day, and
confirms the national mean33. Even if the
reduction in the mean per capita intake of these food items is inadequate, this reduction is enough to improve many conditions related to hyper-tension risk factors, such as dyslipidemia and glucose intolerance26. Although one cannot infer
that these intake changes resulted exclusively from the educational interventions, the results show that the interventions promoted positive dietary changes. Thus, since eating behavior changes slowly and gradually, ongoing educational strategies may be required for long-term changes.
Increasing the prevalence of physical activity is one of the goals of many foreign guidelines for preventing diseases and promoting health3,5. Considering the study classification
criteria, most participants did not reach the recommended levels of physical activity needed to improve health1. Studies have found that
inactivity is common among hypertension patients25,34. Additionally, most of the study
participants were older adults, with very ingrained habits, and physical and functional age-related limitations that require the planning of physical activity programs that meet their particularities.
In the present study, regular intervention over 12 months allowed focusing attention on the specific difficulties experienced by each group and promoted a bond between the researcher and the participants. The emancipatory health education approach tried to widen the subjects’
critical view to facilitate the means by which they can best care for their health, integrating their values and customs. Therefore, as in all NCD, hypertension treatment requires ongoing motivation for the patient not to abandon the treatment because it establishes a relationship of trust, dialogue, and respect20.
One limitation is that assessment of adherence to non-pharmacological hypertension treatment is a complex process and its effectiveness depends on factors that include individuals’
cultural influences, and health-related beliefs. All these factors along with the intervention may have contributed to the improvement of the study parameters. The subtle differences in the impact of the interventional modalities may reflect characteristics of the study population or result from a possible sampling bias because this was an uncontrolled intervention study. A control group was not included for ethical reasons. Finally, adherence to hypertension treatment imposes the challenge of reconsidering the educational strategies developed in Primary Health Care to improve health outcomes.
C O N C L U S I O N
Adherence to non-pharmacological hypertension treatment is a challenge for health systems because it occurs in the medium and long run and depends on individuals’ efforts and support from health professionals. The present study evidenced that educational interventions increase adherence to non-pharmacological hypertension treatment as evidenced by the following parameters: anthropometric (weight, BMI, and waist circumference), biochemical (blood glucose, total cholesterol, and LDL-c), and dietary (mean per capita intakes of oil, sugar, and salt). The interventions over 12 months and the educational method may have contributed to these findings.
Hence, organization of integrated and ongoing educational actions for the non-pharmacological treatment of hypertension is justified by recent pieces of evidence, namely, that the combination of nutrition education, regular physical activity, and healthy behaviors reduces the morbidity and mortality caused by hypertension.
C O L L A B O R A T O R S
JC MACHADO helped to conceive and plan the study, analyze the data, and develop other stages of article writing. RMM COTTA helped to plan the study and review the manuscript. TR MOREIRA helped to plan the study and analyze the data. LS SILVA helped to analyze the data and create a draft.
R E F E R E N C E S
1. Sociedade Brasileira de Cardiologia, Sociedade Brasileira de Hipertensão, Sociedade Brasileira de Nefrologia. VI Diretrizes Brasileiras de Hipertensão. Arq Bras Cardiol. 2010; 95(1 Suppl. 1):1-51. 2. Goulart FAA. Doenças crônicas não transmissíveis:
estratégias de controle e desafios e para os sistemas de saúde. Brasília: Ministério Saúde; 2011. 3. World Health Organization. Adherence to
long-term therapies: Evidence for action. Technical Report Series, nº 916. Geneva: WHO; 2003. 4. Silva LS, Cotta RMM, Rosa COB. Estratégias de
promoção da saúde e prevenção primária para enfrentamento das doenças crônicas: revisão sistemática. Rev Panam Salud Pública. 2013; 34(5):343-50.
5. World Health Organization. 2008-2013 action plan for the global strategy for the prevention and control of noncommunicable diseases: Prevention and control cardiovascular diseases, cancers, chronic respiratory diseases and diabetes. Geneva: WHO; 2008.
6. Brasil. Ministério da Saúde. Secretaria de Vigilância em Saúde. Plano de ações estratégicas para o enfrentamento das Doenças Crônicas Não Transmissíveis (DCNT) no Brasil 2011-2022. Brasília: Ministério da Saúde; 2011.
7. Mendes EV. O cuidado das condições crônicas na atenção primária à saúde: o imperativo da consolidação da estratégia da saúde da família. Brasília: Organização Pan-Americana da Saúde; 2012.
8. Ribeiro AG, Ribeiro SMR, Dias CMGC. Non pharmacological treatment of hypertension in primary health care: A comparative clinical trial of two education strategies in health and nutrition. BMC Public Health. 2011; 11:637. http://dx.doi.org/ 10.1186/14 71-2458-11-637
9. Silva LS, Cotta RMM, Rosa COB. Estratégias de promoção da saúde e prevenção primária para enfrentamento das doenças crônicas: revisão sistemática. Rev Panam Salud Pública. 2013; 34(5):343-50.
10. Tobe SW, Moy Lum-Kwong M, Von Sychowski S, Kandukur K, Kiss A, V Flintoft V. Hypertension management initiative prospective cohort study: Comparison between immediate and delayed intervention groups. J Hum Hypertens. 2014; 28:44-50. http://dx.doi.org/10.1038/jhh.2013.48 11. Freire P. Pedagogia da autonomia. São Paulo: Paz e
Terra; 2003.
13. Jelliffe DBI. Evaluacíon del estado de nutricíon de la comunidade. Genebra: WHO; 1968.
14. World Health Organization. Physical status: The use and interpretation of anthropometry. Report of WHO Expert Committee. Technical Report Series, nº 854. Geneva: WHO; 1995.
15. Lipschitz DA. Screening for nutritional status in the elderly. Primecare. 1994; 21(1):56-67.
16. World Health Organization. Health promotion evaluation: Recommendations to policymakers. Report of the WHO European Working Group on Health Promotion Evaluation. Copenhagen: WHO; 1998.
17. Matsudo SM, Araújo TL, Matsudo VKR, Andrade DR, Andrade EL, Oliveira LC, et al. Questionário Internacional de Atividade Física (IPAQ): estudo de validade e reprodutibilidade no Brasil. Rev Bras Ativ Saúde. 2001; 6(2):5-18.
18. Pearson TA, Palaniappan LP, Artinian NT, Carnethon MR, Criqui MH, Daniels SR, et al. American Heart Association guide for improving cardiovascular health at the community level, 2013 update: A scientific statement for public health practitioners, healthcare providers, and health policy makers. Circulation. 2013; 127(16):1730-53. http://dx.doi. org/10.1161/CIR.0b013e31828f8a94
19. Oliveira TL, Miranda LP, Fernandes OS, Caldeira AP. Eficácia da educação em saúde no tratamento não medicamentosos da hipertensão arterial. Acta Paul Enferm. 2013; 26(2):179-84. http://dx.doi.org/10. 1590/S0103-21002013000200012
20. Ribeiro AG, Cotta RMM, Silva LS, Ribeiro SMR, Dias CMGC, Mitre SM, et al. Hipertensão Arterial e orientação domiciliar: o papel estratégico da saúde da família. Rev Nutr. 2012; 25(2):271-82. http:// dx.doi.org/10.1590/S1415-52732012000200009 21. Pierin AMG, Marroni SM, Taveira LAF, Bensenor IJM. Controle da hipertensão arterial e fatores as-sociados na atenção primária em Unidades Básicas de saúde localizadas na Região Oeste da cidade de São Paulo. Ciênc Saúde Colet. 2011; 16(Suppl. 1): 1389-400. http://dx.doi.org/10.1590/S1413-8123 2011000700074
22. Carvalho ALM, Leopoldino RWD, Silva JEG, Cunha CP. Adesão ao tratamento medicamentosos em usuários cadastrados no Programa Hiperdia no município de Teresina (PI). Ciênc Saúde Colet. 2012; 17(7):1885-92. http://dx.doi.org/10.1590/S1413-8 1232012000700028
23. Malta DC, Morais Neto OL, Silva Junior JB. Apresentação do plano de ações estratégicas para o enfrentamento das doenças crônicas não transmissíveis no Brasil, 2011 a 2022. Epidemiol Serv Saúde. 2011; 20(4):425-38. http://dx.doi.org/ 10.5123/S1679-49742011000400002
24. Brasil. Ministério da Saúde. Secretaria de Vigilância em Saúde. Pesquisa Vigitel. Brasília: Ministério da
Saúde; 2013 [acesso 2014 Maio 17]. Disponível em: http://portalsaude.saude.gov.br/images/pdf/ 2014/abril/30/Lancamento-Vigitel-28-04-ok.pdf 25. Oliveira EA, Bubach S, Flegeler DS. Perfil de
hipertensos em uma Unidade de Saúde da Família. Rev Enferm UERJ. 2009; 17(3):383-7.
26. Nadruz Jr W. Hipertensão arterial. In: Cintra DE, Ropelle ED, Pauli JR, organizadores. Obesidade e diabetes: fisiopatologia e sinalização celular. São Paulo: Sarvier; 2011. p.153-69.
27. Veloso HJF, Silva AMM. Prevalência e fatores associados à obesidade abdominal e ao excesso de peso em adultos maranhenses. Rev Bras Epidemiol. 2010; 1(3):400-12. http://dx.doi.org/10.1590/ S0080-62342011000800005
28. Banegas JR, Lopez-Garcia E, Dallongeville J, Guallar E, Borghi C, Massó-Gonzales EL, et al. Achievement of treatment goals for primary prevention of cardiovascular disease in clinical practice across Europe: The EURIKA study. Eur Heart J. 2011; 32(17):2143-52. http://dx.doi.org/10.1093/eurheartj/ ehr0802143-2152
29. Mártires MAR, Costa MAM, Santos CSV. Obesidade em idosos com hipertensão arterial sistêmica. Texto Contexto Enferm. 2013; 22(3):797-803. http://dx. doi.org/10.1590/S0104-07072013000300028 30. Alvarez TS, Zanella MA. Impacto de dois programas
de educação nutricional sobre o risco cardiovascular em pacientes hipertensos e com excesso de peso. Rev Nutr. 2009; 22(1):71-9. http://dx.doi.org/10.15 90/S1415-52732009000100007
31. Brasil. Ministério da Saúde. Guia alimentar para a população brasileira: promovendo a alimentação saudável. Brasília: Ministério da Saúde; 2006. 32. Levy RB, Claro RM, Bandoni BH, Mondini L,
Monteiro CA. Disponibilidade de “açúcares de adição” no Brasil: distribuição, fontes alimentares e tendência temporal. Rev Bras Epidemiol. 2012; 15(1):3-12. http://dx.doi.org/10.1590/S1415-790X2012000100001
33. Sarno F, Claro RM, Levy RB, Bandoni DH, Ferreira SRG, Monteiro CA. Estimativa de consumo de sódio pela população brasileira, 2002-2003. Rev Saúde Pública. 2009; 43(2):219-25.
34. Siqueira FV, Facchini LA, Piccini RX, Tomasi E, Thumé E, Silveira DS, et al. Physical activity in young adults and the elderly in areas covered by primary health care units in municipalities in the South and Northeast of Brazil. Cad Saúde Pública. 2008; 24(1):39-54. http://dx.doi.org/10.1590/S0102-311X2008000100005