Growth achieved and correlation with blood
pressure levels in schoolchildren
Jane Laner Cardoso1 Claudio Leone2
1. Professor of the Department of Public Health of the Federal University of Santa Catarina, Florianópolis, SC, Brasil
2. Full Professor of the Maternal and Child Health Department of Public Health School of the University of São Paulo, São Paulo, SP, Brasil
http://dx.doi.org/10.1590/1806-9282.64.10.896
SUMMARY
INTRODUCTION: The prevalence of systemic arterial hypertension in childhood has increased progressively
OBJECTIVE: To analyze blood pressure and height reached by children in public schools in the South of Brazil.
METHODS: This is a sectional study of a randomized sample of 1,082 students of six to seven and nine to ten years old used to evalu-ate blood pressure and height. Blood pressure levels were classified by percentile for gender, age and stature according to the North American reference of National High Blood Pressure Education Program Working Group on High Blood Pressure in Children and Adolescents.
RESULTS: Schoolchildren presented adequate growth, which was, on average, higher than the WHO reference values. Blood pressure levels were altered in 13.8% of children, with a higher frequency in the nine and ten year olds (17.6%). The isolated analysis of systolic and diastolic Blood pressure revealed a similar trend, with blood pressure levels higher than the greater the value of the Z-score for stature.
CONCLUSION: The schoolchildren in the study evidenced adequate growth and an elevated prevalence of pre-hypertension and arterial hypertension, which tended to be higher in older children and/or those that achieved a greater stature growth.
KEYWORDS: Body Height. Obesity. Arterial Pressure. Child.
DATE OF SUBMISSION: 19-Jan-2018
DATE OF ACCEPTANCE: 20-Jan-2018
CORRESPONDING AUTHOR: Jane Cardoso
Av. Guedner, 1610 - Jardim Aclimação, Maringá - PR, Brasil 87050-900
E-mail: [email protected] INTRODUCTION
Systemic Arterial Hypertension in children has become a point of increasing interest due to its ele-vated prevalence which has been connected, at least partially, to the growth in the prevalence of obesity in children. However, recent evidence suggests that other factors may also be associated with elevated blood pressure (BP), such as a sedentary lifestyle, eating habits and, in particular, the excessive inges-tion of salt 1-6.
Several surveys among American children and adolescents during the periods of 1988–1994 and 1999–2002 have shown a slight mean increase of 1.3 mmHg in systolic arterial pressure, whereas di-astolic blood pressure increased substantially (8.4 mmHg). In the same period, the prevalence of ele-vated blood pressure increased from 2.7% to 3.7%
7,8. Other studies show discrepancies between the
obesity in children and teenagers. A less accentuated increase of arterial pressure means has been verified over the last decade compared to the epidemiologic evolution of obesity 9,10.
In contrast, the proportion of children diagnosed with hypertension during hospitalisation has dou-bled over the last 20 years, indicating that hyperten-sion in children can no longer be considered a diagno-sis to be ‘monitored’, since, in pediatric patients, the disease can have important consequences in terms of clinical manifestations, complexity and global treat-ment cost 11.
In Brazil, it is possible that the same phenome-non is occurring because obesity has increased in a marked manner and has become a major public health problem. The results of the Family Budget Survey, in 2009, revealed that one in three chil-dren aged 5 to 9 years was over their recommended weight 12. The research also showed that, since 1989,
among children of 5–9 years old in families with low incomes, in 20% of these, there was a strong growth in excess weight (8.9% to 26 5%), while in families with higher incomes, the increase was from 25.8% to 46.2% in the same period 3,13.
Considering that the secular growth trend is ob-served in Brazil2 and that height is one of the
param-eters used for the evaluation of blood pressure in children, a change in the burden of the disease due to hypertension is to be expected, including among children.
This makes it relevant to assess the BP and achieved growth, as well as their correlation in chil-dren attending public schools in the capital of Santa Catarina (SC), who are approaching the upper limit of the secular growth trend 14.
The objective of this research was to evaluate the growth of schoolchildren in public schools and their correlation with blood pressure levels.
METHODS
In 2012, a sample of 1,343 children was random-ly selected from the list of classes of schoolchildren supplied by the Public Department of Primary Educa-tion of Santa Catarina State. The initial sample was ob-tained by conglomerate raffling of classes until each of the required had 252 children for analysis by age and sex. From the 1,324 initially sampled children, 1,082 (81.7%) were included in the final sample evaluated: 611 aged 6 or 7 years and 471 aged 9 or 10 years.
Of the 242 excluded children, 229 (17.3% of the initial sample) were outside the age range of the study or had morbid problems known to have a cor-relation with growth or blood pressure, and only 13 (1.0%) were excluded because they did not consent to participate.
Considering a power of 80%, an alpha of 5%, a difference of 1/4 z score on median blood pressure between the groups of age and sex, the sample size estimated as necessary was 252 children per group.
The variables collected were age, gender, blood pressure, stature, and weight. The evaluation of growth and blood pressure took place at the school on scheduled days using standardized instruments for gathering and filing data, always under the re-searcher’s supervision.
One examiner conducted all of the blood pressure measurements. After the child was at rest for five minutes, an aneroid sphygmomanometer was used to measure blood pressure, with cuffs in child sizes (size 15.0 x 6.5 cm), adolescent sizes (dimension 16.0 x 8.0 cm) and adult sizes (dimension 21.5 x 12.0 cm).
The aneroid sphygmomanometer was a Missouri
Mi-katos and had been previously calibrated according to recommended techniques. The BP measures, when altered, were repeated three times on the same day and were obtained the average arterial pressure 15.
Blood pressure levels were individually classi-fied by percentile according to the North American standards for gender, age, and stature15 and were
considered altered (pre-hypertension) when higher than the 90th percentile, and elevated (hypertension) when higher than the 95th percentile.
The values for systolic (SBP) and diastolic arterial pressure (DBP) were analyzed statistically as contin-uous and/or discrete variables. The former (continu-ous) was utilized to calculate the average and stan-dard deviation; the latter was used to categorize BP into two groups: altered BP and adequate BP. The correlation between growth rate and pre-hyperten-sion (higher than the 90th percentile) and arterial hypertension (higher than the 95th percentile), clas-sified as altered BP, was analyzed for all cases.
For height measurements, we used a WISO®
plane horizontal, legs straight, feet together, arms hanging loosely at the sides and heels, calves, but-tocks, shoulder blades and back of the head kept in contact with the flat surface of the wall. Before read-ing the measurement, the child was placed firmly while the spindle stadiometer was placed at the top of the head (vertex)15-17.
For the statistical analysis, we used the SPSS (Sta-tistical Package for the Social Sciences) 15.0, Med-Calc 12.1.4.0 and GraphPad Prism 5.04 software. Fre-quency, proportions, mean, standard deviations (SD), distribution curves and correlation coefficients were calculated.
All the children whose parents or guardians re-fused to consent to participation and those who were outside the age range of the study and/or had morbid problems known to have a correlation with growth and/or blood pressure, were excluded from the study.
The Ethics Research Committee of the Public Health School of the University of São Paulo approved the study in February of 2012, following the ethical principles for research with human beings (National Health Council 196/96).
RESULTS
The sample was divided into two groups accord-ing to age: Group 1 (G1) (six and seven-year-olds) and Group 2 (G2) (nine and ten-year-olds). The proportion of males and females was similar in both groups, and the average age was 6.5 years in the first group, with a standard deviation (SD) of 0.31, and 9.6 years in the second group, with an SD of 0.26 (Table 1).
Figure 1 depicts the distribution of school children, independently of gender and age, according to the
TABLE 1 – DISTRIBUTION OF FREQUENCIES OF
SCHOOLCHILDREN ACCORDING TO GENDER AND AGE GROUP.
Age Group Gender Total n (%)
Male n (%) Femalen (%)
G1 303 (49.6)
(55.4)
308 (50.4) (57.6)
611(100.0) (56.5)
G2 244 (51.8)
(44.6)
227 (48.2) (42.4)
471(100.0) (43.5)
Total 547 (50.5)
(100.0)
535 (49.5) (100.0)
1082 (100.0) (100.0)
-5 -4 -3 -2 -1 0 1 2 3 4 5 0
5 10 15 20 25 30 35 40
Z score of stature
median of the sample
R
el
at
iv
e
F
requenc
y
(%
)
TABLE 2 - DISTRIBUTION OF SCHOOLCHILDREN
ACCORDING TO THE CLASSIFICATION OF THEIR CHANGE IN THE SYSTOLIC BLOOD PRESSURE (SBP) AND DIASTOLIC BLOOD PRESSURE (DBP).
Blood Pressure SAP n (%) DAP n (%)
Prehypertension 36 (34,6)* 38 (48,1)**
Hypertension 68 (65,4)* 41 (51,9)**
Total 104 (100,0) 79 (100,0)
*p=0,018 (statistically significant). **p=0,08891
FIGURE 1 – FREQUENCY OF SCHOOLCHILDREN
ACCORDING TO THE Z-SCORE OF STATURE.
z-score of stature. The group as a whole grew, and the median (0.24) shifted towards the upper reference val-ues. The average z-score of stature for age was 0.23 (SD 1.09) for males and 0.26 for females (SD 1.09), in-dicating a non-significant difference (p = 0.67). In rela-tion to age, the mean of z-score of stature was 0.25 (SD 1.08) in G1 and 0.25 (SD 1.09) in G2, again indicating a non-significant difference (p = 0.989).
The mean systolic blood pressure of the children as a whole was 97.2 mmHg, (95% CI 96.5 to 97.8 mmHg), and the mean diastolic was 61.6 mmHg (95% CI 61.1 to 62.1 mmHg) for the whole group. The preva-lence of pre-hypertension or hypertension was 13.7% (148/1082 children). There was an increase of SBP in 9.5% (104 children) and DBP in 7.3% (79 children) in the group. The proportion (65.4%) of children with systolic hypertension was higher than was the pro-portion (34.6%) with pre-hypertension (p< 0.018). On the contrary, the diastolic pressure showed no statis-tically significant difference between the proportions of pre-hypertension and hypertension (Table 2).
A statistically significant correlation was also ob-served with SBP or DBP and the z-score for stature when the analysis was stratified by age group (Table 4), and the comparison of correlation coefficients between the two age groups did not show statistical significance.
The prevalence of higher levels of SBP and DBP was significantly greater in older children, independent of stature. The older age group presented a prevalence ratio of 1.66 when compared to the younger age, a dif-ference that was statistically significant (Table 5).
The presence of changes in blood pressure as a function of height occurred statistically more fre-quently (p = 0.0414) between the half of children with greater height compared to the half of lower height, 15.8% (85/540) and 11.5% (62/542) respectively.
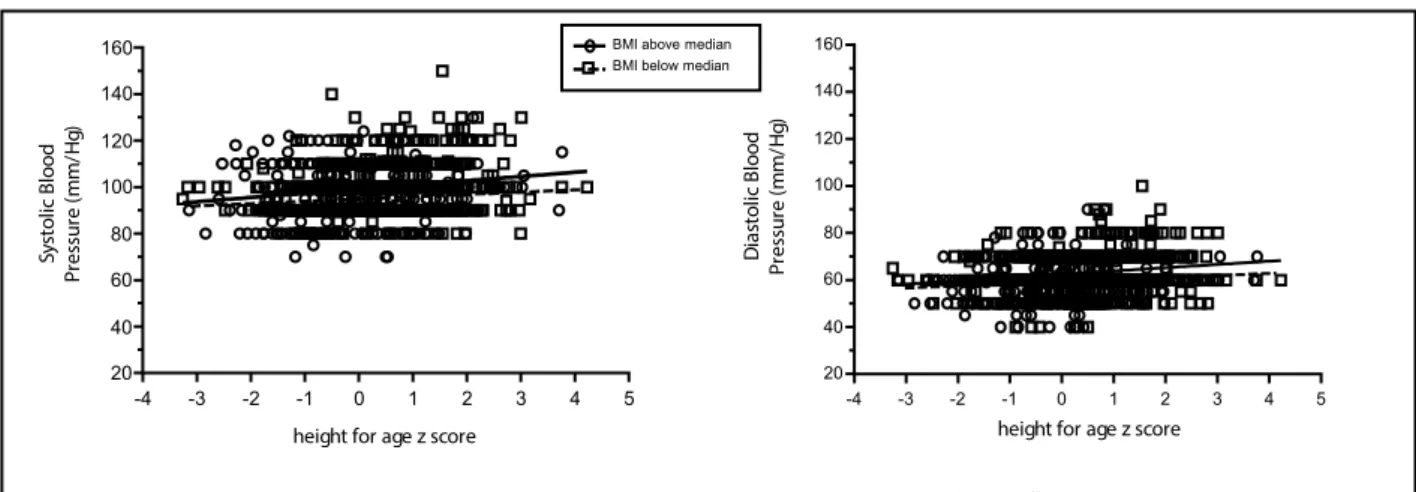
The analysis of the correlation between “blood pressure level (S and D) and height”, Figure 2, was tested both among children of lower zBMI (equal to or less than median zBMI of children in the sample) and higher zBMI (above sample median) including overweight and obesity, and in both the correlation was statistically significant and direct.
DISCUSSION/CONCLUSION
In comparison with the distribution of proposed values by the World Health Organisation in 2007, children attending public schools in Florianopolis in 2012 presented adequate stature growth, indepen-dent of gender or age. Notably, the median stature was higher than the reference values were,
indicat-TABLE 3 – CORRELATION OF SYSTOLIC ARTERIAL
PRESSURE (SBP) AND DIASTOLIC ARTERIAL PRESSURE (DBP) WITH STATURE, ACCORDING TO SEX.
Gender
SAP DAP
r* (CI95%) p r* (CI95%) p Male 0.22(0.14 a 0.30) p<0.0001 0.21(0.14 a 0.30)
p<0.0001 Female 0.16(0.07 a 0.24) p<0.0003 0.13(0.05 a 0.22)
p=0.0021 All 0.19(0.13 a 0.24) p<0.0001 0.18(0.12 a 0.23)
p<0.0001
*r= Pearson Correlation Coefficient
TABLE 4 – CORRELATION OF SYSTOLIC BLOOD
PRESSURE (SBP) AND DIASTOLIC BLOOD PRESSURE (DAP) WITH STATURE, ACCORDING TO AGE GROUP.
Age r* (CI95%) p SAP r* (CI95%) pDAP
G1 0.18(0.10 a 0.25) p<0.0001 0.17(0.10 a 0.25) p<0.0001 G2 0.22(0.14 a 0.31) p<0.0001 0.19(0.10 a 0.27)
p=0.0001
*r= Pearson Correlation Coefficient
-4 -3 -2 -1 0 1 2 3 4 5
20 40 60 80 100 120 140 160
Sy
st
o
lic
B
lood
P
re
ssu
re
(mm/
H
g)
height for age z score
-4 -3 -2 -1 0 1 2 3 4 5 20
40 60 80 100 120 140 160
D
ia
st
o
lic
B
lood
P
re
ssu
re
(mm/
H
g)
height for age z score
BMI above median BMI below median
Pearson Correlation Coefficient: Systolic BP versus Height (score z): BMI above median : 0,18 (p <0,0002 – sig.)
BMI below median: 0,11 (p= 0,0057 – sig.)
Pearson Correlation Coefficient: Diastolic BP versus Height (score z): BMI above median : 0,18 (p <0,0001– sig.)
BMI below median: 0,11 (p= 0,0051 – sig.)
TABLE 5 – DISTRIBUTION OF SCHOOLCHILDREN
ACCORDING TO THE PRESENCE OF PRE-HYPERTENSION OR PRE-HYPERTENSION AND AGE.
Age Normal
Pressure n(%) BP Alterationn(%) Total
G1 546 (89.4) 65 (10.6) 611 (100.0)
G2 388 (82.4) 83 (17.6) 471 (100.0)
Fisher’s Exact Test: p=0.0012 . Relative Risk=1.66 (CI95%= 1.23–2.24)
FIGURE 2- : SYSTOLIC AND DIASTOLIC BLOOD PRESSURE OF SCHOOLCHILDREN VERSUS HEIGHT Z
ing that these children probably had already reached values near the expected growth limit as a result of the secular trend of growth 11,18,19.
Considering that the analysis including over-weight and obesity, in both groups, the SBP and DBP always increases with rising BMI z score, showing an effect probably independent of overweight (figure 2), in this article the option was to analyze the cor-relations of blood pressure with height.
Although the observed systolic and diastolic blood pressure averages were very similar to the reference values 15 an elevated prevalence of arterial
pre-hyper-tension and hyperpre-hyper-tension was verified in comparison with other studies in children 5,8,20.
In relation to age group, a higher prevalence of arterial pre-hypertension or hypertension was ob-served among older school children, independent of gender. In G2, the relative risk of high blood pres-sure was 1.66 times higher compared to G1. The 95% CI (1.23–2.24) shows that the attributable risk of in-creased blood pressure according to age (between six and ten years), at best, is a 23% and at worst a 124% greater risk factor. It suggests that there seems to be an increase in the prevalence of BP alteration with age or, if this is not true, that the reference data, North American, may not be the most appropriate for assessing children of other populations.
The relationship between BP and age, with a high-er prevalence of hyphigh-ertension among oldhigh-er children, is already described in the literature as probably re-lated to hormonal and metabolic changes that occur at the beginning of puberty 21-24.
The fact that our study includes children of nine to ten years of age, meaning that some participants were pre-pubescent or at the beginning of puberty, may
par-tially explain the tendency of elevation of the prevalence of alteration of BP because some studies recognize the association between obesity and early puberty 21,22.
However, this hypothesis regarding the evolution of BP as the normal consequence of the beginning of puberty does not seem to be valid, since it is ev-idenced by several authors that pubescent children with BP alterations present a higher risk of devel-oping cardiovascular diseases (CVD) in adulthood, when compared to smaller pre-pubescent children of nine years of age21,25,26.
Our sample showed a direct correlation between greater stature and BP levels intra-group of age or gender, but as the comparison between groups of age and gender evidenced no difference in growth achieved by the children, a specific influence of the child height growth on BP values is evident, regard-less of gender or age.
With or without the normal phenomena of puber-ty, the detection of elevated blood pressure in school-children should always be the object of special atten-tion, due to the increased risk of CVD that might be present.
In accordance with our results, other studies that showed a correlation of blood pressure with growth and pubertal development observed that there is a relationship between BP elevation rates and growth, also suggesting that growth, as a whole, could influ-ence BP 19,26,27
The results of this study suggest that school-age children who have a height growth greater than the WHO benchmark are subject to a higher risk of pre-hypertension or arterial hypertension, with lev-els that correlate with the achieved height, regard-less of their Body Mass Index.
RESUMO
INTRODUÇÃO: A prevalência de hipertensão arterial sistêmica na infância aumentou progressivamente.
OBJETIVO: Analisar a pressão arterial e a altura alcançada pelas crianças nas escolas públicas do sul do Brasil.
MÉTODOS: Estudo transversal de uma amostra aleatória de 1.082 alunos de 6 a 7 e de 9 a 10 anos de idade, para avaliar a pressão arterial e a altura. Os níveis de pressão arterial foram classificados por percentil segundo gênero, idade e estatura, de acordo com a referência norte-americana do Grupo de Trabalho do Programa Nacional de Estudo em Pressão Arterial sobre a pressão arterial elevada em crianças e adolescentes.
RESULTADOS: Escolares apresentaram crescimento adequado, que foi, em média, superior aos valores de referência da OMS. Os níveis de pressão arterial foram alterados em 13,8% das crianças, com maior frequência aos 9 e 10 anos de idade (17,6%). A análise isolada da pressão arterial sistólica e diastólica revelou uma tendência similar, com níveis de pressão arterial elevados nas crianças com maiores valores de escore Z para a estatura.
CONCLUSÃO: Os escolares no estudo apresentaram um crescimento adequado e uma prevalência elevada de pré-hipertensão e hip-ertensão arterial, que tendem a ser maiores em crianças mais velhas e/ou naquelas que alcançaram maior crescimento de estatura.
REFERENCES
1. Sorof J, Daniels S. Obesity hypertension in children: a problem of epidemic proportions. Hypertension. 2002;40(4):441-7.
2. Schmidt MI, Duncan BB, Azevedo e Silva G, Menezes AM, Monteiro CA, Barreto SM, et al. Chronic non-communicable diseases in Brazil: burden and current challenges. Lancet. 2011;377(9781):1949-61.
3. Kollias A. Hypertension in children and adolescents. World J Hypertens. 2011;1(1):15-9.
4. Moyer VA; U.S. Preventive Services Task Force. Screening for primary hypertension in children and adolescents: U.S. Preventive Services Task Force recommendation statement. Ann Intern Med. 2013;159(9):613-9. 5. Chiolero A, Madeleine G, Gabriel A, Burnier M, Paccaud F, Bovet P.
Prev-alence of elevated blood pressure and association with overweight in chil-dren of a rapidly developing country. J Hum Hypertens. 2007;21(2):120-7. 6. Samuels J. The increasing burden of pediatric hypertension. Hypertension.
2012;60(2):276-7.
7. Freedman DS, Goodman A, Contreras OA, DasMahapatra P, Srinivasan SR, Berenson GS. Secular trends in BMI and blood pressure among children and adolescents: the Bogalusa Heart Study. Pediatrics. 2012;130(1):e159-66. 8. Muntner P, He J, Cutler JA, Wildman RP, Whelton PK. Trends in blood
pressure among children and adolescents. JAMA. 2004;291(17):2107-13. 9. Story M, Stevens J, Himes J, Stone E, Rock BH, Ethelbah B, et al. Obesity
in American-Indian children: prevalence, consequences, and prevention. Prev Med. 2003;37(6 Pt 2):S3-12.
10. Grijalva-Eternod CS, Lawlor, DA, Wells JC. Testing a capacity-load model for hypertension: disentangling early and late growth effects on childhood blood pressure in a prospective birth cohort. PLoS One. 2013;8(2):e56078. 11. Victora CG, Aquino EM, Carmo Leal M, Monteiro CA, Barros FC, Sz-warcwald CL. Maternal and child health in Brazil: progress and challenges. Lancet. 2011;377(9780):1863-76.
12. Brasil. Ministério da Saúde, Ministério do Planejamento, Orçamento e Gestão. Pesquisa de Orçamentos Familiares, 2008-2009: pesquisa de antropometria e estado nutricional de crianças, adolescentes e adultos no Brasil. Rio de Janeiro: Instituto Brasileiro de Geografia e Estatística; 2010. 13. Dietz WH. Overweight in childhood and adolescence. N Engl J Med.
2004;350(9):855-7.
14. Pinheiro AC, Niederauer JM, Vargas DM. Secular trend of growth in stature in Florianópolis in the state of Santa Catarina (Brazil) in relation with the human development index (HDI). Cien Saude Colet. 2014;19(1):227-33.
15. National High Blood Pressure Education Program Working Group on High Blood Pressure in Children and Adolescents. The fourth report on the diagnosis, evaluation and treatment of high blood pressure in children and adolescents. Pediatrics. 2004;114(2 Suppl 4th Report):555-76. 16. World Health Organization. Physical status: the use and interpretation of
anthropometry. Geneva: WHO; 1995.
17. Eveleth PB, Tanner JM. Environmental influence on growth. In: World-wide variation in human growth. 2nd ed. Cambridge: Cambridge University
Press; 1990.
18. World Health Organization (WHO). Obesity. 2016. [Cited 2016 Nov 8]. Available from: http://www.who.int/topics/obesity/en/.
19. Butte, NF, Garza C, Onis M. Evaluation of the feasibility of internation-al growth standards for school-aged children and adolescents. J Nutr. 2007;137(1):153-7.
20. Pinto IC, Arruda IK, Diniz AS, Cavalcanti AM. Prevalence of overweight and abdominal obesity according to anthropometric parameters and the association with sexual maturation in adolescent schoolchildren. Cad Saude Publica. 2010;26(9):1727-37.
21. Falaschetti M, Hingorani AD, Jones A, Charakida M, Finer N, Whincup P, et al. Adiposity and cardiovascular risk factors in a large contemporary population of pre-pubertal children. Eur Heart J. 2010;31(24):3063-72. 22. Durrani AM. Fatima W. Determinants of blood pressure distribution in
school children. Eur J Public Health. 2012;22(3):369-73.
23. Liang Y, Mi J. Pubertal hypertension is a strong predictor for the risk of adult hypertension. Biomed Environ Sci. 2011;24(5):459-66.
24. l’Allemand-Jander D. Clinical diagnosis of metabolic and cardiovascular risks in overweight children: early development of chronic diseases in the obese child. Int J Obes (Lond). 2010;34(Suppl 2):S32-6.
25. Kollias A, Pantsiotou K, Karpettas N, Roussias L, Stergiou GS. Tracking of blood pressure from childhood to adolescence in a Greek cohort. Eur J Public Health. 2012;22(3):389-93.
26. Tu W, Eckert GJ, Saha C, Pratt JH. Synchronization of adolescent blood pressure and pubertal somatic growth. J Clin Endocrinol Metab. 2009;94(12):5019-22.