Fernando C BarrosI Cesar G VictoraII Robert ScherpbierIII Davidson GwatkinIV
I Curso de Pós-Graduação em Saúde e Comportamento. Universidade Católica de Pelotas. Pelotas, RS, Brasil
II Departamento de Medicina Social. Universidade Federal de Pelotas. Pelotas, RS, Brasil
III Department of Child and Adolescent Health. World Health Organization. Geneva, Switzerland
IV Health, Nutrition, Population Department. World Bank. Washington, DC, USA Correspondence:
Fernando C Barros
Universidade Católica de Pelotas R. Marechal Deodoro, 1160, 3º piso 96020-220 Pelotas, RS, Brasil E-mail: fcbarros.epi@gmail.com Received: 11/3/2009 Approved: 11/15/2009
Socioeconomic inequities in the
health and nutrition of children
in low/middle income countries
Iniqüidades sociais na saúde e
nutrição de crianças em países de
renda baixa e média
ABSTRACT
OBJECTIVE: To describe the effects of social inequities on the health and
nutrition of children in low and middle income countries.
METHODS: We reviewed existing data on socioeconomic disparities
within-countries relative to the use of services, nutritional status, morbidity, and mortality. A conceptual framework including fi ve major hierarchical categories affecting inequities was adopted: socioeconomic context and position, differential exposure, differential vulnerability, differential health outcomes, and differential consequences. The search of the PubMed database since 1990 identifi ed 244 articles related to the theme. Results were also analyzed from almost 100 recent national surveys, including Demographic Health Surveys and the UNICEF Multiple Indicator Cluster Surveys.
RESULTS: Children from poor families are more likely, relative to those from better-off families, to be exposed to pathogenic agents; once they are exposed, they are more likely to become ill because of their lower resistance and lower coverage with preventive interventions. Once they become ill, they are less likely to have access to health services and the quality of these services is likely to be lower, with less access to life-saving treatments. As a consequence, children from poor family have higher mortality rates and are more likely to be undernourished.
CONCLUSIONS: Except for child obesity and inadequate breastfeeding
practices, all the other adverse conditions analyzed were more prevalent in children from less well-off families. Careful documentation of the multiple levels of determination of socioeconomic inequities in child health is essential for understanding the nature of this problem and for establishing interventions that can reduce these differences.
DESCRIPTORS: Child. Nutritional Status. Socioeconomic Factors.
Equity in health implies that ideally all individuals should attain their full health potential. Socioeconomic inequities include differences that are “systematic, socially produced (and therefore modifiable) and unfair”.71 Because young children are developing physically and mentally and because they depend on others to ensure their health, they are particularly susceptible to socioeconomic inequities that lead to marked differences in terms of morbidity and mortality.
Globally, most deaths of children under fi ve years of age are caused by a few conditions, namely neonatal causes, pneumonia, diarrhea, malaria, measles and HIV/AIDS,8 with malnutrition being an underlying cause in about a third of these deaths. 9 There are huge
RESUMO
OBJETIVO: Descrever o efeito das iniqüidades sociais sobre a nutrição e saúde de crianças de países de renda baixa e média.
MÉTODOS:Foram revisadas informações disponíveis sobre disparidades
socioeconômicas intra-países, relativas a uso de serviços de saúde, estado nutricional, morbidade e mortalidade. Adotou-se um modelo conceitual com cinco categorias hierárquicas na produção de iniqüidades: contexto e posição socioeconômica, diferenças na exposição, na vulnerabilidade, nos desfechos de saúde e nas conseqüências. Em pesquisa realizada na base PubMed, no período de 1990-2007 foram encontrados 244 artigos relacionados ao tema. Foram também analisados os resultados de cerca de 100 inquéritos de âmbito nacional recentes, incluindo Pesquisas Nacionais de Demografi a e Saúde e Inquéritos por Conglomerados de Múltiplos Indicadores, do Fundo das Nações Unidas para a Infância.
RESULTADOS: Crianças de famílias pobres, em comparação com aquelas de
famílias mais ricas, são mais suscetíveis à exposição a agentes patogênicos; uma vez expostas, têm um risco aumentado de adoecer, devido à sua menor resistência e menor cobertura de medidas preventivas. Uma vez que se tornam doentes, têm menor acesso a serviços de saúde, a qualidade dos serviços que logram utilizar tende a ser inferior, com menor acesso a tratamentos médicos que garantam sua sobrevivência. Como conseqüência, crianças de famílias mais pobres apresentam maiores taxas de mortalidade e maior risco de serem subnutridas.
CONCLUSÕES: Exceto obesidade infantil e práticas inadequadas de
aleitamento materno, todas as outras condições adversas analisadas tiveram maior prevalência entre as crianças de famílias menos favorecidas. A documentação cuidadosa dos múltiplos níveis de determinantes das iniqüidades socioeconômicas em saúde infantil é essencial para o entendimento da natureza do problema, e para o estabelecimento de intervenções que possam reduzir estas diferenças.
DESCRITORES: Criança. Estado Nutricional. Fatores Socioeconômicos.
Desigualdades em Saúde. Países Desenvolvidos. Países em
Desenvolvimento. Epidemiologia Nutricional. Literatura de Revisão como Assunto.
INTRODUCTION
inequities in child undernutrition and mortality between and within countries.8,17 Although under-fi ve mortality rates have recently declined in most low and middle income countries (LMICs), equity analyses have shown that the relative mortality gap is widening, between rich and poor countries and widening within most countries between rich and poor children, because mortality reductions tend to be greater among the better-off.43,65
health-a World Health Organization. Commission on Social Determinants of Health. Priority Public Health Conditions Knowledge Network. Scoping paper: priority public health conditions. Geneva; 2007. [Internet]. [cited 2009 Nov 24]. Available from: http://www.who.int/social_ determinants/resources/pphc_scoping_paper.pdf
related goals”,69 meaning, effective programs take equity considerations into account.
Socioeconomic factors are not the only type of inequities that are relevant to child health. Geographic inequities – for example urban/rural differences – are also relevant, particularly as these affect the availability of health care.24 In addition, the magnitude of socioeconomic inequities is often different in urban and rural areas.24 Cultural factors, such as gender inequities, are important in some societies.65 Although this study will concentrate on socioeconomic inequities, other disparities will be discussed when relevant.
The present article had the objective of describing inequities in the health and nutrition of children under
fi ve years of age living in low and middle income countries.
METHODS
Literature review
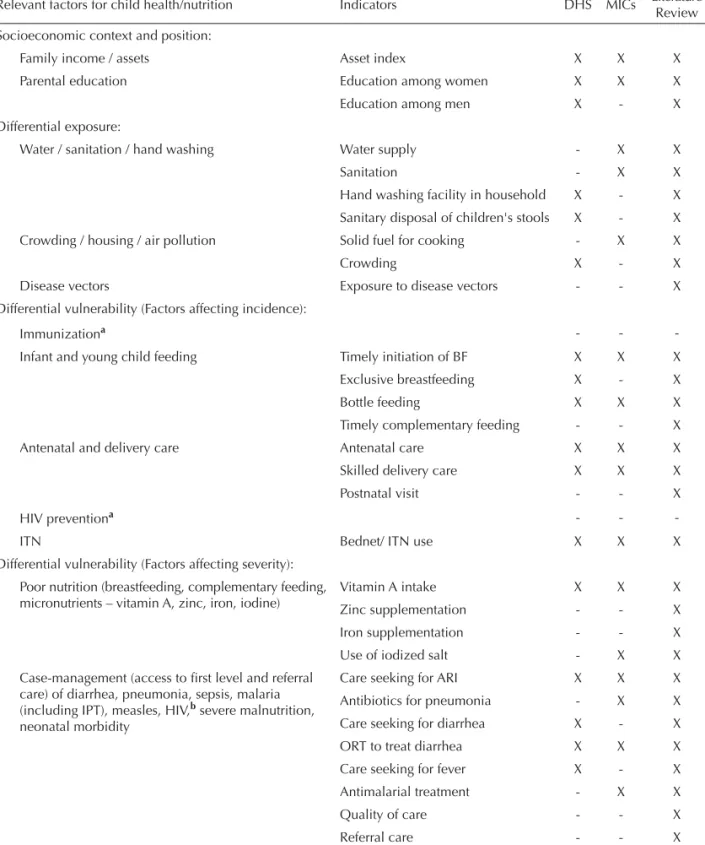
A conceptual model is required to properly understand socioeconomic inequities. We adopted the framework developed by the Commission of Social Determinants of Health (CSDH) Priority Public Health Conditions Knowledge Network (PPHC-KN) (Table 1) that orga-nizes the role of social determinants of health into fi ve major hierarchical categories: socioeconomic context and position, differential exposure, differential vulne-rability, differential health outcomes, and differential consequences.a
Our review starts describing differentials in terms of socioeconomic context and position, differential exposure and vulnerability, as well as access to health services and coverage of health interventions. We then address differentials in child morbidity and nutritional status, and fi nally, we discuss differentials in survival and the long-term consequences of inequities, in terms of human capital.
Throughout this review, in order to understand diffe-rentials between population subgroups through a stratifi cation variable, we have primarily relied on the description of socioeconomic inequities using wealth quintiles based on household assets. We opted for the use of asset quintiles because these are available in a comparable format for almost 100 countries, providing data on dozens of health indicators. These indices are discussed below.
In addition to the analyses of national surveys, a lite-rature review was performed in PubMed Publication years were restricted tothe period 1990-present, except
for classical references such as highly influential articles prepared prior to that date. Several keyword combinations of “socioeconomic factors” or synonyms of terms related to child morbidity, mortality, nutrition, services utilization and coverage were used. The search was restricted to articles from low and middle income countries or global analyses.
All the following search terms were used: Child Behavior Disorders/epidemiology AND Vulnerable Populations; Child Development AND (Socioeconomic Factors OR Social class); Child Health Services/ stan-dards/trends AND (Socioeconomic Factors OR Social class); Child Mortality AND Communicable Disease Control/ methods; Child Mortality AND Poverty; Child Nutrition AND Poverty; Child Nutrition Disorders AND (Socioeconomic Factors OR Social class); Child Welfare/ statistics & numerical data; Diarrhea, Infantile/ epidemiology AND (Socioeconomic Factors OR Social class); Educational Status AND Health Status AND (Socioeconomic Factors OR Social class); Equity [ti] AND child*; Health Care Surveys AND Vaccination/ statistics & numerical data/utilization; Health Care Surveys AND (Social Justice OR Social Problems); Health disparities [ti]; Health Services Accessibility AND Income/statistics & numerical data; Health Services Accessibility AND Infant Mortality; Health Services Accessibility AND Mothers; Health Services AND Population Characteristics; Health Services AND Population Characteristics; Health Status AND epide-miology; Health Status Indicators AND Infant Mortality; Health Status Indicators AND Poverty; Health Status Indicators AND Residence Characteristics; Health Surveys AND (Socioeconomic Factors OR Social class); Healthy People Programs AND Pregnancy; Inequalities [ti] AND child*; Inequality [ti] AND child*; Inequality AND developing Countries; Inequality AND Infant Mortality AND Mothers; Inequity [ti] AND child*; Infant Mortality AND (Socioeconomic Factors OR Social class); Infant Mortality AND Residence Characteristics; Infant Mortality/trends AND Water Supply; Infant Welfare/ statistics & numerical data (Socioeconomic Factors OR Social class; Infant, Low Birth Weight AND (Socioeconomic Factors OR Social class); Infant, Small for Gestational Age; Maternal Mortality AND (Socioeconomic Factors OR Social class); Maternal Welfare/ statistics & numerical data; Mothers AND Developing Countries; Mothers AND Population Surveillance; Nutrition Disorders AND Developing Countries; Under-five mortality AND socioeconomic factors.
indicators (see list of keywords in the previous para-graph), according to any socioeconomic stratifi cation variable. This led to the identifi cation of 244 articles, which were obtained in full and read. Forty-fi ve addi-tional references were identifi ed by examining the references cited by these articles.
Other sources of data were the Demographic and Health Surveys (DHSa) and the UNICEF Multiple Indicators Cluster Surveys (MICSb). The World Bank’s PovertyNet initiativec used DHS data to produce tables on a variety of indicators of child health and nutrition for 56 countries, broken down by asset quintiles.27 We abstracted the relevant results in 27 tables that are avai-lable online (webannex).d Additional data were obtained from the UNICEF Multiple Indicator Cluster Surveys. All 59 country reports and/or standard tables from the second (circa 2000) and third (circa 2005) rounds of MICS that were available by mid-2007 were reviewed (24 web tables). For those who want more details of the information provided in this paper, these 51 tables can be accessed online.
Evaluation of inequities in the studied outcomes
There are several summary measures for evaluating the magnitude of inequities in health. In this paper we present the frequency of the health indicator for the families in the lowest and highest socioecomomic status (SES) quintiles and present the ratio between the lowest and highest quintiles (low/high ratio). We also present the concentration index, which compares the distribution of a specifi c variable or outcome between different strata of SES groups.30,70 The concentration indexprovides a means of quantifying the degree of wealth-related inequality in a specifi c health variable. It is derived from a concentration curve, which graphs on the x-axis the cumulative percentage of the sample, ranked by living standards, beginning with the poorest, and on the y-axis the cumulative percentage of the health variable corresponding to each cumulative percentage of the distribution of the living standard variable. The concentration index is defi ned as twice the area between the concentration curve, L(p), and the line of equality (the 45 degrees line running from the bottom-left corner to the top-right). So, in the case where there is no income-related inequality, the concen-tration index is zero. The convention is that the index takes a negative value when the curve lies above the line of equality, indicating disproportionate concentration of
the health variable among the poor, and a positive value when it lies below the line of equality. If the variable refl ects morbidity or mortality, the concentration index will usually be negative, meaning that ill health is more frequent among the poor. For coverage indicators, the concentration index is usually positive, as these tend to be higher among the rich.70
Levels of parental education and family income have been traditionally used to quantify SES, but recently many researchers and institutions, including the World Bank, have supported the use of household asset indices for this purpose. Responses to questions on assets (e.g. radio, television, refrigerator, and others) and building characteristics (e.g, type of fl oor, walls, number of rooms) serve as the basis for constructing a single, consolidated index of living standards, using principal components analysis to generate a weight for each item covered by the questionnaire. All mothers and children living in each household are assigned its standardized wealth index score, and the sample is then divided into quintiles. These simple indices allow equity analyses in the databases provided by the Demographic and Health Surveys (DHS), available for a large number of less developed countries.e Concentration indices were already available from the DHS tables analyzed by PovertyNet. For MICS, we calculated these indices using a standard spreadsheet.f
The tables in the webannex show measures of health and nutrition for each region of the world (DHS tables) or for selected countries (MICs tables). The large amount of information from DHS is summarized in Table 2, which shows the overall value for the whole population and for the two extreme SES groups (fi rst and fi fth quin-tiles), the ratio of the values in the extreme groups, and the concentration index. We could not present summary information derived from DHS for fi ve indicators, as the original tables did not contain data for the overall population. In addition, it was not possible to summa-rize the MICS results in a single table, as these usually refer to a small group of selected countries which vary according to the indicator analyzed. The main fi ndings from the MICS analyses are described in the text, and readers can access detailed information in the full tables available in the webannex.
Our results are primarily descriptive and cannot legi-timately be taken to imply a direct causal relationship between wealth and health for several reasons. First, wealth or asset possession per se may determine health
a Demographic and Health Surveys. Available from: http://www.measuredhs.com/aboutsurveys/dhs/start.cfm b UNICEF Multiple Indicators Cluster Surveys. Available from: http://www.childinfo.org/mics3_surveys.html c World Bank’s PovertyNet Initiative. Available from: www.worldbank.org/poverty/
d All the 51 tables are available from the Internet, by acessing Revista de Saúde Pública 44(1) at: www. scielo.br/rsp
e Quantitative techniques for health equity analysis. Available from: http://siteresources.worldbank.org/INTPAH/Resources/Publications/ Quantitative-Techniques/health_eq_tn07.pdf
status. Rather, the determining factors could be other characteristics (such as education or ethnic back-ground) that are simultaneously associated with both asset ownership and health. It is also possible that the health-poverty relationships are driven by particular items included in the index (e.g., water and sanitation). Should this be the case, improvements in the health conditions among the poor might be more effectively brought about by focusing on changing those particular components of the wealth index rather than by a general effort to increase economic status as measured by the index as a whole.
The differentials presented in the tables were not tested for statistical signifi cance because, due to the complex variance structure of the surveys, it would be necessary to carry out data analyses in order to perform such tests. However, DHS and MICS datasets usually include thousands of children, and the equity gradients consis-tently observed in most countries leave little doubt that the associations are not due to chance.
RESULTS AND DISCUSSION
Table 1 shows the framework for the analysis, sepa-rated by the fi ve PPHC-KN categories andlisting the indicators studied according to the source of informa-tion – DHS, MICS or literature review. This secinforma-tion is organized in the same order as that framework.
Socioeconomic context and position
As already described, asset indices were used to stra-tify families with young children according to their relative wealth in each country. This stratifi cation was used to document inequities for several determinants of child health and nutrition. There is a close associa-tion between family wealth and parent’s educaassocia-tion (Table 2). For all regions, the percent of women with
fi ve years or more of education was close to 80% for the wealthiest quintile compared to about 30% for the poorest; for men, the corresponding fi gures were about 85% and 45%.
This review does not attempt to disentangle the effects of education from those of wealth.18 Nevertheless, several studies show that maternal education is strongly associated with child health, even when other socioe-conomic factors are held constant.13,63 Improvements in parental education account for part of the progress in child survival in past decades.14 Maternal education may impact on child survival in several ways, inclu-ding increasing the mother’s ability to contribute to the family’s income and to reinforce her authority and ability to make decisions in the family, to make better use of existing services, and to provide better child
care. Before asset indices became widely used, maternal education was the most frequently used socioeconomic factor in analyses of inequities in child survival.
Differential exposure
Environmental conditions are important determinants of child health. Poor water, sanitation and hygiene conditions are associated with increased incidence of waterborne diseases, particularly diarrhea; crowding is associated with increased incidence of pneumonia, measles and other airborne infections; indoor pollution increases the risk of respiratory conditions; and vector density affects many diseases, particularly malaria.33
There is a clear association between the wealth of a country and the availability of water and sanitation to its population.a Because water and sanitation variables are included in the calculation of standard asset indices,23,27 it is not surprising that asset indices are strongly asso-ciated with wealth. For example, in seven countries analyzed by MICS (five of them in Sub-Saharan Africa), there were marked differences according to asset indices, especially for those very poor, as is the case of Sierra Leone, where the concentration indices were 0.346 for drinking water and 0.507 for sanitation (webtables 3.1 and 3.2). Blakely et al10 avoided this pitfall by using a simplifi ed index based on only four assets, and they were able to document important socioeconomic differences in exposure to poor water and sanitation in 11 different regions of the world.
The literature also shows direct associations between adequate water and sanitation with socioeconomic indicators such as maternal education28 and family income.5 Several MICS confi rm this association (data not shown).
Two behavioral practices – hand washing and sanitary disposal of infant feces – affect exposure to pathogens. Thirteen DHS conducted predominantly in African countries all show direct associations between wealth and the provide information on the presence of hand washing facilities in the households (webtable 2.3). Sixteen DHS reported on hand washing prior to food preparation (webtable 2.4). In 12 countries, nine or more out of ten informants reported that they washed their hands, in all asset quintiles. This raises the possi-bility of reporting bias, as described in previous studies comparing reported to observed hygiene behaviors.15
(three in Africa, Tajikistan and Dominican Republic) shows that poor households are consistently more likely to use solid fuels for cooking than wealthy households (webtable 3.3). The Blakely analyses confi rm this association in most of the regions studied.10
Crowding within households is well known to increase the risk of infectious diseases.34 Crowding at
community level is also important, as demonstrated by increased infectious morbidity in slums.51 A close proxy for crowding – the total fertility rate (TFR) – is twice as high among the poorest quintile as in the wealthiest one (Table 2), with a negative concentration index of -0.124. A Brazilian study shows that the number of persons per bedroom also presents important socioe-conomic gradients.4
Table 1. Framework for the analysis of inequities in child health and nutrition: indicators and their availability in studies.
Relevant factors for child health/nutrition Indicators DHS MICs Literature
Review Socioeconomic context and position:
Family income / assets Asset index X X X
Parental education Education among women X X X
Education among men X - X
Differential exposure:
Water / sanitation / hand washing Water supply - X X
Sanitation - X X
Hand washing facility in household X - X
Sanitary disposal of children's stools X - X
Crowding / housing / air pollution Solid fuel for cooking - X X
Crowding X - X
Disease vectors Exposure to disease vectors - - X
Differential vulnerability (Factors affecting incidence):
Immunizationa - -
-Infant and young child feeding Timely initiation of BF X X X
Exclusive breastfeeding X - X
Bottle feeding X X X
Timely complementary feeding - - X
Antenatal and delivery care Antenatal care X X X
Skilled delivery care X X X
Postnatal visit - - X
HIV preventiona - -
-ITN Bednet/ ITN use X X X
Differential vulnerability (Factors affecting severity): Poor nutrition (breastfeeding, complementary feeding, micronutrients – vitamin A, zinc, iron, iodine)
Vitamin A intake X X X
Zinc supplementation - - X
Iron supplementation - - X
Use of iodized salt - X X
Case-management (access to fi rst level and referral care) of diarrhea, pneumonia, sepsis, malaria
(including IPT), measles, HIV,b severe malnutrition,
neonatal morbidity
Care seeking for ARI X X X
Antibiotics for pneumonia - X X
Care seeking for diarrhea X - X
ORT to treat diarrhea X X X
Care seeking for fever X - X
Antimalarial treatment - X X
Quality of care - - X
Referral care - - X
Disease vector concentration is another environmental factor that may also be higher in poor households than in wealthy ones. Several studies in Africa and Asia have found signifi cantly higher densities of the malaria vector, the Anopheles mosquitoes, in the types of houses that poorer families tend to live in, that is, those with open eaves and windows, with walls of mud rather than brick, with a roof of thatch rather than tile or metal, and without a ceiling.1,36,41,47,55,73 House location is also a risk factor: higher mosquito densities have been found in houses near to breeding sites61 and in houses around the periphery of villages, where the poorest families tend to live.57
Summing up, children from poor households are at consistently higher risk of being exposed to inadequate water and sanitation, crowding, and indoor pollution than are children from wealthy families. Their care-takers are also less likely to adopt behaviors, such as hand washing or safe disposal of stools, that are associated with reduced risk of exposure to infectious agents. There is also evidence on higher exposure of poor children to Anopheles mosquitoes. Greater risk of exposure will likely lead to increased disease incidence, as will be subsequently discussed.
Differential vulnerability: factors affecting disease incidence
Poverty also affects how vulnerable children are to disease. We will now focus on factors associated with disease incidence, such as behaviors (breastfeeding), home practices (use of insecticide-treated mosquito nets) and utilization of health services (antenatal and perinatal). Later we will discuss variables associated with disease severity. Data on disease incidence rates will be presented in the section on differential health and nutrition outcomes.
Immunization coverage is a major factor affecting the incidence of certain diseases, and there is a large body of evidence, both from DHS and MICS, showing that immunization coverage tends to be consistently higher among rich than among poor children.27
Breastfeeding reduces both the incidence and severity of infectious diseases. Except for Sub-Saharan Africa, where the frequency of exclusive breastfeeding (among children under six months of age) does not show an association with wealth, in all other regions this
Table 1 continuation
Relevant factors for child health/nutrition Indicators DHS MICs Literature
Review Differential health outcomes:
Morbidity Diarrhea prevalence X X X
ARI prevalence X X X
Fever prevalence X X X
Undernutrition: stunting, wasting, underweight Anemia X - X
Low birth weight - b X
Stunting X X X
Underweight X X X
Wasting X X X
Overweight/obesity Overweight/obesity - X X
Differential consequences:
Mortality Neonatal mortality X - X
Infant mortality X X X
Under-fi ve mortality X X X
Cause-specifi c mortality - - X
Disability Prevalence of disability - - X
Human capital (height, reproductive performance, schooling, income)
Human capital - - X
Economic consequences to the family Economic losses - - X
DHS: Demography and Health Studies
MICS: UNICEF Multiple Indicators Cluster Surveys BF: Breastfeeding
ITN: Insecticide-treated bednets ARI: Acute respiratory infection IPT: Intermitent presumptive treatment
a Not covered in the review
practice is more common among the poor than among the better-off. (Figure 1 and Table 2). On the other hand, the practice of bottle-feeding shows remarkably consistent patterns throughout the world – children from wealthy families are much more likely to be bottle-fed than those from poor families (Table 2).
Regarding timely complementary feeding (breastfee-ding plus complementary foods among children aged 6-8 months), although the overall picture for all regions shows very similar results for the rich and the poor (Table 2), there are differences according to the preva-lence of breastfeeding. In countries where breastfeeding at ages 6-8 months is nearly universal, timely comple-mentary feeding tends to be more prevalent among the rich who introduce other foods and also continue to breastfeed. In regions where breastfeeding duration is
short, children from wealthy families are taken off the breast earlier and do not receive timely complementary feeding whereas the poor are more likely to comply because they are still breastfeeding.
These analyses confi rm earlier observations that breas-tfeeding is the only known benefi cial practice that, in many countries, is more prevalent among the poor than among the rich,58 unlike what happens in developed countries.40 There is a concern that, as the economic situation of LMICs improve, the developed country pattern may be observed in the future.67
Early initiation of breastfeeding is important for neonatal health.20 The DHS analyses do not include this variable, but tabulations by maternal education are available for Benin, where the highly educated are Table 2. Average and extreme values (fi rst and fi fth quintiles), low/high ratios and concentration indices of selected indicators for all regions of the world analyzed by DHS. (All values are percentages, except the mortally rates).
Outcome Webtable Average
value
Lowest quintile value
Highest quintile value
Low/high ratio
Concentration index Socioeconomic context and position
School completion among women 2.1 53.7 32.3 77.3 0.42 0.291
School completion among men 2.2 64.6 43.4 85.7 0.51 0.190
Differential exposure
Total fertility rates (number of births) 2.6 4.4 5.7 3.0 1.90 -0.124
Differential vulnerability
Exclusive breastfeeding 0-3 months 2.7 36.4 38.4 32.9 1.16 -0.008
Bottle feeding at age 12 months 2.8 24.4 17.1 39.0 0.44 0.312
Timely complementary feeding
6-9 months 2.9 64.1 61.9 62.2 1.00 0.010
Antenatal care coverage 2.10 76.1 62.1 92.6 0.67 0. 109
Delivery by a trained person 2.11 55.3 35.8 85.0 0.42 0.274
Bednet use by childrena 2.12 24.5 21.5 35.1 0.61 0.205
Vitamin A consumption 6
months-5 years 2.13 40.0 35.2 47.9 0.73 0.074
Use of oral rehydration for diarrhea 2.15 62.9 56.2 70.7 0.80 0.045
Medical treatment of diarrhea 2.16 32.8 27.6 42.8 0.65 0.098
Medical treatment of acute
respiratory infection 2.17 46.1 36.4 59.7 0.61 0.129
Medical treatment of fever 2.18 37.2 29.8 51.2 0.58 0.126
Differential health outcomes
Prevalence of fever in children 2.19 29.9 31.1 25.9 1.20 -0.024
Prevalence of diarrhea in children 2.20 17.2 19.0 13.9 1.36 -0.057
Prevalence of ARI in children 2.21 16.0 16.9 13.6 1.25 -0.020
Prevalence of stunting in children 2.24 33.1 40.5 21.0 1.93 -0.114
Prevalence of underweight in children 2.25 23.3 29.6 13.9 2.13 -0.134
Differential consequences
Infant mortality rates 2.26 72.9 85.0 50.1 1.70 -0.098
Under-fi ve mortality rates 2.27 115.2 135.4 73.5 1.84 -0.115
more likely to practice early initiationa, and available for Brazil, where the opposite trend is observed.b
Antenatal care and delivery by a skilled attendant are essential for preventing a large number of neonatal and child conditions.16 Extensive information is available on inequities in these two indicators. DHS (Figure 2 and Table 2) and MICS (webtables 3.6 and 3.7) surveys consistently show gradients in all regions of the world. Antenatal and delivery care show “top inequity”66 in Africa, where access among the top wealth quintile is considerably greater than the rest of the population, whereas in regions with high overall coverage, such as Europe, East Asia and Latin America, a “bottom-inequity” pattern is often observed, where the poorest quintile are considerably worse-off. This pattern is clearer when countries are analyzed separately instead of regionally.27
These inequities are also observed for delivery by a medically trained person (Table 2). Gwatkin et al26 analyzed inequities in antenatal and delivery care in the private and public sector, showing that inequities are considerable greater among women attending private services.
Access to emergency obstetric and newborn care can represent the difference between life and death for mothers and newborns. Using DHS data from 42 countries, Ronsmans et al52 found that in 37 of these countries women belonging to the poorest socioeco-nomic quintile had caesarean sections rates below 5% – regarded as the minimum required for saving maternal and newborn lives.19
Several studies from Brazil show that, although cove-rage with one or more visits for antenatal care is high, poor mothers are likely to have fewer visits and to start at advanced gestational ages4,12,29,39 and that the quality of care provided to poor women is worse than that received by the rich.12,49
A post-natal visit around the third day after delivery is strongly recommended for ensuring the health of mothers and newborns. Although this indicator is currently being incorporated in many surveys, few results are yet avai-lable. In Ghanac and Bangladesh,50 clear socioeconomic inequities were observed for both variables.
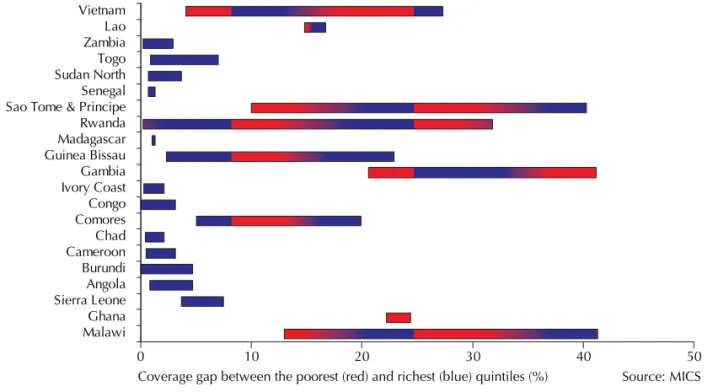
Insecticide-treated mosquito nets are the main preven-tive measure against malaria. DHS results from 16 Sub-Saharan African countries show that overall net use by children (not necessarily insecticide treated) is more common among the rich than the poor (Table 2). This pattern was observed in 13 countries whereas the opposite pattern was observed in Namibia and Nigeria and there was no difference between the better-off and the poor in Gabon. MICS results confi rm this pattern (webtable 3.8). Specifi c information on whether the child slept under an insecticide-treated mosquito net is available from 21 MICS countries, of which all but The Gambia, Ghana and Vietnam showed greater use by the better-off (Figure 3).
The review of inequities regarding vulnerability to disease incidence showed that, with the exception of breastfeeding practices, all other vulnerability indica-tors tend to be more prevalent among the poor than among the wealthy.
a Institut National de la Statistique et de l’Analyse Economique Cotonou. Benin DHS 2001:fi nal report. Calverton: ORC Macro; 2001. b Sociedade Civil de Bem-Estar Familiar. Brazil DHS, 1996: fi nal report. Rio de Janeiro; 1996.
c Ghana Statistical Service / ORT Macro. Ghana DHS 2003: fi nal report. Calverton: ORT Macro; 2003. Figure 1. Prevalence of exclusive breastfeeding in children 0-3
months, by wealth quintile and region of the world. 0
10 20 30 40 50 60 70
East Asia, Pacific Latin America, Caribbean
Middle East, North Africa South Asia Sub-Saharan Africa
Source: Gwatkin et al, 2007
Poorest 2nd 3rd 4th Least poor
Figure 2. Skilled delivery care, by wealth quintile and region of the world.
East Asia, Pacific Europe, Central Asia
Latin America, Caribbean
South Asia Sub-Saharan Africa
Source: Gwatkin et al, 2007 100
90 80 70 60 50 40 30 20 10 0
Middle East, North Africa
Vulnerability: factors affecting disease severity
Once a child acquires an infectious illness, the seve-rity of the episode is largely determined by his or her nutritional status and specifi c nutrient defi ciencies, as well as by the coverage of effective curative interven-tions. Undernutrition is both a contributing cause and a consequence of morbidity.9 As mentioned before, breastfeeding helps reducing the severity of infectious diseases, by providing active and passive immunity as well as antimicrobial substances.
Zinc and vitamin A play important roles in reducing the severity of infectious diseases.9 In non-malarious areas, iron is also a key micronutrient; however, recent research has shown that where malaria is prevalent iron supplementation can increase severe morbidity.53
Animal-based foods are excellent sources of dietary zinc and iron. Low intake of these foods is part of the causal pathway leading from poverty to undernutrition. Figure 4 shows the gaps in the proportion of one-year-olds who ate meat, poultry, fi sh or eggs in the 24 hours preceding 12 DHS surveys. Except for Nepal where differences are small, children from poor families are consistently less likely to eat such foods. No studies were located on use of zinc supplements according to socioeconomic position.
Low vitamin A intake due to poor diets is another aspect of undernutrition, and many countries have adopted vitamin A supplementation programs to correct this defi ciency. With a few exceptions in 50 different surveys, vitamin A coverage was higher among the rich than the poor (Table 2). The small gaps in Latin America may
be due to the fact that supplementation only occurs in restricted areas where few better-off families live.
Another important micronutrient is iodine, and most countries have salt fortifi cation programs. Household use of adequately iodized salt was estimated through the combination of two variables collected through MICS (webtable 3.11), namely percent of households with salt at the time of the visit and the proportion of salt samples that tested positive for iodine. In 20 out of 25 countries with available data, iodized salt use was directly related to wealth. Information is also available from 12 DHS surveys (webtable 2.14) showing equity gaps in nearly all countries studied except in three Latin American countries (Bolivia, Guatemala and Haiti).
Instead of evaluating the effect of separate inter-ventions, one may also assess how many of these essential interventions each child receives – in other words, the co-coverage of interventions.66 An analysis of DHS datasets showed that the eight interventions studied – including three vaccines (BCG, DPT and measles), tetanus toxoid (TT) for the mother, vitamin A supplementation, antenatal care, skilled delivery and safe water – were clustered on wealthy children, who often received most available interventions, while many poor children received few or none. This fi nding was confi rmed in a larger number of countries.11 The analysis of co-coverage also showed variability in the patterns of inequity (Figure 5). Whereas in countries with high coverage such as Brazil and Nicaragua the poorest quintile lagged signifi cantly behind the other four, in low coverage countries – such as Haiti and Cambodia – the richest quintile tended to be Figure 3. Equity gaps in ITN use by children, for selected countries.
Coverage gap between the poorest (red) and richest (blue) quintiles (%)
0 10 20 30 40 50
Malawi Ghana Sierra Leone Angola Burundi Cameroon Chad Comores Congo Ivory Coast Gambia Guinea Bissau Madagascar Rwanda Sao Tome & Principe Senegal Sudan North Togo Zambia Lao Vietnam
substantially ahead of the rest. These patterns were described as “bottom inequity” and “top inequity”,66 or alternatively as “marginal exclusion” or “massive deprivation”.72
Regarding curative interventions, in order to have access to curative care, families should be able to recognize signs and symptoms requiring professional care and have geographical and economic access to health care. A survey in rural Tanzania54 showed that mothers from the top quintile were more likely to know about danger signs, to live near a health facility, and to attend a facility when ill.
Data on oral rehydration therapy during diarrhea are available for several DHS and MICS. DHS results (Figure 6 and Table 2) show consistent results for all regions of the world, with higher use among the better-off, a pattern that is also evident in 17 of the 26 MICS (webtable 3.12). DHS data also show that care seeking for diarrhea at a health facility was clearly higher for children from wealthier families (Table 2).
Care seeking from a qualifi ed provider during acute respiratory infections was studied by DHS (Table 2), and again clear socioeconomic gradients were observed. This was confi rmed in 20 of the 26 available MICS (webtable 3.13). The latter also provide information on coverage with antibiotic treatment for probable pneumonia for Dominican Republic, Malawi, Sierra Leone, and Ghana (webtable 3.14). With the exception of Ghana, where use was similar in the extreme quintiles, the other three countries showed direct associations with wealth.
Finally, we reviewed results on treatment of fever with antimalarials in under-fi ves. In 17 of the 20 countries studied by MICS (webtable 3.15), antimalarial treatment coverage increased with wealth. No information is available on whether or not effective antimalarials were being used. Care seeking for fever from a health provider was markedly greater among the better-off (Table 2).
Intermittent presumptive treatment of malaria during pregnancy is effective in reducing low birth weight.38 Data for 17 Sub-Saharan African countries showed that the use of prophylactic malarial treatment was higher among women in the highest quintile (53.4%) than in those of the lowest quintile (34.4%). 27
Regarding the choice of health care providers, a survey in Bangladesh showed that children from wealthy families are substantially more likely to be brought to a medical doctor when suffering from diarrhea, while poorer children were often taken to unqualifi ed practitioners.37
Compliance with the advice provided by health workers is also essential, but data are limited on this topic. In Sudan, compliance with referral was greater among more educated mothers,2 but in rural Tanzania, reported compliance with recommended follow-up visits, referral or treatment was similar in all socioe-conomic groups.54
Summing up, this section documented important socioe-conomic differentials in terms of vulnerability to severe illness. Poverty is associated with lower dietary quality, lower coverage with vitamin A supplementation and less frequent use of iodine-fortifi ed salt. Once a child is ill, care seeking and treatment practices are consistently worse among children from poor families than for the better-off. Less evidence is available on the quality of care received by poor and wealth children within faci-lities, but isolated studies suggest that the better-off are more likely to be taken to qualifi ed providers.
Differentials in health and nutrition outcomes morbidity
Both DHS and MICS provide information on the prevalence of diarrhea, acute respiratory infections and fever among children. Fever prevalence was higher for poor than for rich children in most countries, although differences were small (Table 2). Recently, several large-scale cross-sectional surveys show higher Figure 4. Equity gaps in intake of meat, fi sh, poultry or eggs, for selected countries.
0% 20% 40% 60% 80% 100%
Coverage gap between the poorest (light) and richest (dark) quintiles (%) Bangladesh
Egypt Ethiopia Indonesia Kenya Madagascar Nepal Nigeria Philippines South Africa Tanzania Uganda
frequencies of malaria infection among the poor in Asia and Africa.21,32,35,45
In the vast majority of DHS and MICS, caretakers of poor children reported that diarrhea prevalence among poor children was 30% or more than the rate in the top quintile (Figure 7 and Table 2). Similar results were obtained in 20 out of the 26 MICS countries with such information (webtable 3.17). Also, most MICS coun-tries (webtable 3.18) reported that cough – a proxy for acute respiratory illness – was more frequent among the poor than among the better-off. DHS results confi rm the MICS fi ndings (Table 2).
In short, reported morbidity tended to be more common among the poor, but the magnitude of the differences was often small, with a 20%-40% excess risk relative to the better-off.
Malnutrition
The term malnutrition covers undernutrition – expressed either as anthropometric defi cits or micronutrient defi -ciencies – as well as overnutrition or obesity.
Micronutrient defi ciencies are more common among the poor. DHS information on anemia – for which the main causes are iron defi ciency and malaria – is available for 18 countries around the world (webtables 2.22 and 2.23), and there are clear inverse socioeco-nomic gradients with wealth in all but one country (Turkmenistan). Vitamin A defi ciency has been histo-rically associated with poverty.46
Low birth weight is used in LMICs as an indicator of fetal malnutrition. WHO and UNICEF estimated the prevalence of low birth weight for over 170 countries, showing a strong inverse correlation with the level of development.60 In countries where a high proportion of newborns are weighed, such as Brazil, there is evidence of a direct association between birth weight and wealth.3,7,56
Table 2 shows that stunting and underweight are substantially more prevalent among poor than rich children in all regions of the world, usually by a factor of two. Information on wasting, or weight-for-height Figure 5. Percent of underfi ve children receiving six or more
child survival interventions, by wealth quintile and country. 0%
20% 40% 60% 80% 100%
Poorest 2nd 3rd 4th Least poor
Source: Victora et al, 2005
Bangladesh Benin Brazil Cambodia Eritrea
Haiti Malawi Nepal Nicaragua
Figure 6. Oral rehydration therapy during diarrhea, by wealth quintile and region of the world.
0 10 20 30 40 50 60 70 80
Poorest 2nd 3rd 4th Least poor
East Asia, Pacific Europe, Central Asia Latin America, Caribbean Middle East, North Africa
South Asia Sub-Saharan Africa
Source: Gwatkin et al, 2007
Figure 7. Prevalence of diarrhea, by wealth quintile and region of the world.
0 5 10 15 20 25
Poorest 2nd 3rd 4th Least poor
East Asia, Pacific Latin America, Caribbean South Asia
Source: Gwatkin et al, 2007 Europe, Central Asia Middle East, North Africa Sub-Saharan Africa
Figure 8. Underfi ve mortality rate, by wealth quintile and region of the world.
0 20 40 60 80 100 120 140 160 180 200
Poorest 2nd 3rd 4th Least poor
East Asia, Pacific Latin America, Caribbean South Asia
defi cits, based on 24 countries studied in MICS, also shows consistent socioeconomic gradients in nearly all countries, although the magnitude of the gaps tends to be smaller. African children in the top quintile show a sharp reduction in undernutrition compared to the other four wealth groups whereas in the other regions, patterns are more or less linear, when data from all countries are pooled.
Childhood overweight is a growing global concern.48 MICS results from four countries (Ghana, Sierra Leone, Tajikistan and Dominican Republic) show that preva-lence tends to be higher among the rich than among the poor, with concentration indices between 0.076 and 0.215 (webtable 3.22). Other studies – mostly from middle-income countries – reveal similar trends.6,31
In summary, with the single exception of overweight, nutritional and morbidity outcomes are considerably worse among poor than among better-off children. Because inadequate nutritional status is part of the vicious cycle of malnutrition and infection, higher preva-lence of undernutrition further contributes to the inci-dence, severity and case-fatality of childhood illnesses.
DIFFERENTIAL CONSEQUENCES
Mortality
Socioeconomic differentials in child death rates are consistently found throughout the globe. Wide socioe-conomic differentials in infant and under-fi ve mortality are present (Figure 8 and Table 2). Socioeconomic inequities tend to be slightly more marked for the latter, suggesting that deaths of children 1-4 years are more strongly determined by SES. The magnitude of poor/rich mortality ratios tends to be inversely related to the overall mortality rate in the country. In Africa, mortality in the highest quintile is considerably lower than in the other four, poorer quintiles. In the other regions, inequity patterns are quite linear, but when countries are analyzed separately,27 a common pattern in low-mortality countries is the poorest quintile showing considerably higher mortality than the other four.
The importance of neonatal mortality as a major component of under-fi ve deaths has received growing attention.38 DHS data reveal consistently higher neonatal mortality rates for those in the poorest 20% of households than for those in the top quintile.22 The disparity is higher for post-neonatal deaths than for neonatal deaths and higher for child (1-4 year olds) deaths than for infant deaths, because later deaths are more easily avoided.
Although aggregate national level estimates of cause-specifi c under-fi ve mortality are now available,a neither DHS nor MICS provide breakdowns by socioeconomic indicators. Isolated studies, however, suggest that the inequities observed for all-cause mortality also apply to individual causes, as is the case for malaria in Tanzania,b infectious diseases in Brazil,62,63 and dysentery, acute watery diarrhea, measles, unspecifi ed fever, and drow-ning, but not respiratory diseases in Bangladesh.44
Inequities in mortality are closely related to differentials in nutritional status, as poor nutrition is an underlying cause of about a quarter of all under-fi ve deaths.9 Socioeconomic differentials in under-fi ve mortality are much wider than those observed for morbidity. This suggests that mortality gaps are largely due to differences in disease severity and case-management, rather than differences in incidence.
Human capital
There is limited information on the long-term conse-quences of growing up in poverty in LMICs, because such evidence is derived from long-term follow-up studies that are uncommon. Recent analyses of fi ve cohort studies from LMICs showed strong associations between poverty in childhood and adult human capital outcomes including attained height, achieved schoo-ling, income and offspring birth weight,68 as well as with low cognitive development at later ages.25 At least part of the link between early poverty and poor intellectual performance is mediated through nutrition, as studies of iron defi ciency in Costa Rica show.42
CONCLUSIONS
We employed a conceptual framework to search the published literature and databases from two major survey initiatives (DHS and MICS) on the topic of socioeconomic differentials in child health and nutri-tion. Data from nearly 100 countries suggest that poor children and their mothers lag well behind the better-off in terms of mortality and undernutrition. These inequi-ties in health outcomes result from the fact that poor children, relative to those from wealthy families, are more likely to be exposed to disease-causing agents; once they are exposed, they are more vulnerable due to lower resistance and low coverage with preventive interventions; once they acquire a disease that requires medical treatment, they are less likely to have access to services, the quality of these services is likely to be lower, and life-saving treatments are less readily available. As a consequence, the odds are stacked against poor children, throughout these different steps in a causal chain. There were very few exceptions to
a World Health Organization. World health statistics 2007. Geneva; 2007.
1. Adiamah JH, Koram KA, Thomson MC, Lindsay SW, Todd J, Greenwood BM. Entomological risk factors for severe malaria in a peri-urban area of The Gambia.
Ann Trop Med Parasitol. 1993;87(5):491-500.
2. al Fadil SM, Alrahman SH, Cousens S, Bustreo F, Shadoul A, Farhoud S, et al. Integrated Management of Childhood Illnesses strategy: compliance with referral and follow-up recommendations in Gezira State,
Sudan. Bull World Health Organ. 2003;81(10):708-16.
3. Andrade CL, Szwarcwald CL, Gama SG, Leal MC. Desigualdades sócio-econômicas do baixo peso ao nascer e da mortalidade perinatal no Município do Rio
de Janeiro, 2001. Cad Saude Publica. 2004;20(Supl
1):S44-51. DOI:10.1590/S0102-311X2004000700005
4. Barros AJD, Victora CG, Cesar JA, Neumann NA, Bertoldi AD. Brazil: are health and nutrition programs reaching the neediest? In: Gwatkin DR, Wagstaff A, Yazbeck AS, editors. Reaching the poor: with health, nutrition, and population services: what works, what doesn’t, and why. Washington: The World Bank; 2005. p.281-306.
5. Barros AJD, Santos IS, Matijasevich A, Araujo CL, Gigante DP, Menezes AMB, et al. Methods used in the 1982, 1993, and 2004 birth cohort studies from Pelotas, Rio Grande do Sul State, Brazil, and a description of the socioeconomic conditions
of participants’ families. Cad Saude Publica.
2008;24(Suppl 3):S371-80. DOI:10.1590/S0102-311X2008001500002
6. Barros AJD, Victora CG, Santos IS, Matijasevich A, Araujo CL, Barros FC. Infant malnutrition and obesity in three population-based birth cohort studies in
Southern Brazil: trends and differences. Cad Saude
Publica. 2008;24(Suppl 3):S417-26. DOI:10.1590/ S0102-311X2008001500007
7. Barros FC, Victora CG, Matijasevich A, Santos IS, Horta BL, Silveira MF, et al. Preterm births, low birth weight, and intrauterine growth restriction in three birth cohorts in Southern Brazil: 1982, 1993 and
2004. Cad Saude Publica. 2008;24(Suppl 3):S390-8.
DOI:10.1590/S0102-311X2008001500004
8. Black RE, Morris SS, Bryce J. Where and why are
10 million children dying every year? Lancet.
2003;361(9376):2226-34. DOI:10.1016/S0140-6736(03)13779-8
9. Black RE, Allen LH, Bhutta ZA, Caulfi eld LE, de Onis M, Ezzati M, et al. Maternal and child undernutrition: global and regional exposures and
health consequences. Lancet. 2008;37(9608):243-60.
DOI:10.1016/S0140-6736(07)61690-0
10. Blakely T, Hales S, Kieft C, Wilson N, Woodward A. The global distribution of risk factors by poverty level.
Bull World Health Organ. 2005;83(2):118-26.
11. Bryce J, Terreri N, Victora CG, Mason E, Daelmans B, Bhutta ZA, et al. Countdown to 2015: tracking
intervention coverage for child survival. Lancet.
2006;368(9541):1067-76. DOI:10.1016/S0140-6736(06)69339-2
12. Cesar JA, Matijasevich A, Santos IS, Barros AJD, Dias-da-Costa JS, Barros FC, et al. Utilization of maternal and child health services in three population-based
cohorts in Southern Brazil, 1982-2004. Cad Saude
Publica. 2008;24(Suppl 3):S427-36. DOI:10.1590/ S0102-311X2008001500008
13. Cleland JG, Van Ginneken JK. Maternal education and child survival in developing countries: the search for
pathways of infl uence. Soc Sci Med.
1988;27(12):1357-68. DOI:10.1016/0277-9536(88)90201-8
14. Cleland J, Bicego G, Fegan G. Socioeconomic inequalities in childhood mortality: the 1970s to the
1980s. Health Transit Rev. 1992;2(1):1-18.
15. Curtis V, Cousens S, Mertens T, Traore E, Kanki B, Diallo I. Structured observations of hygiene behaviours
in Burkina Faso: validity, variability, and utility. Bull
World Health Organ. 1993;71(1):23-32.
16. Darmstadt GL, Bhutta ZA, Cousens S, Adam T, Walker N, de Bernis L. Evidence-based, cost-effective interventions: how many newborn babies can we save?
Lancet. 2005;365(9463):977-88. DOI:10.1016/S0140-6736(05)71088-6
17. de Onis M, Blössner M, Borghi E, Frongillo EA, Morris R. Estimates of global prevalence of
childhood underweight in 1990 and 2015. Jama.
2004;291(21):2600-6. DOI:10.1001/jama.291.21.2600 18. Desai S, Alva S. Maternal education and child health:
is there a strong causal relationship? Demography.
1998;35(1):71-81. DOI:10.2307/3004028 19. Dumont A, de Bernis L, Bouvier-Colle MH, Bréart
G. Caesarean section rate for maternal indication
in sub-Saharan Africa: a systematic review. Lancet.
2001;358(9290):1328-33. DOI:10.1016/S0140-6736(01)06414-5
20. Edmond KM, Zandoh C, Quigley MA, Amenga-Etego S, Owusu-Agyei S, Kirkwood BR. Delayed breastfeeding initiation increases risk of neonatal
mortality. Pediatrics. 2006;117(3):e380-6.
DOI:10.1542/peds.2005-1496
21. Erhart A, Ngo DT, Phan VK, Ta TT, Van Overmeir C, Speybroeck N, et al. Epidemiology of forest malaria in central Vietnam: a large scale cross-sectional survey.
Malar J. 2005;4:58. DOI: 10.1186/1475-2875-4-58
22. Fenn B, Kirkwood BR, Popatia Z, Bradley DJ. Inequities in neonatal-survival interventions: evidence from
national surveys. Arch Dis Child Fetal Neonatal Ed.
2007;92(5):F361-6. DOI:10.1136/adc.2006.104836 REFERENCES
this pattern: child obesity and inadequate breastfeeding practices were the only conditions more often reported among the rich than the poor.
This study was purposefully biased towards interven-tions that can be delivered within the health sector. At
23. Filmer D, Pritchett LH. Estimating wealth effects without expenditure data--or tears: an application to educational enrollments in states of India.
Demography. 2001;38(1):115-32.
24. Fotso JC. Child health inequities in developing
countries: differences across urban and rural areas. Int
J Equity Health. 2006;5:9. DOI:10.1186/1475-9276-5-9
25. Grantham-McGregor S, Cheung YB, Cueto S, Glewwe P, Richter L, Strupp B. Developmental potential in the fi rst 5 years for children in developing countries.
Lancet. 2007;369(9555):60-70. DOI:10.1016/S0140-6736(07)60032-4
26. Gwatkin DR, Bhuiya A, Victora CG. Making health
systems more equitable. Lancet.
2004;364(9441):1273-80. DOI:10.1016/S0140-6736(04)17145-6
27. Gwatkin DR, Rutstein S, Johnson K, Suliman E, Wagstaff A, Amozou A. Socio economic differences in health, nutrition, and population within developing coutries:an overview. Washington, DC: World Bank; 2007.
28. Gyimah SO. Interaction effects of maternal education and household facilities on chilhdood diarrhea in
sub-Saharan Africa: the case of Ghana. J Health Popul Dev
Ctries. 2003;Papers:1-17
29. Halpern R, Barros FC, Victora CG, Tomasi E. Atenção pré-natal em Pelotas, Rio Grande do Sul, Brasil, 1993.
Cad Saude Publica. 1998;14(3):487-92. DOI:10.1590/ S0102-311X1998000300004
30. Health analysis: risks of dying and income inequalities.
Epidemiol Bull. 1999;20(4):7-10.
31. Hernández B, Cuevas-Nasu L, Shamah-Levy T, Monterrubio EA, Ramírez-Silva CI, García-Feregrino R, et al. Factors associated with overweight and obesity in Mexican school-age children: results from the National
Nutrition Survey 1999. Salud Publ Mex. 2003;45(Suppl
4):S551-7. DOI:10.1590/S0036-36342003001000011
32. Incardona S, Vong S, Chiv L, Lim P, Nhem S, Sem R, Khim N, Doung S, Mercereau-Puijalon O, Fandeur T. Large-scale malaria survey in Cambodia: novel insights
on species distributions and risk-factors. Malar J.
2007;6:37. DOI:10.1186/1475-2875-6-37
33. Jamison DT, Breman JG, Measham AR, Alleyne GA, Claeson M, Evans D, et al. Disease control priorities in developing countries. Washington, DC: The World Bank/Oxford University Press; 2006.
34. Kirkwood BR, Gove S, Rogers S, Lob-Levyt J, Arthur P, Campbell H. Potential interventions for the prevention of childhood pneumonia in developing countries:
a systematic review. Bull World Health Organ.
1995;73(6):793-8.
35. Klinkenberg E, McCall PJ, Wilson MD, Akoto AO, Amerasinghe FP, Bates I, et al. Urban malaria and anaemia in children: a cross-sectional survey in two
cities of Ghana. Trop Med Int Health.
2006;11(5):578-88. DOI:10.1111/j.1365-3156.2006.01609.x
36. Konradsen F, Amerasinghe P, van der Hoek W, Amerasinghe F, Perera D, Piyaratne M. Strong association between house characteristics and
malaria vectors in Sri Lanka. Am J Trop Med Hyg.
2003;68(2):177-81.
37. Larson CP, Saha UR, Islam R, Roy N. Childhood diarrhoea management practices in Bangladesh: private sector dominance and continued inequities
in care. Int J Epidemiol. 2006;35(6):1430-9.
DOI:10.1093/ije/dyl167
38. Lawn JE, Cousens S, Zupan J. 4 million neonatal deaths:
when? Where? Why? Lancet. 2005;365(9642):891-900.
DOI:10.1016/S0140-6736(05)71048-5
39. Leal MC, Gama SGN, Campos MR, Cavalini LT, Garbayo LS, Brasil CLP, et al. Fatores associados à morbi-mortalidade perinatal em uma amostra de maternidades públicas e privadas do Município
do Rio de Janeiro, 1999-2001. Cad Saude Publica.
2004;20(Supl 1):S20-33. DOI:10.1590/S0102-311X2004000700003
40. Li R, Grummer-Strawn L. Racial and ethnic disparities in breastfeeding among United States infants: Third National Health and Nutrition Examination Survey,
1988-1994. Birth. 2002;29(4):251-7. DOI:10.1046/
j.1523-536X.2002.00199.x
41. Lindsay SW, Snow RW. The trouble with eaves;
house entry by vectors of malaria. Trans R Soc Trop
Med Hyg. 1988;82(4):645-6. DOI: 10.1016/0035-9203(88)90546-9
42. Lozoff B, Jimenez E, Smith JB. Double burden of iron defi ciency in infancy and low socioeconomic status: a longitudinal analysis of cognitive test scores to age 19
years. Arch Pediatr Adolesc Med.
2006;160(11):1108-13. DOI:10.1001/archpedi.160.11.1108
43. Moser KA, Leon DA, Gwatkin DR. How does progress towards the child mortality millennium development goal affect inequalities between the poorest and least poor? Analysis of Demographic and Health Survey
data. BMJ. 2005;331(7526):1180-2. DOI:10.1136/
bmj.38659.588125.79
44. Muhuri PK. Health programs, maternal education, and differential child mortality in Matlab,
Bangladesh. Popul Dev Rev. 1995;21(4):813-34.
DOI:10.2307/2137775
45. Njau JD, Goodman C, Kachur SP, Palmer N, Khatib RA, Abdulla S, et al. Fever treatment and household wealth: the challenge posed for rolling out combination therapy
for malaria. Trop Med Int Health. 2006;11(3):299-313.
DOI:10.1111/j.1365-3156.2006.01569.x 46. Oomen HAPC. Xerophthalmia in nutrition in
preventive medicine. In: Beaton GH, Bengoa JM, editors. Nutrition in preventive medicine. Geneva: WHO; 1976. (WHO Monograph Series, 62).
47. Palsson K, Jaenson TG, Dias F, Laugen AT, Bjorkman A. Endophilic Anopheles mosquitoes in Guinea Bissau,
west Africa, in relation to human housing conditions. J
Med Entomol. 2004;41(4):746-52. DOI:10.1603/0022-2585-41.4.746
48. Popkin BM. The nutrition transition and obesity in the
developing world. J Nutr. 2001;131(3):S871-3.
49. Puccini RF, Pedroso GC, Silva EMK, Araújo NS, Silva NN. Eqüidade na atencao pre-natal e ao parto em area da Regiao Metropolitana de Sao Paulo, 1996.
Cad Saude Publica. 2003;19(1):35-45. DOI:10.1590/ S0102-311X2003000100005
50. Rahman MS. Socioeconomic disparities in health, nutrition, and population in Bangladesh: do education
and exposure to media reduce it? Pakistan J Nutr.
51. Riley LW, Ko AI, Unger A, Reis MG. Slum health:
diseases of neglected populations. BMC Int Health
Hum Rights. 2007;7:2. DOI:10.1186/1472-698X-7-2 52. Ronsmans C, Holtz S, Stanton C. Socioeconomic
differentials in caesarean rates in developing countries: a
retrospective analysis. Lancet. 2006;368(9546):1516-23.
53. Sazawal S, Black RE, Ramsan M, Chwaya HM, Stoltzfus RJ, Dutta A, et al. Effects of routine
prophylactic supplementation with iron and folic acid on admission to hospital and mortality in preschool children in a high malaria transmission setting: community-based, randomised, placebo-controlled
trial. Lancet. 2006;367(9507):133-43.
54. Schellenberg JA, Victora CG, Mushi A, de Savigny D, Schellenberg D, Mshinda H, et al. Inequities among the very poor: health care for children in rural southern
Tanzania. Lancet. 2003;361(9357):561-6.
55. Schofi eld C, Briceño-León R, Kolstrupp N, Webb D, White G. Role of house design in limiting vector-borne disease. In: Cairncross S, Hardoy JE, Satterthwaite D, editors. Poor die young: housing and health in Third World cities. London: Earthscan; 1990. p.189-212. 56. Silva AAM, Barbieri MA, Bettiol H, Dal Bó CMR,
Mucillo G, Gomes UA. Saúde perinatal: baixo peso e
classe social. Rev Saude Publica. 1991;25(2):87-95.
DOI: 10.1590/S0034-89101991000200002
57. Smith T, Charlwood JD, Takken W, Tanner M, Spiegelhalter DJ. Mapping the densities of
malaria vectors within a single village. Acta
Tropica. 1995;59(1):1-18. DOI:10.1016/0001-706X(94)00082-C
58. Trussel J, Grummer-Strawn L, Rodriguez G, Vanlandingham M. Trends and differentials in breastfeeding behaviour: evidence from the
WFS and DHS. Popul Stud. 1992;46:285-307.
DOI:10.1080/0032472031000146246
59. UNICEF. Countdown to 2015. Tracking down progress in maternal, neonatal and child survival: the 2008 report. New York; 2008.
60. The United Nations Children’s Fund/World Health Organization. Low birth weight: country, regional and global estimates. New York; 2004
61. Van Der Hoek W, Konradsen F, Amerasinghe PH, Perera D, Piyaratne MK, Amerasinghe FP. Towards a risk map of malaria for Sri Lanka: the importance of house
location relative to vector breeding sites. Int J Epidemiol.
2003;32(2):280-5. DOI:10.1093/ije/dyg055 62. Victora CG, Barros FC, Vaughan JP. Epidemiologia
da desigualdade: um estudo longitudinal de 6.000 crianças brasileiras. São Paulo: Hucitec; 1988.
63. Victora CG, Huttly SR, Barros FC, Lombardi C, Vaughan JP. Maternal education in relation to early and late child health outcomes: fi ndings from a
Brazilian cohort study. Soc Sci Med.
1992;34(8):899-905. DOI:10.1016/0277-9536(92)90258-R
64. Victora CG, Vaughan JP, Barros FC, Silva AC, Tomasi E. Explaining trends in inequities: evidence from Brazilian
child health studies. Lancet. 2000;356(9235):1093-8.
DOI: 10.1016/S0140-6736(00)02741-0
65. Victora CG, Wagstaff A, Schellenberg JA, Gwatkin D, Claeson M, Habicht JP. Applying an equity lens to child health and mortality: more of the same
is not enough. Lancet. 2003;362(9379):233-41.
DOI:10.1016/S0140-6736(03)13917-7
66. Victora CG, Fenn B, Bryce J, Kirkwood BR. Co-coverage of preventive interventions and implications for child-survival strategies: evidence from national
surveys. Lancet. 2005;366(495):1460-6. DOI:10.1016/
S0140-6736(05)67599-X
67. Victora CG, Matijasevich A, Santos IS, Barros AJC, Horta BL, Barros FC. Breastfeeding and feeding patterns in three birth cohorts in southern Brazil:
trends and differentials. Cad Saude Publica.
2008;24(Suppl 3):S409-16. DOI:10.1590/S0102-311X2008001500006
68. Victora CG, Adair L, Fall C, Hallal PC, Martorell R, Richter L, et al. Maternal and child undernutrition: consequences for adult health and human capital.
Lancet. 2008;371(9609):340-57. DOI:10.1016/S0140-6736(07)61692-4
69. Wagstaff A, Claeson M, Hecht RM, Gottret P, Fang Q. Millennium development goals for health: what will it take to accelerate progress? In: Jamison DT, Breman JG, Measham AR, Alleyne GA, Claeson M, Evans D, et al., editors. Disease control priorities in developing countries. 2 ed. Washington, DC: The World Bank/ Oxford University Press; 2006. p.181-94.
70. Wagstaff A, Paci P, van Doorslaer E. On the
measurement of inequalities in health. Soc Sci
Med. 1991;33(5):545-57.
DOI:10.1016/0277-9536(91)90212-U
71. Whitehead M, Dahlgren G. Levelling up (part 1): concepts and principles for tackling social inequities in health. Copenhagen: WHO Regional Offi ce for Europe; 2006. (Studies on social and economic determinants of population health, 2).
72. World Health Organization. The World Health report 2005: make every mother and child count. Geneva; 2005.
73. Yé Y, Hoshen M, Louis V, Séraphin S, Traoré I, Sauerborn R. Housing conditions and Plasmodium falciparum infection: protective effect of iron-sheet roofed houses.