Diarrhea, Stimulation and Growth Predict
Neurodevelopment in Young North Indian
Children
Ingrid Kvestad1,2, Sunita Taneja3, Mari Hysing2, Tivendra Kumar4, Nita Bhandari3, Tor A. Strand5,6*
1Department of Biological and Medical Psychology, Faculty of Psychology, University of Bergen, Bergen, Norway,2Centre for Child and Youth Mental Health and Child Welfare, Uni Research Health, Bergen, Norway,3Society for Applied studies, New Delhi, India,4Society for Essential Health Action and Training, New Delhi, India,5Centre for International Health, University of Bergen, Bergen, Norway,6Department of Laboratory Medicine, Innlandet Hospital Trust, Lillehammer, Norway
Abstract
Background and Objective
Infants and young children in low to middle-income countries are at risk for adverse neuro-development due to multiple risk factors. In this study, we sought to identify stimulation and learning opportunities, growth, and burden of respiratory infections and diarrhea as predic-tors for neurodevelopment.
Methods
We visited 422 North Indian children 6 to 30 months old weekly for six months. Childhood ill-nesses were assessed biweekly. At end study, we assessed neurodevelopment using the Ages and Stages Questionnaire 3rded. (ASQ-3) and gathered information on stimulation and learning opportunities. We identified predictors for ASQ-3 scores in multiple linear and logistic regression models.
Results
We were able to explain 30.5% of the variation in the total ASQ-3 score by the identified pre-dictors. When adjusting for child characteristics and annual family income, stimulation and learning opportunities explained most of the variation by 25.1%. Height for age (standard-ized beta: 0.12, p<.05) and weight for height z-scores (std. beta: 0.09, p<.05) were
positive-ly associated with the total ASQ-3 score, while number of days with diarrhea was negativepositive-ly associated with these scores (std. beta: -0.13, p<0.01).
Conclusion
Our results support the importance of early child stimulation and general nutrition for child development. Our study also suggests that diarrhea is an additional risk factor for adverse neurodevelopment in vulnerable children.
OPEN ACCESS
Citation:Kvestad I, Taneja S, Hysing M, Kumar T, Bhandari N, Strand TA (2015) Diarrhea, Stimulation and Growth Predict Neurodevelopment in Young North Indian Children. PLoS ONE 10(3): e0121743. doi:10.1371/journal.pone.0121743
Academic Editor:Jacobus van Wouwe, TNO, NETHERLANDS
Received:July 2, 2014
Accepted:February 17, 2015
Published:March 31, 2015
Copyright:© 2015 Kvestad et al. This is an open access article distributed under the terms of the
Creative Commons Attribution License, which permits unrestricted use, distribution, and reproduction in any medium, provided the original author and source are credited.
Data Availability Statement:Data sharing is restricted by the Ethical Guidelines for Biomedical Research on Human participants issued by the Indian Council of Medical Research in India. Data request may be sent to the corresponding author.
Introduction
There is sound evidence that deficient care and inadequate stimulation are key risk factors for
adverse neurodevelopment in children [1–3]. Likewise, the evidence for poor growth and
stunting as significant risk factors is convincing [4,5]. Pneumonia and diarrhea are important
causes of morbidity and mortality in children in low to middle-income countries (LMIC) [6].
In some studies, diarrhea prevalence has predicted neurodevelopment [4,7–9], but a recent
meta-analysis including these studies concluded that number of days with diarrhea did not
pre-dict neurodevelopment when taking stunting into account [10]. However, the very few studies
included in this meta-analysis varied substantially in sample size, age of the participants, choice of cognitive measures and the quality of data on diarrhea.
In poor populations, risk factors co-occur giving rise to cumulative effects on
neurodevelop-ment [2,5,11,12]. Complex relationships among these risk factors make it challenging to
deter-mine their independent contribution. In the present study, we have assessed developmental status and collected information on various risk and protective factors for adverse development such as socioeconomic status, child characteristics and stimulation and learning opportunities in a sample of 422 young North Indian children. The children participated in a six months study of folic acid and vitamin B12 supplementation on growth, diarrhea and other infections
in New Delhi, India [13], and unique to this study is the thorough biweekly assessment of
childhood illnesses such as acute lower respiratory infections (ALRI), pneumonia and diarrhea. The main aim of our study is to identify predictors for neurodevelopment in multiple regres-sion models, and specifically to measure the extent to which diarrheal illness is associated with early child development.
Materials and Methods
Participants and study setting
The children (n = 422) included in this study were part of a randomized, doubled blind, place-bo controlled trial (RCT) (n = 1000) on the effect of vitamin B12 and/or folic acid supplemen-tation on childhood infections and growth in New Delhi, India (clinicaltrials.gov: NCT
00717730) [13]. Children aged 6 to 30 months were enrolled and randomized in blocks of 16,
the last 440 randomized enrollments were requested to participate in the developmental assess-ment sub study. Of these, three children were not available for assessassess-ment and 15 did not wish to participate, hence the final number of participants was 422. The enrollment for this sample was from November 2010 through March 2011, and the developmental assessments were per-formed from May through September 2011. The study site was in the low and middle socioeco-nomic settings of Tigri and Dakshinpuri in New Delhi. These are typical urban neighborhoods with a total population of about 300,000. The ethics committees of the Society for Essential Health Action and Training (India), Society for Applied Studies (India), Christian Medical College (India), and the Norwegian Regional Committee for Medical and Health Research Eth-ics (REK VEST) approved the study.
Procedure
For enrollment, a door-to-door survey was conducted to identify households with eligible chil-dren. A physician and field supervisors screened the children and written informed consent was obtained from caregivers prior to enrollment. Availability of informed consent and no plans to move away over the next 6 months were considered for enrollment. We excluded children with severe acute malnutrition (weight for height z-scores less than -3), with severe
anemia (hemoglobin<7 g/dL), and those who were using folic acid and/or vitamin B12
supplements. Information on child characteristics and socioeconomic status was collected at baseline. A team of field workers visited the children`s household twice weekly for six months for close morbidity follow up. Weight and height was measured at baseline and at end study at the study clinic. At the end of six months follow up, developmental assessment was conducted and information on the child`s stimulation and learning opportunities was collected at the study clinic. There were no additional exclusion criteria for the developmental assessment.
Measurements
Developmental assessment. Neurodevelopmental status was measured by the Ages and
Stages Questionnaire 3. ed. (ASQ-3), a comprehensive checklist, standardized for children
1–66 months with age-appropriate questionnaires [14]. The questionnaires contain 30 items
that sums up to five subscales: Communication, Gross motor, Fine motor, Problem-solving and Personal-social (possible score range from 0 to 60), and a total score (possible score range form 0 to 300). Three field supervisors were trained to administer the ASQ-3 directly with the child at the research clinic in the presence of caregivers. The examiners elicited the relevant skills from the child during sessions using standardized materials. The caregiver served as an important contributor in supporting the child, eliciting behaviors and gave relevant
informa-tion of the child’s development when necessary. The three field supervisors were trained by the
main author, a clinical child psychologist with experience in the assessment of infants and young children and in training of personnel.
All forms were translated to Hindi following official recommendations [15], and items not
appropriate for the cultural setting were identified and slightly adjusted (for extensive
informa-tion see [16]). During the 11 days of training, the field supervisors were standardized in
per-forming the procedure, and they reached a high inter-observer agreement both during training and in the 10% quality control throughout the study. In the translated ASQ-3 version, the stan-dardized alphas for the total ASQ-3 scores were strong, indicating an overall acceptable
inter-nal consistency [16].
Stimulation and learning opportunities. To assess the caregiver`s promotion of child
de-velopment we carefully selected two questions from the standardized assessment tool the
Home Observation for Measurement of the Environment (HOME) [17]. One question was on
“Mother`s belief that child`s behavior can be modified”and one was on“Mother`s
encourage-ment of developencourage-mental advances”. These questions and other questions on the child`s
stimula-tion and learning environment, such as number of toys and books in the home, hours of play with other children and attendance to anganwadi centre (childcare) were asked the caregivers during the sessions.
Childhood illnesses and growth. At the biweekly field worker visits, mothers were asked
about diarrheal illness, symptoms of respiratory infections and fever on any day since the last visit, and whether treatment had been sought for any illness. Respiratory rates were counted twice at each visit, temperature was measured and the child was examined for signs of
dehydra-tion if diarrhea or vomiting were present. Diarrhea was defined as the passage of3 loose or
watery stools in a 24-h period. ALRI was defined as cough or difficult breathing with elevated
respiratory rate above the age-specific cut-off values (50 breaths per min in infants and40
Anthropometry was assessed through weight and length measurements at baseline and end study at the study clinic. Weight was measured to the nearest 50 g using Digitron scales. Height was measured using locally manufactured infantometers reading to the nearest 0.1 cm.
Data management and statistical analyses
The data was double entered by two data entry operators followed by validation. A total of 0.21% of the ASQ-3 responses were missing. For missing items an adjusted total score was
computed by dividing the total subscale score by the number of completed items [18]. This
number was then added depending on the amount of items missing. For each child, we summed up the item scores to five total subscale scores, and a total ASQ-3 score. We measured the association of relevant independent variables with the total ASQ-3 in multiple linear
regres-sion models. We selected the variables for the regresregres-sion models as described elsewhere [19].
The variables that were included in the initial crude models were: number of family members,
mother’s age, mother’s year of schooling, father’s year of schooling, if family owns television or
scooter or cooler, annual family income, joint versus nuclear family, attendance in anganwadi, number of toys in the family, family owns books, number of children in the family, hours of play with other children during the week, mothers belief that child`s behavior can be modified, mothers encouragement of developmental advances, height for age z-scores (HAZ), weight for height z-scores (WHZ), number of days with diarrhea, incidents of clinical pneumonia and in-cidents of ALRI. Due to collinearity, weight for age z-scores were not included in the adjusted models. We confirmed this manual model by selecting variables in an automatic stepwise linear regression procedure. For the regression models the log-transformed values of annual family income and the log(base2) transformed values of days of diarrhea were used.
For the total ASQ-3 score, we present the selected variables in groups using a hierarchical
(nested) regression approach [20]. The variable groups are: stimulation and learning
opportu-nities (number of toys in the family, family owns books, hours of play with children during the week, mothers belief that child`s behavior can be modified, mothers encouragement of devel-opmental advances), growth (HAZ and WHZ) and childhood illnesses (number of days with diarrhea and incidence of clinical pneumonia). The variable groups were entered in the analysis in different steps constituting different models. For instance, stimulation and learning opportu-nities was entered in step 1 constituting model 1. In model 4 growth variables were added, and in model 7 the childhood illnesses variables were added to a full model. The remaining models (2, 3, 5 and 6) constitute different constellations of the variable groups alone and together. All regression models were adjusted for child characteristics (sex, age and breastfeeding status) and annual family income. The child characteristics variables were included regardless of their significance or influence on the other variables in the initial crude models.
The scores of the five subscales were highly skewed and categorized on the 25thpercentile in
the multiple logisitic regression analysis. The selection of variables followed the same
proce-dure as for main regression analysis. Only variables with P>0.05 are presented in the table.
Data was analyzed in Stata version 12.
Results
Of the 440 children three children were not available for assessment and 15 refused to partici-pate. The final number of participants was 422.
Demographic Characteristics
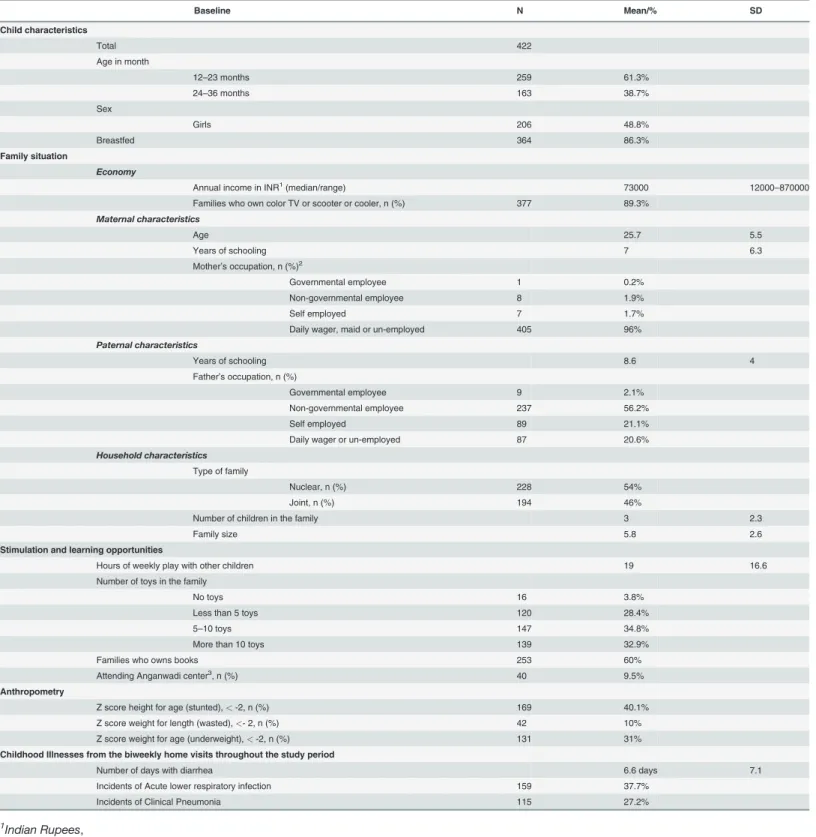
Demographic information of the children in the cohort is shown inTable 1. There was an even
Table 1. Demographic and clinical characteristics of children in the cohort.
Baseline N Mean/% SD
Child characteristics
Total 422
Age in month
12–23 months 259 61.3%
24–36 months 163 38.7%
Sex
Girls 206 48.8%
Breastfed 364 86.3%
Family situation
Economy
Annual income in INR1(median/range) 73000 12000
–870000 Families who own color TV or scooter or cooler, n (%) 377 89.3%
Maternal characteristics
Age 25.7 5.5
Years of schooling 7 6.3
Mother’s occupation, n (%)2
Governmental employee 1 0.2% Non-governmental employee 8 1.9%
Self employed 7 1.7%
Daily wager, maid or un-employed 405 96%
Paternal characteristics
Years of schooling 8.6 4
Father’s occupation, n (%)
Governmental employee 9 2.1% Non-governmental employee 237 56.2%
Self employed 89 21.1%
Daily wager or un-employed 87 20.6%
Household characteristics
Type of family
Nuclear, n (%) 228 54%
Joint, n (%) 194 46%
Number of children in the family 3 2.3
Family size 5.8 2.6
Stimulation and learning opportunities
Hours of weekly play with other children 19 16.6 Number of toys in the family
No toys 16 3.8%
Less than 5 toys 120 28.4%
5–10 toys 147 34.8%
More than 10 toys 139 32.9%
Families who owns books 253 60%
Attending Anganwadi center3, n (%) 40 9.5%
Anthropometry
Z score height for age (stunted),<-2, n (%) 169 40.1% Z score weight for length (wasted),<- 2, n (%) 42 10% Z score weight for age (underweight),<-2, n (%) 131 31%
Childhood Illnesses from the biweekly home visits throughout the study period
Number of days with diarrhea 6.6 days 7.1
Incidents of Acute lower respiratory infection 159 37.7% Incidents of Clinical Pneumonia 115 27.2%
1
Indian Rupees,
2
One mother is deceased,
3
Childcare center
were stunted (<-2 HAZ), 10% were wasted (<-2 WHZ) and 31% were underweight (<-2
WAZ). The average days of diarrhea during the study period, were 6.6 days (SD: 7.1), 14% of
the children had no episodes of diarrhea, 53.3% had between 1–7 days and 32.7% had between
8–49 days with diarrhea during the 6 months period. At least one episode of ALRI was reported
in 37.7%, and clinical pneumonia in 27.2% throughout the observation period.
Predictors for developmental status
The predictors for the total ASQ-3 scores are shown inTable 2. All models were adjusted for
child characteristics and annual family income. These variables explained 4.7% of the variation in the total ASQ-3 score alone. In the full model (model 7), all variables together explained 30.5% of the variation.
Table 2. Hierarchical Regression Analysis for variables predicting total ASQ-3 scores in North Indian children 12–36 months1.
Model 1 Model 2 Model 3 Model 4 Model 5 Model 6 Model 7
Adjusted for Child Characteristics and annual family income2
VARIABLES B3(SE) B (SE) B (SE) B (SE) B (SE) B (SE) B (SE) β4
Stimulation and learning opportunities
Number of toys
More than 10 toys ref. ref. ref. ref.
6–10 toys in the home -4.4 (5.4) -2.9 (5.3) -2.2 (5.4) -2.4 (5.2) 1–5 toys in the home -5.8 (5.8) -4.0 (5.8) -2.8 (5.9) -3.4 (5.7) No toys in the home -68.5***(12.0) -59.9***(12.0) -61.6***(12.1) -57.9***
(11.9)
-0.21
Family own books (ref. No books)
4.9 (4.5) 5.7 (4.4) 5.7 (4.5) 7.0 (4.4)
Hours of weekly play with other children
0.6***(0.1) 0.6***(0.1) 0.6***(0.1) 0.6***
(0.1)
0.20
Mother`s belief that child`s behavior can be modified (ref. No modification)
14.2**(5.0) 13.2**(4.9) 12.4*(4.9) 11.7*
(4.9)
-0.11
Mother`s encouragement of developmental advances (ref. No encouragement)
18.0**(5.4) 17.7**(5.3) 17.0**(5.4) 17.2**
(5.3)
-0.16
Growth
Height for age z-scores 7.8***(2.2) 5.6*(2.0) 7.5**(2.1) 5.4*
(2.0)
0.12
Weight for height z-scores 7.4**(2.6) 5.4*(2.4) 6.9**(2.6) 5.0*
(2.4)
0.09
Childhood Illnesses
Number of days with Diarrhea -5.7**(1.8) -5.1**(1.6) -5.2**(1.8) -5.0**
(1.6)
-0.13
Incidents of Clinical Pneumonia
-12.6*(5.3) -8.9 (4.9) -12.1*(5.2) -9.4 (4.8) -0.08
Observations 421 421 421 421 421 421 421
R-squared 0.251 0.104 0.086 0.279 0.284 0.137 0.305
***p<.001, **p<.01, *p<.05,
1For the 422 assessed children, the mean total ASQ-3 score was 231.9 (SD = 50) with scores ranging from a minimum of 30 to a maximum of 300. 2All models are adjusted for child characteristics (age, sex and breastfeeding status), and annual family income,
3unstandardized Beta coef
ficient,
4standardized regression coef
ficient, Beta values for model 7 only.
Stimulation and learning opportunities. Stimulation and learning opportunities adjusted for child characteristics and annual family income, explained most of the variation in the total
ASQ-3 scores alone by 25.1% (Table 2, model 1). When growth was added (Table 2, model 4),
27.9% of the variation was explained, while 28.4% was explained in the model including
stimu-lation and learning opportunities and childhood illnesses (Table 2, model 5). Four variables of
the stimulation and learning opportunities were significantly associated with the ASQ-3 score. Compared to those who had more than ten toys, those who had no toys in the home had
sub-stantially lower ASQ-3 scores (p<0.001 in all models). Number of hours of weekly play with
other children (p<0.001 in all models), mother`s belief that child`s behavior can be modified
(p<0.01 and p<0.05) and mother`s encouragement of developmental advances (p<0.01 in all
models) were all positively and significantly associated with the total ASQ-3 score.
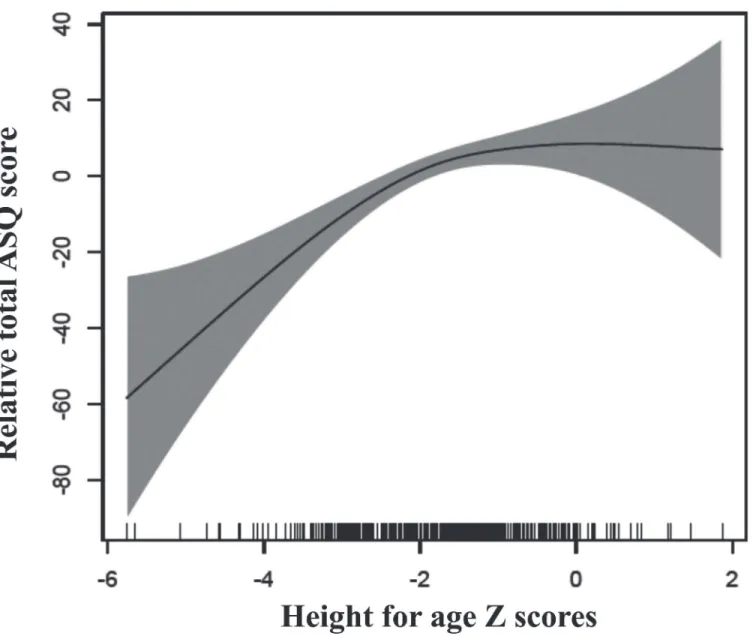
Growth. Growth alone explained 10.4% of the variation in the total ASQ-3 score (Table 2,
model 2), and when including childhood illnesses these explained 13.7% together (Table 2,
model 6). HAZ and WHZ were positively and significantly associated with the total ASQ-3
score in all models (p<0.001, p<0.01, p<0.05), however the coefficients were attenuated when
stimulation and learning opportunities was included.Fig. 1shows the relationship between
HAZ and the total ASQ-3 score in generalized additive models (GAM).
Childhood illnesses. The adjusted analysis of the childhood illnesses variables explained
8.6% of the variation in the total ASQ-3 score alone (Table 2, model 3). Number of days with
diarrhea was negatively and significantly associated with the total ASQ-3 score (p<0.01 in all
models).Fig. 2shows the relationship between number of days with diarrhea and the total
ASQ-3 score. Clinical pneumonia was significantly associated with the total ASQ-3 score in
models where stimulation and learning opportunities was not present (p<0.05 in both models)
(Table 2, model 3 and 6).
Variables predicting the ASQ-3 subscales. Table 3shows the predictors for the ASQ-3
subscale scores from logistic regression models. Number of days with diarrhea was significantly associated with the Fine motor and Problem- solving subscales, and incidents of pneumonia with Communication and Fine motor subscales. HAZ was significantly associated with the Gross motor subscale only, while WHZ was significantly associated with the
Communication subscale.
Discussion
We were able to explain 30.6% of the variation in the total ASQ-3 score by the included predic-tors for neurodevelopment. Stimulation and learning opportunities was the variable group that explained most of the variation. Growth was also independently associated with developmental status. Furthermore, the variable days of diarrhea was an independent and consistent predictor for the ASQ-3 scores.
Factors in children`s home environment, such as responsive caregiving and early learning
opportunities are of indisputable importance for child development [2,21]. In our results this is
clearly demonstrated by the variables on stimulation and learning opportunities explaining most of the variability of the neurodevelopmental scores alone. Stunting is another
well-estab-lished risk factor for adverse neurodevelopmental outcomes [12]. This is supported in our
study by the linear relationship between the ASQ-3 scores and HAZ-scores below -2, where the
total ASQ-3 scores increase with increasing HAZ scores (Fig. 1). Furthermore, HAZ was
Each doubling of the number of days with diarrhea was associated with an average decre-ment of approximately five ASQ-3 points. The plots from the GAM revealed that this relation
was linear (Fig. 2). Our results support previous findings, for example from a prospective
co-hort study in Brazil, reporting of associations between early childhood diarrhea and various
de-velopmental domains in later childhood [7–9]. These reports have been criticized, however, for
not adequately adjusting for environmental and health related factors, as well as for their low sample size. Furthermore, it has been argued that stunting is a relevant cofounder in the associ-ation between diarrhea and cognitive development and that diarrhea morbidity only has an
ef-fect on the developing brain through stunting [4,6,10]. By demonstrating the significant
association between diarrhea and neurodevelopment independent of growth, the present study improved upon previous findings. The assessment of illnesses was conducted biweekly for six
Fig 1. Associations between height for age z-scores and changes in ASQ-scores.The graphs were constructed using generalized additive models in R, the solid line depicts the association of the ASQ-score and HAZ. The Y-axis is centered on the mean total ASQ-score. The shaded area spans the 95% confidence interval of this association.
months and we have information on several potential confounders, the results are thus based on a more extensive assessment then previous studies.
Analysis on the separate ASQ-3 subscales show that when adjusting for the other variables in the model, an increase in days of diarrhea was associated with an increased risk of being in the lower quartile in skills of fine motor and problem-solving abilities. Increasing HAZ was as-sociated with a reduced risk of being in the lower quartile of the gross motor domain alone, while being wasted was associated with an increased risk of being in the lower quartile of com-munication skills. These differences may show that there are different pathways between those of diarrhea and growth and brain development, underscoring that the effect of diarrhea not only works through stunting. The independent association of diarrhea revealed in our results suggests that reducing diarrhea prevalence in children may be an important measure to enhanced neurodevelopment.
Fig 2. Associations between log (base2) days of diarrhea and changes in ASQ-scores.The graphs were constructed using generalized additive models in R, the solid line depicts the association of the total ASQ-score and log (base2) days of diarrhea. The Y-axis is centered on the mean total ASQ-score. The shaded area spans the 95% confidence interval of this association.
Various mechanisms may be involved in the impact of diarrhea diseases on brain
develop-ment, such as for instance inflammation and/or reduced nutrient intake [22]. A possible
indi-rect effect of childhood illnesses is the process of“functional isolation”where the child due to
behavioral consequences of its condition face difficulties in eliciting appropriate caregiving
be-havior, and consequently fails to develop according to potential [23,24]. The hypothesis of
“functional isolation”may in part explain why children burdened with pneumonia and/or
diar-rhea in our study have lower scores. Infected children may be weak, apathetic and irritable, and thus represent a challenge for the caregiver to provide proper responsive care.
Findings from a previous Peruvian study indicate that the various etiology of the diarrhea illness affect brain development differently, which also could explain why some studies find an
association between diarrhea and neurodevelopment while other do not [4,22,25]. A limitation
of our study is that the enrollment lasted for less than a year, and since it does not encompass all seasons, does not include all the variations of diarrhea illnesses. Thus, due to the lack of in-formation on etiology in our study, our ability to demonstrate variations is limited. Develop-mental assessments were conducted immediately following the six months intensive follow-up,
Table 3. Variables predicting ASQ-3 subscale score in North Indian children 12–36 months1.
Communication Gross Motor Fine Motor Problem Solving Personal Social
VARIABLES Odds Ratio (CI) Odds Ratio (CI) Odds Ratio (CI) Odds Ratio (CI) Odds Ratio (CI)
Child Characteristics and Socioeconomics status
Age in months 0.95**(0.92–1.00) 1.04**(1.01–1.08)
Mothers years of schooling 0.92**(0.88–0.97)
Annual family income 0.63*(0.44–0.90) 0.69*(0.50–0.96)
Stimulation and learning opportunities
Number of toys in the home
More than 10 toys in the home ref. ref. ref. ref. ref.
6–10 toys in the home
1–5 toys in the home 1.91*(1.04–3.50)
No toys in the home 11.04**(2.69–45.29) 3.88*(1.08–13.91) 4.31*(1.34–21.79) Family own books (ref. No books)
Hours of weekly play with other children
0.98*(0.97–1.00) 0.98***(0.96–
0.99)
0.97***(1.90–4.86) 0.98**(0.97–0.99)
Mother`s belief that child`s behavior can be modified (ref. No modification)
0.34***(0.52– 0.22)
Mother’s encouragement of developmental advances (ref. No encouragement)
0.58*(0.53–0.21) 0.33***(0.53–0.21) 0.47**(0.99–0.93)
Growth
Height for age z-scores 0.69***(0.56–0.84)
Weight for height z-scores 0.67**(0.51–0.86)
Childhood Illnesses
Number of days with diarrhea 1.26**(1.07–1.49) 1.19*(1.01–1.40)
Incidents of Clinical Pneumonia 1.85*(1.13–3.03) 1.63*(1.00–2.62)
***p<.001, **p<.01,
*p<.05, logistic regression P-value, 1
For the 422 assessed children, the mean subscales scores vary from 44.8 to 47.8, all with a range from 0 to 60.
and thus a second limitation of our study, is the lack of information on long-term effects of the risk- and protective factors.
The ASQ-3 has not been formally validated for a North Indian population. To our knowl-edge, there are currently no up to-date-tests for this age group formally validated for this set-ting. However, particular for this study, we translated and adjusted the relevant ASQ-3 forms for our age groups following official recommendations. This process and its evaluation have
been described elsewhere [16]. The ASQ-3 has been used previously in a clinical setting in
North India [26], as well as in research in LMIC [27], and it`s sensitivity and specificity have
proven to be satisfying [28]. In the present study the ASQ-3 served as a feasible tool for the
pur-pose of collecting reliable data on developmental status in our population. Both the total and subscale scores differentiated between variables, and several variables that predicted the total
ASQ-3 score confirm previous findings in this field of research [2,3]. However, since the
ASQ-3 is constructed as a screening test and not a diagnostic test, it is important to underscore that diagnosis of developmental delays requires a more sophisticated confirmatory test that was not performed here.
For vulnerable children in LMIC targeted interventions to improve neurodevelopment are
called for [29]. Studies have demonstrated that interventions should include both factors of
re-sponsive caregiving and learning opportunities, and nutrition for the greatest impact on early
child development [21,30]. Our study provides support for these results, and furthermore, that
the continuing work to reduce the burden of diarrhea illness among vulnerable children may be an important step towards enabling children to fulfill their potential. In other words, the im-portance of reducing the burden of illnesses may not only be important for the reduction of childhood mortality, but also to enhance quality of life through improved brain development.
Acknowledgments
We also acknowledge the input from Professor Halvor Sommerfelt at Centre for International Health, University of Bergen, Norway as well as from Gagandeep Kang, Wellcome Trust Re-search Laboratory, Department of Gastrointestinal Sciences, Christian Medical College, Vel-lore, Tamil Nadu, India. We thank Ms. Baljeet Kaur for help with the statistical analysis. And finally the folate and vitamin B12 study group: Sanjana Mohan, Madhu Mahesh, Pooja Gupta, Divya Pandey, Pankaj Bhardwaj and Vandna Suri.
Author Contributions
Conceived and designed the experiments: IK ST TK NB TAS. Performed the experiments: ST TK NB. Analyzed the data: IK MH TAS. Contributed reagents/materials/analysis tools: ST TK NB TAS. Wrote the paper: IK ST TK MH NB TAS.
References
1. Hamadani JD, Huda SN, Khatun F, Grantham-McGregor SM (2006) Psychosocial stimulation improves the development of undernourished children in rural Bangladesh. The Journal of nutrition 136: 2645– 2652. PMID:16988140
2. Walker SP, Wachs TD, Grantham-McGregor S, Black MM, Nelson CA, Huffman SL, et al. (2011) In-equality in early childhood: risk and protective factors for early child development. The Lancet 378: 1325–1338. doi:10.1016/S0140-6736(11)60555-2PMID:21944375
3. Walker SP, Wachs TD, Gardner JM, Lozoff B, Wasserman GA, Pollitt JAC. et al. (2007) Child develop-ment in developing countries 2—Child development: risk factors for adverse outcomes in developing countries. Lancet 369: 145–157. PMID:17223478
5. Santos DN, Assis AMO, Bastos ACS, Santos LM, Santos CAST, Strina A, et al. (2008) Determinants of cognitive function in childhood: a cohort study in a middle income context. BMC Public Health 8: 202. doi:10.1186/1471-2458-8-202PMID:18534035
6. Walker CL, Rudan I, Liu L, Nair H, Theodoratou E, Bhutta ZA, et al. (2013) Global burden of childhood pneumonia and diarrhoea. Lancet 381: 1405–1416. doi:10.1016/S0140-6736(13)60222-6PMID:
23582727
7. Niehaus MD, Moore SR, Patrick PD, Derr LL, Lorntz B, Lima AAM, et al. (2002) Early childhood diar-rhea is associated with diminished cognitive function 4 to 7 years later in children in a northeast Brazil-ian shantytown. The American journal of tropical medicine and hygiene 66: 590–593. PMID:12201596 8. Patrick PD, Oriá RB, Madhavan V, Pinkerton RC, Lorntz B, Lima AAM, et al. (2005) Limitations in verbal
fluency following heavy burdens of early childhood diarrhea in Brazilian shantytown children. Child Neuropsychology 11: 233–244. PMID:16036449
9. Lorntz B, Soares AM, Moore SR, Pinkerton R, Gansneder B, Bovbjerg VE, et al. (2006) Early childhood diarrhea predicts impaired school performance. The Pediatric infectious disease journal 25: 513–520. PMID:16732149
10. Walker CLF, Lamberti L, Adair L, Guerrant RL, Lescano AG, Martorell R, et al. (2012) Does Childhood Diarrhea Influence Cognition Beyond the Diarrhea-Stunting Pathway? PloS one 7: e47908. doi:10. 1371/journal.pone.0047908PMID:23118906
11. Crosby L, Jayasinghe D, McNair D (2013) Food for Thought. Tacling child malnutrtion to unlock poten-tial and boost prosperity. London: The Save the Children Fund.
12. Grantham-McGregor S, Cheung YB, Cueto S, Glewwe P, Richter L, Strupp B, et al. (2007) Child devel-opment in developing countries 1—Develdevel-opmental potential in the first 5 years for children in develop-ing countries. Lancet 369: 60–70. PMID:17208643
13. Taneja S, Strand TA, Kumar T, Mahesh M, Mohan S, Manger MS, et al. (2013) Folic acid and vitamin B-12 supplementation and common infections in 6-30-mo-old children in India: a randomized placebo-controlled trial. Am J Clin Nutr 98: 731–737. doi:10.3945/ajcn.113.059592PMID:23902779 14. Squires J, Bricker D (2009) Ages & Stages Questionnaires [R], (ASQ-3 [TM]): A Parent-Completed
Child-Monitoring System. Brookes Publishing Company.
15. World Health Organization website. Available:http://www.who.int/substance_abuse/research_tools/ translation/en/.
16. Kvestad I, Taneja S, Kumar T, Bhandari N, Strand TA, Hysing M, et al. (2013) The assessment of devel-opmental status using the ages and stages questionnaire-3 in nutritional research in north Indian young children. Nutrition Journal 12: 1–11. doi:10.1186/1475-2891-12-1PMID:23282226
17. Bradley RH, Corwyn RF (2005) Caring for children around the world: A view from HOME. International Journal of Behavioral Development 29: 468–478.
18. Squire J, Twombly E, Bricker D, Potter L (2009) ASQ-3: User`s Guide. Baltimore: Paul H. Brookes Publishing Co.
19. Hosmer DW, Lemeshow S (2000) Applied Logistic Regression. New York: John Wiley & Sons, INC
20. Acock AC (2012) A Gentle Introduction to Stata. Texas: Stata Press.
21. Black MM, Aboud FE (2011) Responsive feeding is embedded in a theoretical framework of responsive parenting. J Nutr 141: 490–494. doi:10.3945/jn.110.129973PMID:21270366
22. Petri WA Jr, Miller M, Binder HJ, Levine MM, Dillingham R, Guerrant RL, et al. (2008) Enteric infections, diarrhea, and their impact on function and development. The Journal of clinical investigation 118: 1277. doi:10.1172/JCI34005PMID:18382740
23. Lozoff B, Klein NK, Nelson EC, McClish DK, Manuel M, Chacon ME, et al. (1998) Behavior of Infants with Iron‐Deficiency Anemia. Child development 69: 24–36. PMID:9499554
24. Black MM, Baqui AH, Zaman K, Persson LA, El Arifeen S, Le K, et al. (2004) Iron and zinc supplemen-tation promote motor development and exploratory behavior among Bangladeshi infants. American Journal of Clinical Nutrition 80: 903–910. PMID:15447897
25. Oriá RB, Costa CMC, Lima AAM, Patrick PD, Guerrant RL (2009) Semantic fluency: A sensitive marker for cognitive impairment in children with heavy diarrhea burdens? Medical hypotheses 73: 682–686. doi:10.1016/j.mehy.2009.05.013PMID:19520520
26. Juneja M, Mohanty M, Jain R, Ramji S Ages and Stages Questionnaire as a Screening Tool for Devel-opmental Delay in Indian Children. Indian pediatrics.
28. Limbos MM, Joyce DP (2011) Comparison of the ASQ and PEDS in screening for developmental delay in children presenting for primary care. Journal of Developmental & Behavioral Pediatrics 32: 499–511.
29. Engle PL, Black MM, Behrman JR, de Mello MC, Gertler PJ, Kapiriri L, et al. (2007) Child development in developing countries 3—Strategies to avoid the loss of developmental potential in more than 200 mil-lion children in the developing world. Lancet 369: 229–242. PMID:17240290