Spatial distribution and
socioeconomic context
of tuberculosis in Rio de
Janeiro, Brazil
I Serviço de Epidemiologia. Hospital Federal dos Servidores do Estado. Ministério da Saúde. Rio de Janeiro, RJ, Brasil II Departamento de Medicina Preventiva.
Faculdade de Medicina. Centro de Ciências da Saúde. Universidade Federal do Rio de Janeiro. Rio de Janeiro, RJ, Brasil III Instituto de Estudos em Saúde Coletiva.
Centro de Ciências da Saúde. Universidade Federal do Rio de Janeiro. Rio de Janeiro, RJ, Brasil
IV Núcleo de Geoprocessamento. Instituto de Comunicação e Informação Científica e Tecnológica em Saúde. Fundação Oswaldo Cruz. Rio de Janeiro, RJ, Brasil
Correspondence:
Alessandra Gonçalves Lisbôa Pereira Hospital Federal dos Servidores do Estado Serviço de Epidemiologia
Rua Sacadura Cabral, 178 Saúde 20221-903 Rio de Janeiro, RJ, Brasil E-mail: [email protected] Received: 3/26/2014
Approved: 10/27/2014
ABSTRACT
OBJECTIVE: To analyze the spatial distribution of risk for tuberculosis and its socioeconomic determinants in the city of Rio de Janeiro, Brazil.
METHODS: An ecological study on the association between the mean incidence rate of tuberculosis from 2004 to 2006 and socioeconomic indicators of the Censo Demográico (Demographic Census) of 2000. The unit of analysis was the home district registered in the Sistema de Informação de Agravos de Notiicação (Notiiable Diseases Information System) of Rio de Janeiro, Southeastern Brazil. The rates were standardized by sex and age group, and smoothed by the empirical Bayes method. Spatial autocorrelation was evaluated by Moran’s I. Multiple linear regression models were studied and the appropriateness of incorporating the spatial component in modeling was evaluated.
RESULTS: We observed a higher risk of the disease in some neighborhoods of the port and north regions, as well as a high incidence in the slums of Rocinha and Vidigal, in the south region, and Cidade de Deus, in the west. The inal model identiied a positive association for the variables: percentage of permanent private households in which the head of the house earns three to ive minimum wages; percentage of individual residents in the neighborhood; and percentage of people living in homes with more than two people per bedroom.
CONCLUSIONS: The spatial analysis identiied areas of risk of tuberculosis incidence in the neighborhoods of the city of Rio de Janeiro and also found spatial dependence for the incidence of tuberculosis and some socioeconomic variables. However, the inclusion of the space component in the inal model was not required during the modeling process.
DESCRIPTORS: Tuberculosis, epidemiology. Spatial Analysis. Risk Factors. Socioeconomic Factors. Linear Models.
Alessandra Gonçalves Lisbôa
PereiraI
Roberto de Andrade MedronhoII
Claudia Caminha EscosteguyI
Luis Iván Ortiz ValenciaIII
Mônica de Avelar Figueiredo
Tuberculosis is a neglected disease,10 which is endemic in several countries and accounts for about 1.3 million deaths annually.a It is estimated that one third of the world population is infected with Mycobacterium tuberculosis and is, therefore, at risk of developing the disease. Approximately 95.0% of the cases occur in developing countries.b In 2012, the worldwide esti-mated incidence of tuberculosis was 122 cases/100,000 inhabitants, and about 12 million prevalent cases in the world. In that year, Brazil was among the 22 countries with the highest disease burden, totaling 40,152 cases reported with the presence of resistant acid-fast bacilli in the sputum, and an incidence rate of 46 cases/100,000 inhabitants.a Rio de Janeiro is the Brazilian state with the highest occurrence rate.c
Besides the contact with patients with smear-positive tuberculosis, the probability for an individual to be infected and develop the disease depends on several factors, including socioeconomic conditions and the existence of comorbidities, particularly immunosup -pressive ones.b Poverty, malnutrition, poor sanitation, high population density, acquired immunodeiciency syndrome and population aging are currently some of the factors involved in the spreading and severity of the illness.10 The association between incidence of tubercu-losis and socioeconomic variables, described in several studies, corroborates the high disease burden observed in the so-called developing countries such as Brazil.1,4,9,15,16
The use of spatial analysis in public health covers many different topics. The incorporation of new technolo-gies and access to secondary databases allowed for this type of analysis to be used more widely. In the 2000s, several studies have been published on the distribution and determinants of communicable and noncommuni-cable diseases, focusing on different approaches.1,12,18
Thus, the objective of this study was to analyze the spatial distribution of risk for tuberculosis and its socio-economic determinants in the city of Rio de Janeiro.
METHODS
This is an ecological study conducted in the city of Rio de Janeiro, RJ, Southeastern Brazil, on the association INTRODUCTION
between the mean tuberculosis incidence rate over three years (2004, 2005, and 2006), and socioeco -nomic indicators obtained from the Censo Demográico (Demographic Census) of 2000. The unit of analysis was the self-reported home district.
The city of Rio de Janeiro, occupies a total area of 1,182 km², and 70.0% of it is populated by human beings. The estimated population in 2006 was 6,136,652 inhabitants living in 160 neighborhoods spread over ive health surveillance areas.d Because the neighborhoods of Vasco da Gama and Gericinó did not oficially exist in 2000, this study considered the information of 158 neighborhoods.
The socioeconomic indicators used were: income, education, water supply, waste collection, sewage and household population density. We also used the social progress index (SPI) – a synthetic index devel-oped to measure the degree of social development of a geographical area, allowing comparison with other areas of the same nature.e SPI includes dimensions related to sanitation, housing quality, educational attainment and availability of income. Other indica-tors used were Theil’s L, Gini index and the munic -ipal human development index (HDI), obtained at the Pereira Passos Institute. We also included: life expec-tancy at birth (in years); adult literacy rate (%); crude school attendance rate (%); and per capita income (in Brazilian Reais [BRL]) of 2000.
To estimate the incidence of tuberculosis in the city of Rio de Janeiro, we used the Sistema de Informação de Agravos de Notiicação (SINAN – Notiiable Diseases Information System), selecting only new cases of tuberculosis of people living in the city notiied to Epidemiological Surveillance from 2004 to 2006. Data were provided by the Municipal Health Department of Rio de Janeiro. Cases of people imprisoned were excluded from the analysis. The mean tuberculosis incidence rate of the three years of the study was used, considering the potential notification fluctuations between years. We proceeded to the standardization of incidence rates of each neighborhood by sex and age group using the direct method, and considering the population of the city of Rio de Janeiro as the standard.
a World Health Organization. Global tuberculosis report 2013. Geneva; 2013 [cited 2015 Feb 8]. Available from: http://apps.who.int/iris/ bitstream/10665/91355/1/9789241564656_eng.pdf
b Ministério da Saúde, Secretaria de Vigilância em Saúde, Departamento de Vigilância Epidemiológica. Guia de vigilância epidemiológica. 7.ed. Brasília (DF); 2009 [cited 2015 Feb 8]. (Série A. Normas e Manuais Técnicos). Available from: http://portal.saude.gov.br/portal/arquivos/ pdf/gve_7ed_web_atual.pdf
c Ministério da Saúde, Secretaria de Vigilância em Saúde, Departamento de Vigilância Epidemiológica. Manual de recomendações para o controle da tuberculose no Brasil. Brasília (DF); 2011 [cited 2015 Feb 8]. Available from: http://www.cve.saude.sp.gov.br/htm/TB/mat_tec/ manuais/MS11_Manual_Recom.pdf
d Ministério da Saúde, DATASUS. Informações de saúde (Tabnet). Brasília (DF) [cited 2007 Sept 24]. Available from: http://tabnet.datasus.gov. br/cgi/tabcgi.exe?ibge/cnv/poprj.def
The age groups chosen were: zero to 19 years, 20 to 39 years, 40 to 59 years and 60 years or over, considering the distribution of the disease in the study population.
To minimize the instability caused by the random luc-tuation in rates, we used the local empirical Bayes esti-mation, which smoothens the standardized rates by applying weighted means, creating a third corrected rate. This rate considered population density and mean local rate, estimated from a spatial proximity matrix.
The correlation between the dependent and independent variables was assessed during the exploratory phase of the study by the Spearman correlation coeficient at a signiicance level of 5%.
Spatial autocorrelation was evaluated by Moran’s I, which tests the spatial dependence of the observations and is estimated from a pre-established neighborhood parameter. It can range from -1 to +1, the negative values being indicators of negative or inverse auto-correlation, and the positive, of spatial aggregation or direct correlation.6 The level of signiicance for spatial autocorrelation was p < 0.05.
To incorporate spatial effects in this study, we assessed the use of a spatial regression model with global effect called Conditional AutoRegressive (CAR). It is a linear model that captures the spatial dependence of the dependent variable in a single parameter, considering that the spatial process is stationary. This parameter is assigned to the error of the regression model, so that:
Y = Xβ + ε; ε = ρWε + ξ
in which:
Wε = error with spatial effects
ρ = measure of spatial correlation; the auto-regression coeficient
ξ = error component with constant and uncorrelated variance
The null hypothesis in this case is that there is no auto-correlation, resulting in ρ = 0.
Before CAR modeling, the independent variables were inserted in the multiple linear regression model, as suggested by Luc Anselin,f allowing to choose the variables most associated to the outcome for inclu-sion in the inal model, which would include spatial dependence. The inal multiple linear regression model used the natural logarithm of the corrected and stan-dardized mean incidence rate of the three years as the dependent variable, approximating its distribution to a normal curve.
The independent variables, which were continuous, did not suffer transformation, and the choice for including them in the modeling process was guided by the epide-miological context and the pre-built correlation matrix. The variables that presented higher correlation with the dependent variable were preferably chosen. Outliers were identiied by Cook’s D, which evaluates changes caused in the regression coeficients when a given observation is removed from the model.
To check the degree of multicollinearity between the variables in the inal model, tolerance and variance inlation factor were used. Homoscedasticity was graph-ically assessed in residual analysis. The independence of residuals, i.e., the absence of serial correlation was evaluated by the Durbin-Watson test (values lower than 2 imply possibility of correlation).
The softwares TerraView 3.1.3, SPSS 13.0, and S-Plus 4:55 were used for processing and analyzing data.
The study was approved by the Research Ethics Committee of the Municipal Health Department of Rio de Janeiro (Protocol 217/08, of 11/3/2008). The use of secondary bases was authorized by the responsible manager and the conidentiality of the patient identii-cation data was assured.
RESULTS
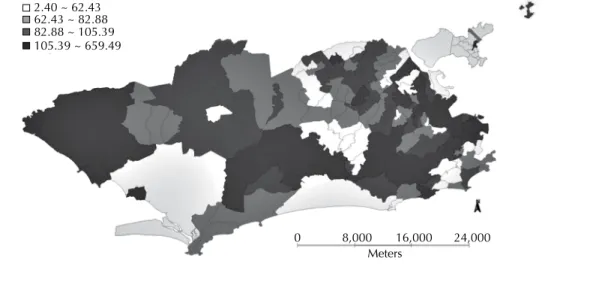
From 2004 to 2006, 16,869 new cases of tuberculosis were notiied among people living in the city of Rio de Janeiro with residential information. Of this total, 16.1% were residents of Campo Grande, Rocinha, Bangu and Santa Cruz. The Copacabana neighbor-hood, with the best HDI in the city, was the eighth in concentration of cases of the disease, accounting for 2.7% of the total. The mean crude incidence rate for three years was 95.9 cases/100,000 inhabitants, ranging from zero in neighborhoods with no reported cases (Campo dos Afonsos, Grumari, Joá, Parque Columbia and Vila Militar) to 869.2 cases/100,000 people in the Saúde neighborhood. Also noteworthy are the neigh-borhoods of Bonsucesso (647.7 cases/100,000 popula-tion), Jacaré (460.0 cases/100,000 populapopula-tion), Rocinha (447.3 cases/100,000 population), and Santo Cristo (436.7 cases/100,000 inhabitants). After standard-ization and correction by the local empirical Bayes method, Bonsucesso, Jacaré, Rocinha and Santo Cristo continued to show the highest incidence rates during the period studied, with Bonsucesso moving to the highest risk category (659.5 cases/100,000 population). In Saúde, a neighborhood with only 2,186 inhabitants, the mean incidence rate decreased almost 30.0%.
Standardized and corrected rates showed increased risk of illness in some neighborhoods of the port and north areas. There was also a high incidence in the slums of Rocinha and Vidigal, in the south region, and Cidade de Deus, in the west region. Rocinha, besides concen-trating a large absolute number of cases, also showed a very high incidence rate. Figure 1 shows the spatial distribution of the mean incidence rate, standardized by sex and age, and corrected.
The visualization of the spatial pattern allowed the identification of a “corridor” formed by areas of higher risk, starting at the port area (also comprising areas of Morro da Providência), extending to Estácio (including Complexo do Sao Carlos), Cidade Nova, Sao Cristovao, and then through Sao Cristovao, Benica, Manguinhos, Jacaré, Jacarezinho, Bonsucesso and Ramos. Neighboring areas such as Maré and Complexo do Alemao showed no such signiicant rates, the latter with a rate of 2.4 cases/100,000 inhabitants, the lowest among all neighborhoods. However, Inhaúma, close to Complexo do Alemao, presented a corrected and standardized rate of 155.2 cases/100,000 inhabitants.
Another place with a high incidence of the disease was Costa Barros (including Complexo da Pedreira), with 241.7 cases/100,000 inhabitants, not followed by neighboring areas. In the same area, only Anchieta and Barros Filho reached 103.4 and 103.2 cases/100,000 inhabitants, respectively. Pedra de Guaratiba, Sepetiba and Santa Cruz are neighborhoods in the west region that also had high incidence rates.
Table 1 shows the Spearman correlation coeficients. The variables that indicated better socioeconomic conditions, as the percentage of permanent households in which the head of the house received more than 10
minimum wages and SPI, showed inverse correlation with the incidence of tuberculosis. We observed the same for the municipal HDI. The percentage of house-holds with people living alone was positively corre-lated with the incidence of tuberculosis, as well as the percentage of people living in homes with density than two people per bedroom.
Table 2 presents some of the statistically signiicant results of global Moran’s I. The mean crude inci-dence rate showed a 0.161 index (p < 0.018), whereas the corrected and standardized rate showed an index of 0.218 (p < 0.007). We found signiicant spatial autocorrelation for several independent variables, including the percentage of households with people living alone, per capita income, percentage of perma-nent private households whose head received three to ive minimum wages and percentage of perma-nent households where the head received more than 10 minimum wages. At this stage of analysis, the Complexo do Alemao neighborhood was excluded for presenting a mean standardized corrected incidence rate of 2.40 cases/100,000 inhabitants (two notiied cases over three years), different from the rest of the data and incompatible with the number of cases expected in the neighborhood. The area had 65,026 inhabitants and the worst HDI of the city.
Several models were studied before we chose the inal one, shown in Table 3. During the modeling process, the need to include the spatial component in the regression model was evaluated, given that the dependent vari-able had signiicant spatial autocorrelation. The need to use the CAR model was reinforced by the spatial autocorrelation detection in the multiple linear regres-sion residual analysis based on Moran’s I. However, despite the existence of spatial autocorrelation for the
2.40 ~ 62.43 62.43 ~ 82.88 82.88 ~ 105.39 105.39 ~ 659.49
0 8,000
Meters
16,000 24,000
dependent variable in the exploratory phase of the study, the inclusion of the CAR model was not sufi -cient to remove the spatial dependence of residuals in this model. Thus, we decided to maintain multiple linear regression as the inal model.
The variables that remained in the final linear regression model were the percentage of permanent private households whose head received three to ive minimum wages, the percentage of households with people living alone in the neighborhood and the Table 1. Correlation between socioeconomic variables and mean standardized and corrected incidence rate. Rio de Janeiro, RJ, Southeastern Brazil, 2004 to 2006.
Variable Spearman correlation coefficient p
% permanent households whose head earns over 10 MW -0.41 < 0.001
Social development index -0.36 < 0.001
Life expectancy at birth -0.32 < 0.001
Municipal human development index -0.32 < 0.001
Longevity index -0.32 < 0.001
Per capita income -0.28 < 0.001
% households with people living alone 0.19 0.007
% makeshift homes 0.21 0.003
% permanent households whose head earns 3-5 MW 0.30 < 0.001
% people living in homes with a density higher than two people per bedroom 0.37 < 0.001
% illiteracy for people older than 15 years 0.39 < 0.001
% permanent households whose head earns up to 2 MW 0.42 < 0.001
MW: minimum wage
Table 2. Spatial autocorrelation of socioeconomic variables defined by neighborhood. Rio de Janeiro, RJ, Southeastern Brazil, 2000.
Variable Moran’s I Global Index p
% households with people living alone 0.72 0.001
Per capita income 0.63 0.001
% permanent households whose head earns over 10 MW 0.53 0.001
% permanent households whose head earns 3-5 MW 0.51 0.001
Social development index 0.51 0.001
Municipal human development index 0.50 0.001
Life expectancy at birth 0.43 0.001
Longevity index 0.43 0.001
% permanent households whose head earns up to 2 MW 0.37 0.001
% permanent households with adequate water supply 0.36 0.002
% people living in homes with a density higher than two people per bedroom 0.33 0.001
Adult literacy rate 0.33 0.001
% private households with adequate waste collection 0.27 0.002
% illiteracy for people older than 15 years 0.20 0.002
MW: minimum wage
Table 3. Final model of multiple linear regression to the mean log of the standardized and corrected incidence rate. Rio de Janeiro, RJ, Southeastern Brazil, 2004 to 2006.
Variable Coefficient Standard error t p IC95%
% households whose head earns 3-5 MW 0.050 0.011 4.614 < 0.001 0.028;0.071
% households with people living alone 0.049 0.009 5.260 < 0.001 0.030;0.067
% people living in homes with more than two people per bedroom 0.024 0.005 4.927 < 0.001 0.015;0.034
percentage of people living in households with more than two people per bedroom.
The proposed model explains approximately 30.0% of the incidence of tuberculosis in the neighborhoods of the city of Rio de Janeiro during the period studied (R2 = 0.299).
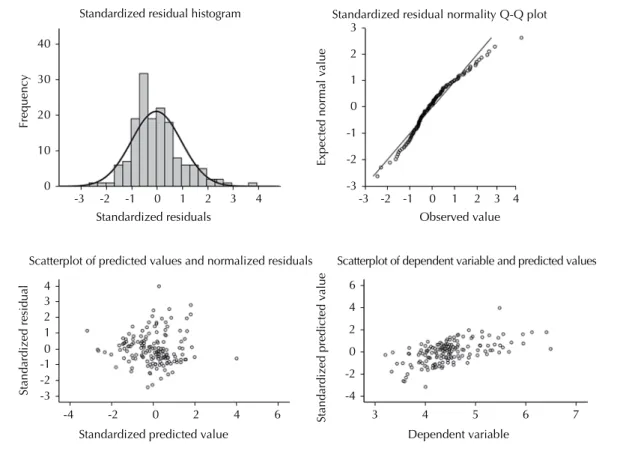
The variance inflation factor and the tolerance test suggested a low level of collinearity among the vari-ables included in the inal model. The variance inla -tion factor was < 10, the greatest being 2,039, and the tolerance test was > 0.1 for all variables. The existence of possible outliers was assessed by estimating Cook’s distance, which satisfactorily ranged from 0 to 0.065 in the observed units. The residual independence assump-tion was fulilled, given that the Durbin-Watson test result was 2.275. Figure 2 summarizes the residual analysis. The histogram and Q-Q plot exhibit normal residual patterns. The random pattern of the scatter-plot of the predicted values and standardized residuals strengthens the hypothesis of constant variance. Thus, we may assume that the model is homoscedastic. The last graph, a scatterplot between the dependent variable and the predicted values, although not perfectly adjusted, points to a reasonable adjustment of the inal model.
DISCUSSION
The pattern of distribution of tuberculosis cases, repre-sented by the mean incidence rate of the three studied years, shows a predominance of the disease in some neighborhoods of the northern, western and central/ port areas. The southern area, which gathers neigh-borhoods with better socioeconomic conditions, also exhibits extremely poor areas such as the Rocinha and Vidigal slums, with high incidence rates of the disease. We considered removing Complexo do Alemao from the regression analysis because it is not possible to rule out the possibility of undernotiication of cases from this neighborhood. The cases of tuberculosis in resi-dents of this community in the analyzed period may have been referred to a neighboring district to ill in the notiication/investigation report.
The noninclusion of spatial dependence in the inal model was also reported by Acosta,g in Porto Alegre, RS, Southern Brazil, who evaluated the correlation between the incidence of tuberculosis in the neighborhoods and their socioeco-nomic conditions. Acosta also did not identify any spatial autocorrelation between variables during the multiple linear regression evaluation of residuals. The inal model identi -ied no spatial association between the incidence of tuber-culosis and the following variables: mortality rate due to
external causes; proportion of households with six or more residents; aging index; and proportion of households with monthly income over 10 minimum wages.
This study identiied a statistically signiicant correla-tion between the incidence of tuberculosis and variables related to income, educational attainment, density of people per bedroom and per household. The direction of the association corroborates several studies describing the association between tuberculosis and poor socio-economic conditions.4,9,15,17
In the final model, one of the most important (and expected) indings from the logical point of view of disease transmission is the association between the incidence of tuberculosis and the existence of more than two people per bedroom in the household. Overcrowding either per household or per room is described in some studies7,18 as a situation associated with increased risk of tubercu-losis contamination, because of the greater likelihood of constant contact between people. Munch et al7 found a positive association between the incidence of tuberculosis and the variables unemployment rate and occurrence of population clusters. A study by Vieira18 identiied a signii -cant correlation between the incidence of tuberculosis and the urbanization factor when analyzing cities in the state of Espirito Santo. The urbanization factor was constructed from variables related to education, concentration of indi-viduals per bedroom, percentage of the population living in urban areas and percentage of individuals living in houses bought in their names or paid off.
Although controversial, the association between “living alone” and not adhering to the treatment has been described for several chronic diseases, including tubercu-losis. Gonçalves et al3 exposed the importance of family involvement in adherence to the tuberculosis treatment, considering the context of social integration of the indi-viduals. Natal et al8 analyzed predictors of abandonment of treatment and, in the inal predictive model, the vari -able “living alone” presented an 5.4 odds ratio (OR). Teixeirah examined the association between the condi-tion “people aged 65 and over living alone” and the inci -dence of tuberculosis. The association has been shown in men and, to a lesser extent, in women. But the author concluded that the age factor is more important than the fact that the patient lived alone. Our study has an inci-dence rate standardized by sex and age, and the effect of living alone remains in the inal model. Thus, this result, reinforced by previous studies, suggests vulnerability for this group of people. According to Mattosinhos,i over the past few years we have seen a decrease in family living arrangements in Brazil, with progressive growth of
g Acosta LMW. O mapa de Porto Alegre e a tuberculose: distribuição espacial e determinantes sociais [dissertation]. Porto Alegre (RS): Faculdade de Medicina da Universidade Federal do Rio Grande do Sul; 2008.
h Teixeira IA. Incidência da tuberculose, índice de desenvolvimento humano e indicadores de vulnerabilidade familiar: região metropolitana de Belo Horizonte: uma abordagem multivariada [thesis]. Belo Horizonte (MG): Universidade Federal de Minas Gerais; 2008.
models of single living arrangements (the percentage of people living alone in the last four censuses were: 4.9% in 1970; 5.8% in 1980; 6.5% in 1991; and 8.6% in 2000). Some of the actors that contribute to this increase are the intense process of urbanization, the increasing number of separations, the great decrease in fertility and the increase in life expectancy, with the growing number of older adults. It is noteworthy that, among the 15 studied neighborhoods with the highest percentage of households with people living alone, 10 were among the 15 neigh -borhoods with the highest percentage of older adults.
The role of older adults in endemic tuberculosis has been increasingly important, because as the world population ages, the greater is the vulnerability of this segment to endogenous reactivation and exogenous reinfection. In Brazil, studies show that the incidence of the disease is beginning to shift to the older age group and it is expected that, in a few decades, cases associated with acquired immunodeficiency syndrome progressively reduce, and that cases of reactivation in older adults increase.2,16
In this study, although all income variables were correlated with the incidence of tuberculosis in the initial exploratory analysis, the association that remained in the inal model refers to the income level of three to ive minimum wages
earned by the head of the household. Considering this income as a proxy for total household income, and the clas -siication proposed by Neri,j we can conclude that these families are inserted in the context of the middle class or “class C”. Some studies11,13,14 pointed to a potential asso-ciation between having tuberculosis and belonging to a middle range of monthly income, especially when consid-ering the current context of co-infection with HIV and the emergence of resistant forms. In Manaus, AM, Northern Brazil, the neighborhoods with the highest incidence of tuberculosis also showed an increase in HDI between 1991 and 2000, suggesting high population density and failures in the Programa de Controle da Tuberculose (Tuberculosis Control Program) as possible causes.13 In Olinda, PE, Northeastern Brazil, Souza et al14 sought to identify tuberculosis risk areas by evaluating socioeco-nomic factors and found the highest incidence rates asso-ciated with an intermediate level of social deprivation. Santos et al11 geo-referred cases of tuberculosis reported in Ribeirao Preto, SP, Southeastern Brazil, from 1990 to 2000, and identiied tuberculosis occurrence patterns, with the highest concentration of cases in neighborhoods clas-siied as middle class and lower middle class, in the north-west region of the city. Thus, many studies have shown risk of illness from tuberculosis regardless of extreme socioeconomic deprivation situation.
Figure 2. Graphs for diagnosis of model adjustment.
Frequency
Standardized residuals 40
30
20
10
0
-3 -2 -1 0 1 2 3 4
Expected normal value
Observed value 3
2
1
0
-1
-2
-3
2 3 4
1 0 -1 -2 -3
-3 -2 -1 0 1 2 3 4
Standardized residual
Standardized predicted value
-4 -2 0 2 4 6
4 6
2
0
-2
-4
Standardized predicted value
Dependent variable
3 4 5 6 7
Standardized residual histogram Standardized residual normality Q-Q plot
Scatterplot of predicted values and normalized residuals Scatterplot of dependent variable and predicted values
Some limitations of this study may relect the quality of the SINAN information related to the identiica-tion of the patient’s home district. Besides ignorance of the correct name of the neighborhood, there are cases, especially in very poor areas, in which the indi-vidual states the name of a surrounding neighborhood because of a lack of geographical boundaries between them. In addition, patient identiication information is stored in a notiication tool, which is then entered
into the municipal system. In the process, many prob -lems can cause the incorrect record or no record of the neighborhood, as incorrect reporting by the health-care professional at the notifying unit, illegible hand-writing, typo, among others. Despite these limitations, the results corroborate those of other studies and offer a new perspective on the vulnerability of individuals who live alone and those inserted in an intermediate situation of social deprivation.
1. Andrade ALSS, Silva SA, Martelli CMT, Oliveira RM, Morais Neto OL, Siqueira Júnior JB, et al. Population-based surveillance of pediatric pneumonia: use of spatial analysis in an urban area of Central Brazil. Cad Saude Publica. 2004;20(2):411-21. DOI:10.1590/S0102-311X2004000200008 2. Chaimowicz F. Age transition of tuberculosis
incidence and mortality in Brazil.
Rev Saude Publica. 2001;35(1):81-7. DOI:10.1590/S0034-89102001000100012 3. Gonçalves H, Costa JSD, Menezes AMB, Knauth
D, Leal OF. Adesão à terapêutica da tuberculose em Pelotas, Rio Grande do Sul: na perspectiva do
paciente. Cad Saude Publica. 1999;15(4):777-87.
DOI:10.1590/S0102-311X1999000400012 4. Hino P, Villa TCS, Cunha TN, Santos CB. Padrões
espaciais da tuberculose e sua associação à condição de vida no município de Ribeirão Preto.
Cienc Saude Coletiva. 2011;16(12):4795-802. DOI:10.1590/S1413-81232011001300028
5. Mathsoft. S-PLUS 4.5 Guide to Statistics. Seattle, WA: Mathsoft, Data Analysis Products Division; 1999. 6. Medronho RA, Werneck GL. Análise de dados
espaciais em saúde. In: Medronho RA, Bloch KV, Luiz RR, Werneck GL, editores. Epidemiologia. 2.ed. Rio de Janeiro: Atheneu; 2009. p.493-511.
7. Munch Z, Van Lill SWP, Booysen CN, Zietsman HL, Enarson DA, Beyers N. Tuberculosis transmission patterns in a high-incidence area: a spatial analysis. Int J Tuberc Lung Dis. 2003;7(3):271-7.
8. Natal S, Valente J, Gerhardt G, Penna ML. Modelo de predição para o abandono do tratamento da tuberculose pulmonar. Bol Pneumol Sanit. [Internet]. 1999 [citado 2015 fev 8];7(1):65-78. Disponível em: http://scielo.iec.pa.gov.br/pdf/bps/v7n1/v7n1a07.pdf 9. Queiroga RPF, Sá LD, Nogueira JA, Lima ERV, Silva
ACO, Pinheiro PGOD, et al. Distribuição espacial da tuberculose e a relação com condições de vida na área urbana do município de Campina Grande - 2004 a 2007. Rev Bras Epidemiol. 2012;15(1):222-32. DOI:10.1590/S1415-790X2012000100020 10. Ruffino-Netto A. Tuberculose: a
calamidade negligenciada. Rev Soc
Bras Med Trop. 2002;35(1):51-8.
DOI:10.1590/S0037-86822002000100010 11. Santos CB, Hino P, Cunha TN, Villa TCS, Muniz
JN. Utilização de um Sistema de Informação Geográfica para descrição dos casos de tuberculose. Bol Pneumol Sanit [Internet]. 2004 [citado 2015 fev 8];12(1):7-12. Disponível em: http://scielo.iec.pa.gov.br/pdf/bps/v12n1/v12n1a02.pdf 12. Santos VR, Yokoo EM, Souza-Santos R, Atanaka-Santos
M. Fatores socioambientais associados à distribuição espacial de malária no assentamento Vale do Amanhecer, Município de Juruena, Estado de Mato Grosso,
2005. Rev Soc Bras Med Trop. 2009;42(1):47-53. DOI:10.1590/S0037-86822009000100010
13. Souza MG, Pinheiro ES. Incidência e distribuição da
tuberculose na cidade de Manaus/AM. Rev Geogr
Acad [Internet]. 2009;3(2):35-43. Disponível em:
http://www.rga.ggf.br/index.php?journal=rga&page=art icle&op=view&path%5B%5D=72&path%5B%5D=61 14. Souza WV, Ximenes R, Albuquerque MFM, Lapa
TM, Portugal JL, Lima MLC, et al. The use of socioeconomic factors in mapping tuberculosis risk areas in a city of northeastern Brazil.
Rev Panam Salud Publica. 2000;8(6):403-10. DOI:10.1590/S1020-49892000001100005 15. Souza WV, Carvalho MS, Albuquerque MFPM,
Barcellos CC, Ximenes RAA. Tuberculosis in intra-urban settings: a Bayesian approach.
Trop Med Int Health. 2007;12(3):323-30. DOI:10.1111/j.1365-3156.2006.01797.x 16. Vendramini SHF, Villa TCS, Cardozo Gonzales RI,
Monroe AA. Tuberculose no idoso: análise do conceito.
Rev Latino-Am Enfermagem. 2003;11(1):96-103. DOI:10.1590/S0104-11692003000100014 17. Vendramini SHF, Santos MLSG, Gazetta CE,
Chiaravalloti-Neto F, Ruffino-Netto A, Villa TCS. Tuberculosis risks and socio-economic level: a case study of a city in the Brazilian south-east, 1998-2004.
Int J Tuberc Lung Dis. 2006;10(11):1231-5.
18. Vieira RCA, Prado TN, Siqueira MG, Dietze R, Maciel ELN. Distribuição espacial dos casos novos de tuberculose em Vitória, Estado do Espírito Santo, no período entre 2000 e 2005. Rev Soc Bras Med Trop. 2008;41(1):82-6. DOI:10.1590/S0037-86822008000100017
REFERENCES
Research supported by the Conselho Nacional de Desenvolvimento Científico e Tecnológico (CNPq – Edital [Official Notice] MCT/CNPq 15/2007 – Edital Universal, Process 473364/2007-7).
Based on the master’s thesis of Alessandra Gonçalves Lisbôa Pereira, titled: “Distribuição espacial da tuberculose e sua correlação com variáveis socioeconômicas no município do Rio de Janeiro nos anos de 2004 a 2006”, presented to Instituto de Estudos de Saúde Coletiva of Universidade Federal do Rio de Janeiro, in 2010.