1Universidade de São Paulo, Faculdade de Saúde Pública, Programa de Pós-Graduação de Nutrição em Saúde Pública. São
Paulo, SP, Brasil.
2Universidade de São Paulo, Faculdade de Saúde Pública, Departamento de Nutrição em Saúde Pública. Av. Dr. Arnaldo, 715,
Perdizes, 01255-000, São Paulo, SP, Brasil. Correspondência para/Correspondence to: DML MARCHIONI. E-mail: <[email protected]>.
The diet quality index evaluates the
adequacy of energy provided by
dietary macronutrients
Índice de qualidade da dieta e adequação
de energia fornecida por
macronutrientes
Aline MENDES1
Larissa GAVIOLI1
Ágatha Nogueira PREVIDELLI1
Regina Mara FISBERG2
Dirce Maria Lobo MARCHIONI2
A B S T R A C T
Objective
To investigate the relationship between macronutrient intake adequacy and the national diet quality index score.
Methods
The study analyzed a representative sample of 1,662 individuals from the municipality of São Paulo who participated in a cross-sectional study called Health Survey-Capital (2008/2009). Two 24-hour recalls were collected. Habitual intake was determined by the Multiple Source Method. The Brazilian index was calculated as suggested, and macronutrient adequacy was given by the World Health Organization and Food and Agriculture Organization recommendations. A generalized linear model verified the relationship between the Brazilian index and macronutrient adequacy. All analyses with a descriptive level below 0.05 were considered significant. The analyses were performed by the software Stata 12.0, survey mode.
Results
with high lipid intake was worse than that of individuals with proper lipid intake (β=0,96; p=0,004), while those with high protein intake had a better score (β=1,10; p=0,003) than those with proper protein intake.
Conclusion
The revised Brazilian Healthy Eating Index assesses diet quality properly regarding high lipid intake, but it has some limitations regarding high protein intake according to the World Health Organization and Food and Agriculture Organization recommendations. New studies should investigate the possibility of adapting this index to the World Health Organization and Food and Agriculture Organization recommendations.
Keywords: Diet. Diet surveys. Macronutrients. Recommended dietary allowances.
R E S U M O
Objetivo
Averiguar a relação entre adequação do consumo de macronutrientes e pontuação do índice nacional de qualidade da dieta.
Métodos
Foram analisados 1.662 indivíduos de uma amostra representativa dos residentes do município de São Paulo, pertencentes ao estudo transversal denominado Inquérito de Saúde em São Paulo (2008/2009). Foram coletados dois recordatórios de 24 horas. A ingestão habitual foi determinada pelo Multiple Source Method. O índice foi calculado e a adequação dos macronutrientes baseou-se nas recomendações da World Health Organization e Food and Agriculture Organization. A relação entre índice e adequação dos macronutrientes foi verificada por meio do modelo linear generalizado. Para todas as análises, considerou-se significativo nível descritivo inferior a 0,05. As análises foram feitas no programa Stata 12.0, modo survey.
Resultados
Observou-se que 91% da população consumiram quantidades inadequadas dos macronutrientes, sendo a pontuação mediana total do índice de 61,3 pontos (interquatile range=10,1). A pontuação total do índice de indivíduos com consumo excessivo de lipídios apresentou-se pior em relação aos de ingestão adequada (β=0,96; p=0,004), enquanto a pontuação daqueles com consumo excessivo de proteínas apresentou-se melhor (β=1,10; p=0,003) aos de ingestão adequada desse macronutriente.
Conclusão
O Índice de Qualidade da Dieta Revisado avalia qualidade da dieta adequadamente em relação à ingestão excessiva de lipídios e com algumas limitações em relação à de proteínas, de acordo com as recomendações da
World Health Organization e Food and Agriculture Organization. Sugerem-se novos estudos que investiguem possibilidades de adaptação desse índice às recomendações da World Health Organization e Food and Agriculture Organization.
Palavras-chave: Dieta. Inquéritos sobre dietas. Macronutrientes. Recomendações nutricionais.
I N T R O D U C T I O N
Diet complexity led to the proposal of many food intake assessment methods, such as dietary indexes, which have been extensively used in the literature because of their ability to measure, in a summarized way, the main characteristics of a healthy diet, and to incorporate in the analyses the correlation between foods and nutrients1,2. Some of the many indexes available today are the Health Eating
Index3, Mediterranean Diet Score4, Dietary Approaches to Stop Hypertension score5, and in Brazil, the revised Brazilian Healthy Eating Index (BHEI), which is a version of the Healthy Eating Index (HEI-2005)2 adapted for the Brazilian population.
regarding food groups, and can simultaneously assess and monitor diets at the individual and population levels2.Therefore, there is a gap in the literature regarding the ability of this dietary index to assess macronutrient intake adequacy.
However, the score of BHEI is based only on food group adequacy and does not directly include macronutrient intake adequacy. According to the World Health Organization (WHO) and Food and Agriculture Organization (FAO)6, a healthy diet should get 55 to 75% of its energy from carbohydrates, 10 to 15% from proteins, and 15 to 30% from lipids.
We do not have knowledge about other studies in the literature that analyzed the ability of the BHEI to assess macronutrient intake adequacy. Hence, the present study aims to investigate the relationship between macronutrient intake adequacy and the BHEI in a representative sample of individuals from the municipality of São Paulo (SP).
M E T H O D S
The study used data from a population-based cross-sectional study conducted by census sectors called Inquérito de Saúde em São Paulo
(ISA-Capital, Health Survey for São Paulo). Trained interviewers conducted the interviews and administered the questionnaires at the participants’
homes in 2008/20097.
The sample consisted of 560 adolescents, 585 adults, and 517 older adults, totaling 1,662 individuals. The age groups were defined as follows: adolescents aged 10 to 19 years; adults aged 20 to 59 years; and older adults aged 60 years or more8. Activity was assessed by a questionnaire validated in Brazil by Matsudo et al.9, and level of physical activity was classified as suggested by Craig et al.10. Food intake was determined by two 24-Hour Dietary Recalls (24HR) as instructed by the manual published by Fisberg & Marchioni7. The software Nutrition Data System for Research analyzed nutritional value; the foods
listed in this software and the conversion of cooking units into grams and milliliters are based on Brazilian publications11,12.
The online platform Multiple Source Method estimated the habitual food and nutrient intakes13, and the estimates were used for calculating the BHEI and BHEI component scores according to the score scale methodology proposed by Previdelli et al.2. The BHEI has twelve components: nine food groups (“total fruits”, “whole fruits”, “total vegetables”, “dark green/ orange vegetables and legumes”, “total grains”, “whole grains”, “milk and dairy products”, “meats, eggs, and legumes”, and “oils”); two nutrients (“sodium” and “saturated fats”); and the last component is energy coming from Solid Fats, Added Sugar, and Alcohol (SoFAA)1. The maximum scores vary: five for the first six components, 10 for the next five components, and 20 for the last component. For most components, the intermediate scores are given by the proportional value of the extreme scores of each component, except for the components “sodium” and “saturated fats”, whose scores have two cut-off points. The scores of these two components are calculated proportionally, considering the score intervals zero to eight and eight to ten. More details can be found elsewhere1. Macronutrient adequacy was based on the WHO & FAO6 recommendations.
Descriptive data analysis used central tendency and dispersion measures. The censlope command verified the difference between the median BHEI and BHEI component scores of individuals with appropriate and inappropriate macronutrient intakes, which determines the confidence intervals between the medians14.
range, within the recommended range, and above the recommended range) and age (years). The adjustment variables were sex (male and female); habitual total calorie intake/day; and education level of the household head (years). Household head was self-reported. All analyses were performed by the software Stata version 12.0 in survey mode. Modeling with the total BHEI score followed the forward stepwise procedure, selecting the most parsimonious model with the best adjustment according to assessment graphs.
The study was approved by the Research Ethics Committee of the School of Public Health of the Universidade de São Paulo under Protocol nº OF.COEP/050/13, nº 2001, and all participants signed an Informed Consent Form.
R E S U L T S
Approximately 47% of the sample was male and 53% was female. The lowest age was 12 years and the highest, 97 years. The mean education level of the household head was 8.5 years (Standard Error - SE=0.20), and the mean habitual total calorie intake was 1881.90 kcal/ day (SE=25.36).
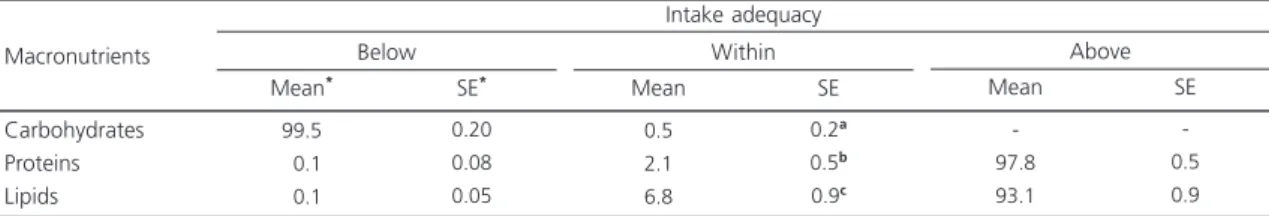
Based on the percentage distribution of energy provided by macronutrients established by the WHO & FAO6, 91.0% of the residents of São
Paulo city did not consume appropriate amounts of carbohydrates, lipids, and proteins. Of these, 99.5% had inadequate carbohydrate intake, with a mean intake of 35.0% (95.0% Confidence
Interval - 95.0%CI=34.5-35.6) of the total energy intake. Most participants had protein and lipid intakes above the recommended range; 93.1% consumed on average 41.8% (95.0%CI=41.3-42.2) of their total calorie intake from lipids, and 97.8%, consumed on average 22.0% (95.0%CI=21.8-22.3) of their total calorie intake from proteins. Nobody in the sample had carbohydrate intake above the recommended range (Table 1).
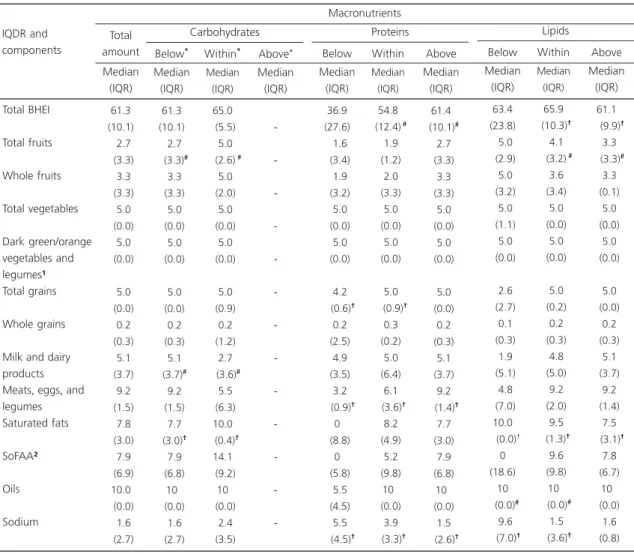
The median general BHEI score was 61.3 points (Interquartile Range [IQR]=10.1). The score of this index indicates that diets with protein content above the recommended range and diets with lipid content within the recommended range are healthier. The BHEI did not differentiate the diet quality of individuals with macronutrient intake percentages below and within the recommended ranges, even though some BHEI components had statistically different scores for these two classifications. Diets with protein content above the recommended range contained more “meats, eggs, and legumes” and “sodium” than diets with normal protein levels. Diets with lipid content above the recommended range contained more saturated fats and less total fruits than diets with normal lipid levels (Table 2).
The relationship between the BHEI score and protein, lipid, and carbohydrate intake adequacy shows that when the mean habitual lipid intake is above the recommended range, the mean BHEI score is significantly lower (β=0.96;
p=0.001) than when lipid intake is within the recommended range (Table 3). In other words,
Table 1. Percentage of individuals from the municipality of São Paulo with macronutrient intakes below, within, and above the
recommended ranges as a percentage of the daily calorie intake according to the World Health Organization and Food and Agriculture Organization (WHO & FAO) recommendations. São Paulo (SP), Brazil, 2015.
Carbohydrates Proteins Lipids
Nota:*Mean percentage (%) of individuals in the population and Standard Error (SE); aAmount recommended by the WHO & FAO6 is 55 to
75% kcal/day; bAmount recommended by the WHO & FAO6 is 10 to 15% kcal/day; cAmount recommended by the WHO & FAO6 is 15 to 30%
kcal/day.
99.5 00.1 00.1
0.20 0.08 0.05
Below
Mean* SE*
Macronutrients
Intake adequacy
0.5 2.1 6.8
0.2a 0.5b 0.9c
Within
Mean SE
-97.8 93.1
-0.5 0.9
Above
individuals with lipid intake above the recommended range have, on average, a total score four percent lower than individuals with lipid intake within the recommended range. However, this is not valid for protein intake since the mean BHEI score of individuals with protein intake above the recommended range is significantly higher
β=1.10; p=0.005) than that of individuals with protein intake within the recommended range. The values for carbohydrates were not significant.
These relationships occur regardless of sex, age group, education level of the household head, level of physical activity, and total habitual calorie intake. Diet quality also increases age (adults:
β=1.04; p<0.001; older adults: β=1.11; p<0.001 in relation to adolescents) and gender, being higher in females (β=1.02; p=0.038) (Table 3). The variables education level of the household head and level of physical activity were not significantly related to the BHEI score.
Table 2. Median score and interquartile interval of the Brazilian Healthy Eating Index (BHEI) and each of its components according to
macronutrient classification as appropriate/inappropriate. São Paulo (SP), Brazil, 2015.
Total BHEI Total fruits Whole fruits Total vegetables Dark green/orange vegetables and legumes¹ Total grains Whole grains
Milk and dairy products Meats, eggs, and legumes Saturated fats SoFAA² Oils Sodium IQDR and components 61.3 (10.1) 02.7 (3.3) 03.3 (3.3) 05.0 (0.0) 05.0 (0.0) 05.0 (0.0) 00.2 (0.3) 05.1 (3.7) 09.2 (1.5) 07.8 (3.0) 07.9 (6.9) 10.0 (0.0) 01.6 (2.7) Total amount Median (IQR) 61.3 (10.1) 02.7 (3.3)# 03.3 (3.3) 05.0 (0.0) 05.0 (0.0) 05.0 (0.0) 00.2 (0.3) 05.1 (3.7)# 09.2 (1.5) 07.7 (3.0)† 07.9 (6.8) 10 (0.0) 01.6 (2.7) Below* Median (IQR) 65.0 (5.5) 05.0 (2.6)# 05.0 (2.0) 05.0 (0.0) 05.0 (0.0) 05.0 (0.9) 00.2 (1.2) 02.7 (3.6)# 05.5 (6.3) 10.0 (0.4)† 14.1 (9.2) 10 (0.0) 02.4 (3.5) Within* Median (IQR) -Above* Median (IQR) Carbohydrates Macronutrients 36.9 (27.6) 01.6 (3.4) 01.9 (3.2) 05.0 (0.0) 05.0 (0.0) 04.2 (0.6)† 00.2 (2.5) 04.9 (3.5) 03.2 (0.9)† 0 (8.8) 0 (5.8) 05.5 (4.5) 05.5 (4.5)† Below Median (IQR) 54.8 (12.4)# 01.9 (1.2) 02.0 (3.3) 05.0 (0.0) 05.0 (0.0) 05.0 0 (0.9)†
00.3 (0.2) 05.0 (6.4) 06.1 (3.6)† 08.2 (4.9) 05.2 (9.8) 10 (0.0) 03.9 (3.3)† Within Median (IQR) 61.4 (10.1)# 02.7 (3.3) 03.3 (3.3) 05.0 (0.0) 05.0 (0.0) 05.0 (0.0) 00.2 (0.3) 05.1 (3.7) 09.2 (1.4)† 07.7 (3.0) 07.9 (6.8) 10 (0.0) 01.5 (2.6)† Above Median (IQR) Proteins 63.4 (23.8) 05.0 (2.9) 05.0 (3.2) 05.0 (1.1) 05.0 (0.0) 02.6 (2.7) 00.1 (0.3) 01.9 (5.1) 04.8 (7.0) 10.0 (0.0)† 0 (18.6) 10 (0.0)# 09.6 (7.0)† Below Median (IQR) 65.9 (10.3)† 04.1 (3.2)# 03.6 (3.4) 05.0 (0.0) 05.0 (0.0) 05.0 (0.2) 00.2 (0.3) 04.8 (5.0) 09.2 (2.0) 09.5 (1.3)† 09.6 (9.8) 10 (0.0)# 01.5 (3.6)† Within Median (IQR) 61.1 (9.9)† 03.3 (3.3)# 03.3 (0.1) 05.0 (0.0) 05.0 (0.0) 05.0 (0.0) 00.2 (0.3) 05.1 (3.7) 09.2 (1.4) 07.5 (3.1)† 07.8 (6.7) 10 (0.0) 01.6 (0.8) Above Median (IQR) Lipids
Note: ¹Dark green/orange vegetables and legumes; ²Energy from solid fats, added sugar, and alcohol; *Below the recommended range; within the recommended range and above the recommended range; #Significant difference between BHEI score or each of its components between the groups named “below the recommended range”, “within the recommended range”, and “above the recommended range” for each study macronutrient (carbohydrates, proteins, and lipids) (<0.05); †Significant difference between BHEI score or each of its components between the groups named “below the recommended range”, “within the recommended range”, and “above the recommended range” for each study macronutrient (carbohydrates, proteins, and lipids) (<0.001).
D I S C U S S I O N
The Brazilian Healthy Eating Index score classified diets with protein content above the recommended range as of better quality than those with protein content within the recommended range, and it properly assessed diets with lipid content above the recommended range, showing that these diets are worse than those with lipid content within the recommended range. Additionally, the BHEI score did not differentiate the quality of diets with protein, lipid, and carbohydrate contents below the recommended range from that of diets with macronutrient contents within the recommended ranges according to the FAO & WHO6.
The mean Brazilian Healthy Eating Index score (61.3 points) found for the present sample was similar to that reported by Fisberg et al.15, who assessed the diet quality of 3,454 individuals from the municipality of São Paulo and reported a mean score of 60.4 points. A higher mean score
(63.7 points) was found by the Third National Health and Nutrition Examination Survey III, a study with a representative sample of the American population that used the Healthy Eating Index (HEI) to assess diet quality16. Navarro & Moncada17 used a diet quality index based on HEI called Índice de Alimentación Saludable para la población Española and found even higher mean scores than the present score, 69.95 for men and 73.73 for women. Despite the fluctuations of the mean scores, the values are close, suggesting agreement between the adapted indexes.
One of the factors that contributes to the limited BHEI assessment of protein intake within the recommended range is the absence of negative scores for high intake of high-protein foods (like HEI-2005), such as the excessive meat intake seen in São Paulo and many other Brazilian municipalities18,19. The high intake of red meat by the population of São Paulo results mainly in high intake of saturated fat, and this type of fat is an important factor in the development of
Table 3. Gaussian regression analysis with logarithmic, univariate, and multiple functions: beta and significance level between BHEI and
socioeconomic and nutritional variables. São Paulo (SP), Brazil, 2015.
Carbohydrate adequacy (%)
Protein adequacy (%)
Lipid adequacy (%)
Education level of the household head (years) Sex
Age group
Physical activity
Habitual calorie intake (kcal)
Below the RR Within the RR Above the RR Below the RR Within the RR Above the RR Below the RR Within the RR Above the RR
Male Female Adolescents Adults Older adults Inadequate Active
0.95
-0.84 -1.10
0.98 -0.94
0.99
-1.03
-1.05 1.13
-0.99
0.99
<0.195
-<0.337 -<0.005
<0.839 -<0.001
<0.016
-<0.002
-<0.001 <0.001
-<0.301
<0.001
1.010
-0.840 -1.100
1.040 -0.960
0.990
-1.020
-1.040 1.110
-1.002
0.990
<0.787
-<0.392 -<0.005
<0.686 -<0.001
<0.592
-<0.038
-<0.001 <0.001
-<0.873
<0.022
Independent variable Categories
β† p†§ β‡ p‡§
Coefficients and significance
cardiovascular diseases and other diseases20.The high intake of meats, especially processed meats, may also contribute to the high intake of sodium (low score) by people with high protein intake. This scenario may be aggravated by high intake of processed products, addition of too much salt, and use of high-sodium condiments18, 21.
The ability of the index to capture the difference between the diet quality of individuals with lipid intake above and within the recommended ranges can be favored by the presence of moderators, such as “saturated fats” in the structure of the calculation. Furthermore, the index was capable of differentiating between the “total fruit” intake of individuals with lipid intake above the recommended range and those with lipid intake within the recommended range, even though less than 10% of the Brazilian population consumes the recommended levels of fruits, vegetables, and legumes, foods that have a protective role against chronic diseases19,22.
Another aspect demonstrated in this study was the higher ability of the BHEI of differentiating diet quality by gender, showing that females adhere more to healthy food recommendations, corroborating Andrade et al.23, who published similar findings and claimed that this specific ability is an aspect of this index that reinforces its reliability and validity. The individual’s age or age group could also reflect better food choices with rising age1, and in fact this study found that adults and older adults have healthier diets than adolescents. Other characteristics, such as education level of the household head and level of physical activity, are not significantly related to BHEI score, but are considered important variables in diet quality variability. Therefore, they are essential for the proposed analyses1.
Some limitations of the study are the homogeneous distribution of the participants regarding the macronutrient intake adequacy in the population, with most people being classified as having inappropriate adequacy. Regardless, the relationships between the BHEI scores and macronutrient intake adequacy differed significantly. Another limitation was the use of only two
24-HR recalls, which is not enough to capture daily food intake variations. However, this study calculated the habitual food intake to remove this intrapersonal variability, hence getting closer to an individual’s actual food intake13,24.
C O N C L U S I O N
The study results evidence that the diets of individuals from the municipality of São Paulo
have a high inadequacy index regarding the percentage macronutrient distribution and show that this inadequacy can be partially detected by the BHEI. Therefore, the BHEI correctly assesses the diet quality of diets with lipid content above the recommended range and assesses with some limitations the diet quality of diets with protein content above the recommended range according to the WHO and FAO recommendations. BHEI does not differentiate diets with macronutrient contents below and within the recommended ranges for all macronutrients. New studies should investigate the possibility of adapting this index to the current recommendations to reduce its limitations.
A C K N O W L E D G M E N T S
We thank Conselho Nacional de Desenvol-vimento Científico e Tecnológico for sponsoring the study.
C O N T R I B U T O R S
A MENDES analyzed and interpreted the data and wrote the article. L GAVIOLI analyzed the data, and drafted and wrote the article. AN PREVIDELLI analyzed the data. RM FISBERG drafted the article. DML MARCHIONI supervised the study and outlined the article.
R E F E R E N C E S
resi-dentes na Região Metropolitana de São Paulo, Bra-sil, 2002. Cad Saúde Pública. 2008; 24(1):169-78. http://dx.doi.org/10.1590/S0102-311X2008000 100017
2. Previdelli AN, Andrade SC, Pires MM, Ferreira SRG, Fisberg RM, Marchioni DML. A revised version of the Healthy Eating Index for the Brazilian population. Rev Saúde Pública. 2011; 45(4):794-8. http://dx. doi.org/10.1590/S0034-89102011005000035 3. Guenther PM, Casavale KO, Reedy J, Kirkpatrick
SI, Hiza HAB, Kuczynski KJ, et al. Update of the Healthy Eating Index: HEI-2010. J Acad Nutr Diet. 2013; 113(4):569-80.
4. Panagiotakos DB, Pitsavos C, Stefanadis C. Dietary patterns: A Mediterranean diet score and its relation to clinical and biological markers of cardiovascular disease risk. Nutr Metab Cardiovasc Dis. 2006; 16(8):559-68.
5. Fung TT, Chiuve SE, McCullough ML, Rexrode KM, Logroscino G, Hu FB. Adherence to a DASH-Style diet and risk of coronary heart disease and stroke in women. Arch Intern Med. 2008; 168(7):713-20. 6. World Health Organization, Food and Agriculture Organization. Diet, nutrition, and the prevention of chronic diseases. Technical Report Series, nº 916. Geneva: WHO; 2003.
7. Fisberg RM, Marchioni DML, organizadoras. Ma-nual de avaliação do consumo alimentar em estu-dos populacionais: a experiência do Inquérito de Saúde em São Paulo (ISA). São Paulo: Universidade de São Paulo; 2012.
8. Brasil. Ministério da Saúde. Orientações para a coleta e análise de dados antropométricos em serviços de saúde: norma técnica do Sistema de Vigilância Alimentar e Nutricional - Sisvan. Série G. Estatística e Informação em Saúde. Brasília: Minis-tério da Saúde; 2011.
9. Matsudo S, Araujo T, Matsudo V, Andrade D, Andrade E, Oliveira LC, et al. Questionario Internacional de Atividade Fisica (IPAQ) estudo de validade e reprodutibilidade no brasil. Rev Bras Ativ Física Saúde. 2001; 6(2):5-18.
10. Craig CL, Marshall AL, Sjostrom M, Bauman AE, Booth ML, Ainsworth BE, et al. International physical activity questionnaire: 12-country reliability and validity. Med Sci Sports Exerc. 2003; 35(8):1381-95.
11. Pinheiro AB, Lacerda EM, Benzecry EH, Gomes MCS, Costa VM. Tabela para avaliação de consumo alimentar em medidas caseira. 2ª ed. Rio de Janeiro: UERJ; 1994.
12. Fisberg RM, Villar BS. Manual de receitas e medidas caseiras para cálculo de inquéritos alimentares. São Paulo: Signus; 2002.
13. Haubrock J, Nöthlings U, Volatier JL, Dekkers A, Ocké M, Harttig U, et al. Estimating usual food
intake distributions by using the Multiple Source Method in the EPIC-Potsdam Calibration Study. J Nutr. 2011; 141(5):914-20. http://dx.doi.org/10.39 45/jn.109.120394
14. Newson R. Confidence intervals for rank statistics: Percentile slopes, differences, and ratios. Stata J. 2006; 6(4):497-520.
15. Fisberg RM, Morimoto JM, Slater B, Barros MBA, Carandina L, Goldbaum M, et al. Dietary quality and associated factors among adults living in the state of São Paulo, Brazil. J Am Diet Assoc. 2006; 106(12):2067-72. http://dx.doi.org/10.1016/j.jada. 2006.09.010
16. Tande DL, Magel R, Strand BN. Healthy Eating Index and abdominal obesity. Public Health Nutr. 2009; 13(2):208-14. http://dx.doi.org/10.1017/S136898 0009990723
17. Navarro AIN, Moncada RO. Calidad de la dieta española según el índice de alimentación saludable. Nutr Hosp. 2011; 26(2):330-6.
18. Carvalho AM, César CLG, Fisberg RM, Marchioni DML. Excessive meat consumption in Brazil: Diet quality and environmental impacts. Public Health Nutr. 2012; 16(10):1893-9. http://dx.doi.org/ 10.1017/S1368980012003916
19. Instituto Brasileiro de Geografia e Estatística. Pes-quisa de orçamentos familiares 2008-2009: análise do consumo alimentar pessoal no Brasil. Rio de Ja-neiro: IBGE; 2011.
20. Santos RD, Gagliardi ACM, Xavier HT, Magnoni CD, Cassani R, Lottenberg AM, et al. Sociedade Bra-sileira de Cardiologia: I Diretriz sobre o consumo de gorduras e saúde cardiovascular. Arq Bras Cardiol. 2013; 100(1 Supl. 3):1-40. http://dx.doi. org/105935/abc.2013S003
21. Selem SSC. Padrões da dieta e hipertensão em adul-tos e idosos de São Paulo [mestrado]. São Paulo: Universidade de São Paulo; 2012.
22. Brasil. Ministério da Saúde. Guia alimentar para a população brasileira. 2a ed. Brasília: Ministério da
Saúde; 2014 [acesso 2015 abr 12]. Disponível em: http://portalsaude.saude.gov.br/images/pdf/2014/ novembro/05/Guia-Alimentar-para-a-pop-brasiliera-Miolo-PDF-Internet.pdf
23. Andrade SC, Previdelli AN, Marchioni DML, Fisberg RM. Avaliação da confiabilidade e validade do Índi-ce de Qualidade da Dieta Revisado. Rev Saúde Pública. 2013; 47(4):675-83. http://dx.doi.org/ 10.1590/S0034-8910.2013047004267
24. Bastos JLD, Duquia RP. Um dos delineamentos mais empregados em epidemiologia: estudo transversal. Scientia Med. 2007; 17(4):229-32.