- 754 - Artigo Original
CULTURAL ADAPTATION AND VALIDATION OF THE HERTH HOPE
INDEX FOR PORTUGUESE LANGUAGE: STUDY IN PATIENTS WITH
CHRONIC ILLNESS
Alessandra Cristina Sartore Balsanelli1, Sonia Aurora Alves Grossi2, Kaye Ann Herth3
1 RN, MD in Nursing. University of São Paulo School of Nursing. São Paulo, Brasil. E-mail: [email protected] 2 PhD, RN, Faculty. University of São Paulo School of Nursing. São Paulo, Brasil. E-mail: [email protected]
3 PhD, RN, FAAN. Dean, College of Allied Health and Nursing. Mankato MN. [email protected]
ABSTRACT: This study aims the cultural adaptation and validation of the Herth Hope Index, an instrument to measure hope. In this methodological study participated 131 individuals: cancer patients, type 2 diabetes patients and their relatives or care providers. The results conirmed reliability of the scale with Cronbach alpha of 0.834. The test-retest veriied the reproducibility of the scale. The construct validity was established by convergent validity between the Escala de Esperança de Herth (Brazilian version) and the Rosenberg Self-Esteem Scale, and the divergent validity between the Escala de Esperança de Herth and the Beck Depression Inventory. The factorial analysis conirmed three factors though composition different from the original scale. The psychometric properties of the Escala de Esperança de Herth were conirmed and indicate it has potential to be used to measure hope in the Brazilian population. DESCRIPTORS: Life expectancy. Psychometrics. Chronic disease. Validation studies
ADAPTAÇÃO CULTURAL E VALIDAÇÃO DO
HERTH HOPE INDEX
PARA
A LÍNGUA PORTUGUESA: ESTUDO EM PACIENTES COM DOENÇA
CRÔNICA
RESUMO: Este estudo tem por objetivo a adaptação cultural e validação do Herth Hope Index, um instrumento para mensurar a esperança. Neste estudo metodológico participaram 131 indivíduos: pacientes oncológicos, pacientes com diabetes do tipo 2 e seus familiares ou cuidadores. Os resultados conirmaram a coniabilidade da escala com Alpha de Cronbach de 0,834. O teste-reteste conirmou a reprodutibilidade da escala. A validade de construto foi estabelecida pela validade convergente entre a Escala de Esperança de Herth (versão Brasileira) e a escala de auto-estima de Rosenberg, e a validade divergente entre a Escala de Esperança de Herth e o Inventário de Depressão de Beck. A análise fatorial conirmou três fatores, apesar da composição diferente da escala original. As propriedades psicométricas da Escala de Esperança de Herth foram conirmadas e, portanto, ela pode ser usada para mensurar esperança na população brasileira.
DESCRITORES: Esperança de vida. Psicometria. Doença crônica. Estudos de validação
LA ADAPTACIÓN CULTURAL Y VALIDACIÓN DE LA
HERTH
HOPE INDEX
PARA PORTUGUÉS: ESTUDIO EN PACIENTES CON
ENFERMEDAD CRÓNICA
INTRODUCTION
Hope is related to wellness, quality of life, life after some serious diagnosis and it brings strength to solve problems and face loss, tragedy, loneliness and suffering.1
Hope was conceived at two spheres and six dimensions. The spheres are characterized as gen-eralized hope, i.e., some future beneit, but with uncertain development, and the particularized hope, i.e., hope referring to a certain object. The dimensions of hope are: 1) affective: the emotions related to hope; 2) cognitive: thoughts and desires related to hope; 3) behavioral: actions taken to make hope come true; 4) afiliative: consists of the relationship with oneself, with the others and with God; 5) temporal: a relation between the past, pres -ent and future and hope; 6) contextual: includes personal experiences of the whole life and they are under the inluence of the experience of hope.2
In a chronic process there are serious condi-tions where patients and their family members lose hope. Nurses may also lose hope when the death of a patient is imminent. However, hope should not be exclusively focused on the desire of a cure or on some more years to live. Something in the short term can be hoped for, such as a week without pain, calling someone the patient loves, seeing spring once again or waiting for a good, digniied death surrounded by the loved ones.3
Then, measure hope in these patients can give subsidy to better nursing care.
Considering that there are currently no instru-ments available in Brazil with which to assess hope in healthy and ill individuals in their native language (Portuguese), the general objective of this study is to make available in Brazil, in Portuguese, a speciic instrument to measure hope. The Herth Hope Index (HHI) was the instrument chosen from among other hope indexes to measure hope because it was based on the multidimensionality of hope.1 The speciic objectives were to make a cultural adaptation and to validate the HHI instrument in Portuguese and to use this index in an initial study comparing hope scores among three groups - those with cancer, those with diabetes and their relatives or care providers -exploring the relationship between the levels of hope among the three groups and speciic socio-demographic and clinical variables.
METHOD
This methodological research refers to the cultural adaptation and psychometric validation
of the HHI to the Brazilian culture. The adapta-tion and validaadapta-tion it is common in our way when it does not have a national instrument.4 This index was an adaptation of it’s parent tool Herth Hope Scale (HHS)1 and was based in six dimen -sions of hope and were combined and used as a framework for generating items for the HHS: a) cognitive-temporal; b) affective-behavioral and c) affiliative-contextual.5 Hope, as defined in
this model, is “a multi-dimensional dynamic life force characterized by a conident yet uncertain expectation of achieving good, which to the hop -ing person, is realistically possible and personally signiicant”.5:41
The items on the HHI are in Likert-format and each item is scored on an ordinal scale from 1 to 4, where a score of 1 indicates “strongly dis -agree” and a score of 4 indicates “strongly -agree”. For analysis, all negative items (item 3 and item 6) were reverse scored so that a higher score would indicate a higher level of hope.1 The original
Eng-lish version of the HHI has undergone extensive psychometric testing and use and has been found to be both reliable and valid across healthy and ill populations.1
-tee review composed of four healthcare providers who were proicient in English. That committee review was requested to assess the semantic and idiomatic equivalences according to the model created by Lino.7 The model contained the items
of the original version and the second Portuguese version of the HHI.
The questions that reached at least 75% of agreement among the judges were deemed equivalent. The items with a lower percentage of agreement were analyzed by taking into account the judges’ suggestions. After the required adjust -ments a third Portuguese version of the HHI was written.
Cultural and conceptual equivalence was not conducted in this study because there are no experts in the hope concept in Brazil. The deci-sion to follow this strategy was based on another Brazilian study.8
The third Portuguese version of the HHI was used in the pretest with 8 patients with cancer, convenient sample, who were given information about the instrument and stimulated to speak up their doubts and make suggestions for better understanding. No changes were found in any item after the pretest. The 8 patients think the instrument is easy and understanding. The instru-ment culturally adapted was called, from then on, “Escala de Esperança de Herth” (EEH). 9
In Phase 2 of this study an analysis of the reliability and validity of the instrument was con -ducted. Reliability was assessed by means of test-retest with 15 subjects, and internal consistency was assessed by means of the Cronbach alpha with the total sample.10 The 15 subjects, cancer patients and healthy caregivers, were chosen because they had appointments scheduled in the ambulatory ward within 15 days (the test-retest interval). The construct validity was assessed through conver -gent validity by means of a correlation between the scores of the EEH (Brazilian version) and the scores of the Rosenberg Self-Esteem Scale (RSES).11 Divergent validity was obtained by means of a correlation between the scores of the EEH and the scores of the Beck Depression Inventory (BDI).11 The construct validity was also veriied through factorial analysis. 10 The validation process was
possible by applying the third Portuguese version of the HHIto the study’s sample.
The research was conducted in the Out -patients Chemotherapy for Adults of São Paulo Hospital, a University Hospital of the Federal University of São Paulo, in the Diabetes Control
Unit of the Endocrinology Department of Clinics Hospital of the Medical School of the São Paulo University and in the Brazilian Association of As-sistance to Diabetics. The data were collected from March to August 2006.
The sample was composed of 131 individuals who agreed to participate in the study and matched the following inclusion criteria: to be a patient with cancer; with initial illness or metastasis; undergo -ing chemotherapy in the ambulatory ward; with or without complications resulting from cancer or its treatment; and aware of the diagnosis; or to have type 2 diabetes mellitus with or without compli -cations being treated in an ambulatory ward; or to be a relative or care provider of patients who belonged to the same socio-demographic context of the patients included in the sample; to be 18 years of age or older; to show cognitive capacity to answer the questions in the instrument; and to have at least six years of schooling. The sample was composed of three groups: cancer patients, type 2 diabetes patients, and a third group with patients’ relatives or care providers. The sample calculation was deined from the necessity of at least ten individuals for question of the instrument to be validated, being twelve questions, therefore at least 120 individuals.
Socio-demographic and clinical data were collected by means of three different characteriza-tion instruments, one for diabetics, one for cancer patients and one for relatives or care providers. They contained information referring to socio-demographic and clinical characteristics such as gender, age, marital status, religion, schooling, profession, current working status, family income and information on the illness and treatment. These variables were chosen because of their im -portance in chronic illness.
The Rosemberg Self-Esteem Scale12 (RSES) was used to assess self-esteem. It is a 10-statement scale scoring from 0 to 3 where the higher the score, the lower the self-esteem.
Data were collected in the waiting room of ambulatory wards mentioned above during or after the routine treatment, after explanations about the study had been given, doubts had been clariied and patients had signed a document stat -ing their free and informed consent.
The self-applicable instruments to assess hope, self-esteem and depression were handed in or read to patients at a reserved physical area to ensure privacy for individual answers.
In the descriptive analysis, the tables of simple and relative frequencies had been used for description of the categorical data. Tables with summary statistics (minimum, average, maximum, mean, standard deviation and standard errors of the mean) had been used for description of the quantitative variable.
The Qui-Quadrado or Fischer test was used to assess the relationship of qualitative variables of the hope scale among the 3 groups. The facto-rial analysis was used to check whether the fac -tors found by the author of the Herth Hope Index were present in this sample by using a maximum likelihood factor analisis with varimax rotation. The internal consistency of the hope scale was assessed with the CronbachAlpha.10 The level of signiicance was considered p<0,05.
The indices Kappa and intra-class correlation had been used for evaluation of the reproducibility and agreement in the test-retest.
Regarding ethical aspects in research, it is worth highlighting that authorization to make cultural adaptation and validation of the HHI for the Brazilian reality was obtained from Dr. Kaye Herth, author of the original instrument. It is also worth highlighting that the project was approved by the Ethical Committee of the USP Nursing School number 508/2005.
RESULTS
In the translation of the HHI from English into Portuguese (Brazilian version) there were small divergences between the two translations and the clearest phrases were chosen. In the back-translation some words were modiied. The analysis of the original version and the second Portuguese version of the HHI conducted by the judges brought contributions to further adapt the instrument. No alterations were made in any items after the pretest. The culturally adapted instru-ment was called, as from that moinstru-ment, “Escala de Esperança de Herth” (EEH).
As to clinical characteristics, it was veriied that among the patients with cancer 19 out of 47 (40.43%) had a diagnosis of breast cancer (women). Hematological illnesses (leukemia, lymphoma and myeloma) represented 23.4% of the sample with 11 patients, and, gastro-intestinal cancers (colon, stomach) stood for 6.3% of the sample. On a likert pain scale ranging from 0 (none) to 10 (extreme pain), 48.9% of the patients with cancer had pain which averaged 6.23 in the previous week. The majority of the patients with cancer (51.1%) found cancer a limiting illness. The average time since diagnosis was 1.01 years.
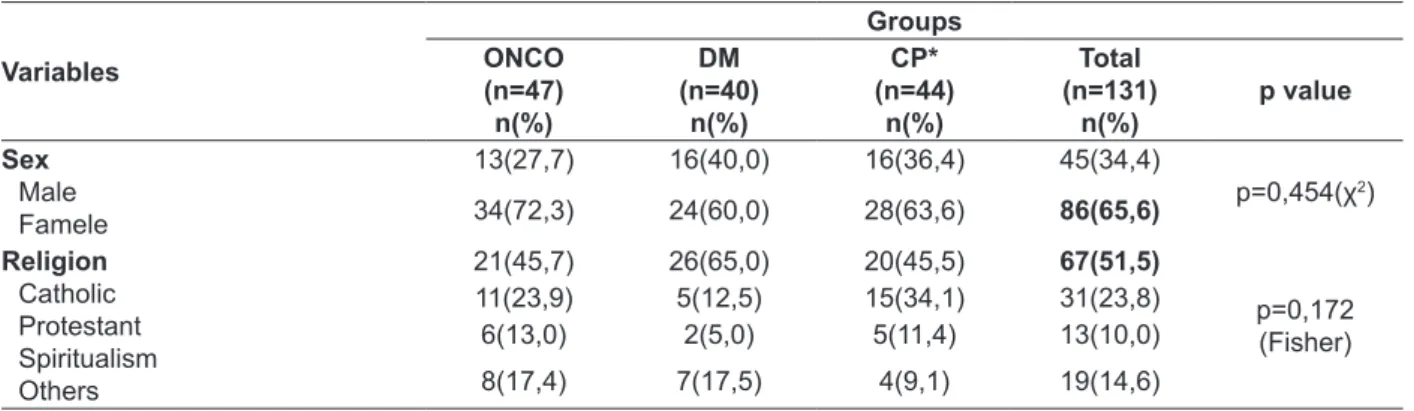
Among the diabetic patients, the majority had hypertension 27/40 (67.5%) as comorbidity; 16/40 (40%) used exclusively oral hypoglyce -mic agents, 12/40 (30%) used only insulin, 9/40 (22.5%) used oral hypoglycemic agents and in -sulin, and 3/40 (7.5%) controlled glycemia only with a diet. Diabetic patients 14/40 (35%) thought that diabetes is a limiting illness. The sample had a mean Body Mass Index (IMC) of 28.11 ± 5.37, which indicates overweight. The mean time since diagnosis was 13.15 years. The table 1 presents the demographic characteristics of the sample.
Table 1 - Demographic characteristics of the sample. São Paulo-SP, 2006
Variables
Groups ONCO
(n=47) n(%)
DM (n=40)
n(%)
CP* (n=44)
n(%)
Total (n=131)
n(%)
p value
Sex
Male Famele
13(27,7) 16(40,0) 16(36,4) 45(34,4)
p=0,454(χ2)
34(72,3) 24(60,0) 28(63,6) 86(65,6)
Religion
Catholic Protestant Spiritualism Others
21(45,7) 26(65,0) 20(45,5) 67(51,5)
p=0,172 (Fisher)
11(23,9) 5(12,5) 15(34,1) 31(23,8)
6(13,0) 2(5,0) 5(11,4) 13(10,0)
758
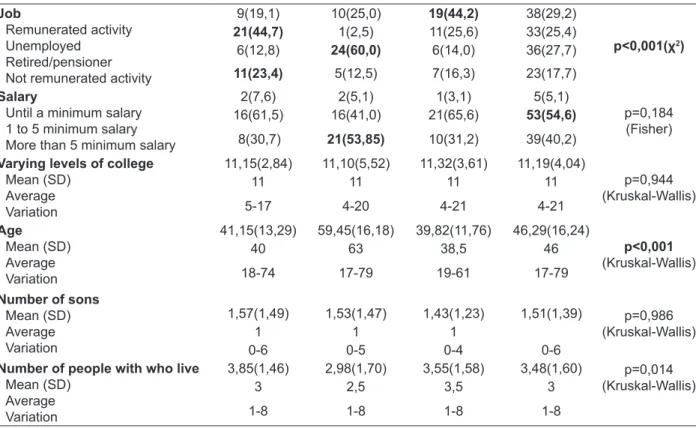
-Job
Remunerated activity Unemployed
Retired/pensioner Not remunerated activity
9(19,1) 10(25,0) 19(44,2) 38(29,2)
p<0,001(χ2)
21(44,7) 1(2,5) 11(25,6) 33(25,4)
6(12,8) 24(60,0) 6(14,0) 36(27,7)
11(23,4) 5(12,5) 7(16,3) 23(17,7)
Salary
Until a minimum salary 1 to 5 minimum salary More than 5 minimum salary
2(7,6) 2(5,1) 1(3,1) 5(5,1)
p=0,184 (Fisher)
16(61,5) 16(41,0) 21(65,6) 53(54,6)
8(30,7) 21(53,85) 10(31,2) 39(40,2)
Varying levels of college
Mean (SD) Average Variation
11,15(2,84) 11,10(5,52) 11,32(3,61) 11,19(4,04)
p=0,944 (Kruskal-Wallis)
11 11 11 11
5-17 4-20 4-21 4-21
Age
Mean (SD) Average Variation
41,15(13,29) 59,45(16,18) 39,82(11,76) 46,29(16,24)
p<0,001
(Kruskal-Wallis)
40 63 38,5 46
18-74 17-79 19-61 17-79
Number of sons
Mean (SD) Average Variation
1,57(1,49) 1,53(1,47) 1,43(1,23) 1,51(1,39) p=0,986
(Kruskal-Wallis)
1 1 1
0-6 0-5 0-4 0-6
Number of people with who live
Mean (SD) Average Variation
3,85(1,46) 2,98(1,70) 3,55(1,58) 3,48(1,60) p=0,014
(Kruskal-Wallis)
3 2,5 3,5 3
1-8 1-8 1-8 1-8
* Care Providers.
The reliability of the EEH was veriied by means of an internal consistency analysis and the Cronbach alpha obtained for the full scale was 0.834. The item 3 of the scale was the one that was the least related to the others; however, if it was removed, it would increase the Cronbach alpha to 0.848, which would not justify its exclusion.10 So,
all items should be kept.
The test-retest was conducted with 15 subjects to investigate the stability of the irst and second applications of the instrument with an approximate 15-day interval between them. The mean of the indexes obtained in the irst and the second applica -tions had a similar result (40.93/ 41.07). It was found that there was no statistically signiicant difference between the irst and the second applications of the EEH (p=0.97). The Intra-Class Correlation Index,
usually used to measure reproducibility, resulted in 0.70 for the EEH, which suggests reasonable re -producibility and the value p=0.001 signiicant for
that result indicating that there is reproducibility different from a null result.
The construct validity was assessed through convergent validity by using the RSES, and diver-gent validity by means of the BDI. The factorial analysis was also assessed.
The application of the EEH to the sample studied shows means scores of 40.46 for the group of diabetics, 40.88 for the group of relatives or care providers, and 41.57 for the group of patients with cancer, which are high values considering a pos -sible variation from 12 to 48 where 48 stands for the best hope score. The table 2 shows the similarity of hope escore between the groups.
Table 2 - Hope score between the groups, São Paulo-SP, 2006
Group Minimum Average Maximum Mean Standard deviation
Standard
error n p-value*
EEH
ONCO 33 42,5 48 41,57 4,60 0,71 42
0,348
DM 31 40 48 40,46 4,88 0,78 39
Care Providers 32 41,5 47 40,88 3,77 0,65 34
The correlation between the EEH and BDI is
the higher the hope score, the lower the self-esteem score, once zero for the RSES means a higher score of self-esteem. Therefore, the higher the hope, the higher the self-esteem.
The correlation between the EEH and the two instruments is presented in Table 3.
Table 3 - Correlation among the scores of the EEH, BDI and RSES in the sample, São Paulo-SP, 2006
The Escala de Esperança de Herth
General ONCO DM Care Providers
BDI
Pearson correlation -0.39 -0.37 -0.45 -0.45
p-value <0.001* 0.016* 0.004* 0.008*
N 115 42 39 34
RSES Pearson correlation -0.50 -0.55 -0.59 -0.38
p-value <0.001* <0.001* <0.001* 0.028*
N 115 42 39 34
*statistically signiicant.
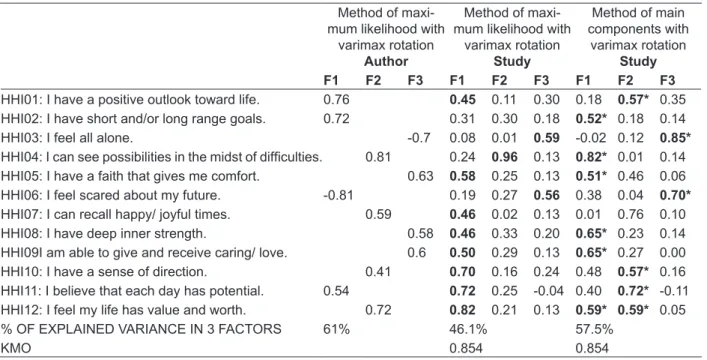
The factorial analysis (Table 4) by the maxi-mum likelihood used the same criteria of the au-thor (varimax rotation; self-values higher than 1, with solution of three factors and criterion of factor selection > 0.40).
The maximum likelihood method used in this study presents only 46% of variability explained in the irst three factors, i.e., less than half of the vari -ability is represented in these three dimensions. With this method virtually one single main factor is obtained encompassing 8 out of the 12 items.
With the method of main component (Table 4) and the same rotation, this explained variability
rises to 58%, close to the 61% found by the author (with the maximum likelihood method). In this method we have the irst factor with 8 items, the second with 6 and the third with 2 items, items 5, 10, 11 and 12 being repeated in the irst and second factors. By changing the cut-point criterion from 0.40 to 0.50 we have only item 12 repeated in fac -tors 1 and 2. Factor 1 has then 6 items and factor 2 has 5 items. Factor 3 still has 2 items and all the items are presented by the factors (which does not happen with the irst method, where item 2 has no load over 0.40 in none of the factors).
Table 4 - Factorial load of the items according to statistic analyses conducted for the EEH, São Paulo- SP, 2006
Method of maxi-mum likelihood with
varimax rotation
Author
Method of maxi-mum likelihood with
varimax rotation
Study
Method of main components with
varimax rotation
Study F1 F2 F3 F1 F2 F3 F1 F2 F3
HHI01: I have a positive outlook toward life. 0.76 0.45 0.11 0.30 0.18 0.57* 0.35
HHI02: I have short and/or long range goals. 0.72 0.31 0.30 0.18 0.52* 0.18 0.14
HHI03: I feel all alone. -0.7 0.08 0.01 0.59 -0.02 0.12 0.85*
HHI04: I can see possibilities in the midst of dificulties. 0.81 0.24 0.96 0.13 0.82* 0.01 0.14
HHI05: I have a faith that gives me comfort. 0.63 0.58 0.25 0.13 0.51* 0.46 0.06
HHI06: I feel scared about my future. -0.81 0.19 0.27 0.56 0.38 0.04 0.70*
HHI07: I can recall happy/ joyful times. 0.59 0.46 0.02 0.13 0.01 0.76 0.10
HHI08: I have deep inner strength. 0.58 0.46 0.33 0.20 0.65* 0.23 0.14
HHI09I am able to give and receive caring/ love. 0.6 0.50 0.29 0.13 0.65* 0.27 0.00
HHI10: I have a sense of direction. 0.41 0.70 0.16 0.24 0.48 0.57* 0.16
HHI11: I believe that each day has potential. 0.54 0.72 0.25 -0.04 0.40 0.72* -0.11
HHI12: I feel my life has value and worth. 0.72 0.82 0.21 0.13 0.59* 0.59* 0.05
% OF EXPLAINED VARIANCE IN 3 FACTORS 61% 46.1% 57.5%
KMO 0.854 0.854
The KMO (Kaiser-Meyer-Olkin), a test that examines the data adjustment for factorial analy-sis, had the value of 0.854 for the two analyses conducted, which means that data are adequate.
Level of hope was found not to be signiicant -ly related to the cancer diagnosis. For the most frequent diagnoses, breast cancer and hematologi -cal illnesses, there was no signiicant difference (p=0.216) in the hope level. For the pain clinical variable there was not any statistically signiicant difference either (p=0.109), i.e., as patients with or without pain had similar hope scores.
For diabetics it was veriied that in spite of the different forms of treatment received, no signiicant differences were evidenced among the hope levels among those who used oral hypogly -cemic agents, those who used only insulin, and those who used both oral hypoglycemic agents and insulin (p=0.794). As to the comorbidity of arterial hypertension was not found to inluence the hope level among diabetic patients (p=0.512).
DISCUSSION
The studies described the important role hope plays in dealing successfully with chronic illnesses and the signiicant role that nurses have in implementing interventions to assist ill individu-als and their caregivers to maintain and engender their hope.3,5-6
Once it was determined that there were no speciic instruments created in Brazil or adapted to the Brazilian culture, to assess hope it was decided to adapt and validate an instrument to measure that construct as established in the literature for cultural adaptation. These guidelines have been broadly used to adapt and validate several instru-ments. 4,8-9,12,14
The Brazilian version of the HHI did not present signiicant divergences during the phases through which it was submitted in the cultural adaptation process. Two statements in the instru -ments have not been changed, item number 5 and item number 10.
The sample presented only two signiicant socio-demographic differences, the working status among the three groups and the age among the patients.
As to the clinical characteristics of the patients with cancer, the type of tumor and the presence of pain are not signiicantly related to hope. The presence of associated co-morbidity and the type of treatment for the patients of the
group of diabetics was not signiicantly related to hope either. Another study that also used the HHI did not ind differences in the hope score between patients in pain and those who were not in pain. 15 In that same study the status of the disease did
not affect the hope level either.15
The analysis of the internal consistency of the original HHI instrument was conducted in a 172-adult population, 70 out of those with acute ill -ness, 71 chronic patients and 31 terminal patients, obtained internal consistency represented by a Cronbach alpha coeficient of 0.97.1 The Swedish study of validation of the HHI which involved 85 adults, 40 out of those being patients with cancer under palliative care and 45 relatives presented in its analysis of consistency an alpha value of 0.88.16
In the internal consistency analysis of the EEH a total Cronbach alpha of 0.834 was obtained for the total scale.
The groups are not different as to the total hope score. The groups of patients with cancer, and patients with diabetics and the group of those patients’ relatives or care providers had a high total hope score.
The Pearson correlation between the EEH and the score of the BDI and RSES is negative and signiicant, i.e., the higher the hope score, the lower the depression score, and the bigger the hope score, the smaller the self-esteem score once the score of the self-esteem scale is a reverse score.
The factorial analysis using the method of main components presented a better distribution of the items in three factors. This method with varimax rotation, the explained variance was 58%, similar of author’s 61% (with method of maxi -mum likelihood). In this method the irst factor has 8 items, the second 6 and the third 2 items, however the items 5, 10, 11 e 12 repeat in the irst and second factors. When changed the cut point to 0.5, only the item 12 was repeated in the irst and second factors.
CONCLUSIONS
This Brazilian study makes available the Escala de Esperança de Herth, EEH, based on the cultural adaptation and validation in the 131-sub-ject sample composed of chronically ill individuals with cancer and diabetes and their relatives or care providers.
with a chronic illness and their caregivers. Further research is needed to determine the reliability and validity of the Escala de Esperança de Herth in different populations and socio-cultural contexts of the Brazilian culture.
REFERENCES
Herth K. Abbreviated instrument to measure hope: 1.
development and psychometric evaluation. J Adv Nurs. 1992 Feb; 17(10):1251-9.
Dufault K, Martocchio BC. Symposium on 2.
compassionate care and the dying experience. Hope: its spheres and dimensions. Nurs Clin North Am. 1985 Jun; 20(2):379-91.
Hickey SS. Enabling hope. Cancer Nurs. 1986 Jun; 3.
9(3):133-7.
Viana HB, Guirardello EB, Madruga VA. Tradução 4.
e adaptação cultural da Escala Askas: Aging Sexual Knowledge and Attitudes Scale em idosos brasileiros. Texto Contexto Enferm. 2010 Abr-Jun;19(2):238-45.
Herth K. Development and refinement of an 5.
instrument to measure hope. Sch Inq Nurs Pract. 1991 Spri; 5(1):39-51.
Guillemin F, Bombardier C, Beaton D. Cross-cultural 6.
adaptation of health-related quality of life measures: literature review and proposed guidelines. J Clin Epidemiol. 1993 Dec; 46(12):1417-32.
Lino MM. Satisfação proissional entre enfermeiras de 7.
UTI: adaptação transcultural do Index of Work Satis-faction (IWS) [dissertation]. São Paulo (SP): Universi-dade de São Paulo, Escola de Enfermagem; 1999.
Salvetti MG. Crença de auto-eicácia e validação da 8.
“Chronic Pain Self-Eficacy Scale” [dissertation]. São Paulo (SP): Universidade de São Paulo, Escola de Enfermagem; 2004.
Sartore AC, Grossi SAA. Escala de Esperança de 9.
Herth – instrumento adaptado e validado para a língua Portuguesa. Rev Esc Enferm USP. 2008 Jun; 42(2):227-32.
Pereira JCR. Análise de dados qualitativos.
10. São
Paulo (SP): Edusp; 1999.
Pasquali L. Psicometria: teoria e aplicações. Brasília 11.
(DF): Editora Universidade de Brasília; 1997. Dini GM. Adaptação cultural, validade e 12.
reprodutibilidade da versão brasileira da Escala de Auto-estima de Rosenberg [dissertation]. São Paulo (SP): Escola Paulista de Medicina, Universidade Federal de São Paulo; 2000
Kendall PC, Hollon SD, Beck AT, Hammen CL, 13.
Ingran RE. Issues and recommendations regarding use of Beck depression inventory. Cognit Ther Res. 1987 Jun; 11(3):289-99.
Santos VLCG, Azevedo MAJA, Silva TS, Carvalho 14.
VMJ, Carvalho VF. Adaptação transcultural do pressure ulcer scale for healing (PUSH) para a língua Portuguesa. Rev Latino-am Enfermagem. 2005 May-Jun; 13(3):305-13.
Chen ML. Pain and hope in patients with cancer: 15.
a role for cognition. Cancer Nurs. 2003 Feb; 26(1):61-7.
Benzein EG, Berg AC. The Swedish version of Herth 16.
Hope Index: an instrument for palliative care. Scand J Caring Sci. 2003 Dec; 17(4):409-15.
Correspondence: Alessandra Cristina Sartore Balsanelli Rua Loefgreen, 1654, ap. 91
04040-002 - Vila Clementino, São Paulo, SP, Brasil E-mail: [email protected]