Vocal Variability Post Swallowing in Individuals
with and without Oropharyngeal Dysphagia
Karoline Weber dos Santos
1Betina Scheeren
2Antonio Carlos Maciel
2Mauriceia Cassol
11Speech Therapy, Universidade Federal de Ciências da Saúde de Porto Alegre, Porto Alegre, Brazil
2Radhiology, Irmandade Santa Casa de Misericórdia de Porto Alegre, Porto Alegre, Brazil
Int Arch Otorhinolaryngol 2015;19:61–66.
Address for correspondence Karoline Weber dos Santos, MSc, Fga, Universidade Federal de Ciências da Saúde de Porto Alegre, Rua José Grimberg, 70, Porto Alegre 91180650, Brazil
(e-mail: [email protected]).
Introduction
Swallowing, a stomatognathic function, is characterized by a complex mechanism that requires the involvement of many structures that must be coordinated to occur effectively. The main functional condition that needs to be considered is the ability to protect the lower airway through elevation, laryn-geal closure and protective reflexes, such as coughing.1When starting the pharyngeal phase of swallowing, three events occur: laryngeal elevation through the contraction of the
suprahyoid muscles; lowering of the epiglottis, which reduces the space of the laryngeal inlet; and vocal fold adduction, operating in glottal closure, which is an additional mechanism that reduces exposure of the lower airway.1–3
The main diagnostic method to evaluate swallowing dy-namics is videofluoroscopy, also known as“videodeglutogram”
or dynamic examination of swallowing. Considered the refer-ence standard for evaluation and diagnosis of changes in this function, it consists of swallowing food with barium, allowing the visualization of the process by dynamic X-ray machine, Keywords
►
deglutition disorders
►
voice quality
►
deglutition
►
voice
►
oropharyngeal
dysphagia
Abstract
Introduction
Voice modi
fi
cation after swallowing may indicate changes in the transit
of the bolus.
Objective
The aim of this study is to verify the use of perceptual voice analysis to
detect oropharyngeal dysphagia.
Study Design
Case series.
Methods
Twenty-seven patients with dysphagia as diagnosed by video
fl
uoroscopy
and 25 without were evaluated. The sustained vowel /a/ was recorded before this exam
and after swallowing different consistencies (pasty, liquid and solid). For the voice
evaluation, the GRBAS scale (grade, roughness, breathiness, asthenia and strain) and
the parameter
“
wet voice
”
were used. Three judges blinded to study group and time of
emission performed voice analysis.
Results
Individuals with dysphagia showed signi
fi
cant decrease in grade of voice and
asthenia and increase in strain after swallowing pasty substances, differing from
individuals without dysphagia who showed no modi
fi
cation of the parameters after
swallowing. The wet voice parameter showed no difference after swallowing in both
study groups.
Conclusion
The decrease in grade and asthenia and increased strain are indicative of a
swallowing disorder, indicating increased vocal strain to clean the vocal tract of food.
The modi
fi
cation of vocal production after swallowing proved to be a trusted resource
for detection of swallowing disorders.
received
July 18, 2014
accepted after revision
September 5, 2014
published online
October 17, 2014
DOI http://dx.doi.org/ 10.1055/s-0034-1394129.
ISSN 1809-9777.
Copyright © 2015 by Thieme Publicações Ltda, Rio de Janeiro, Brazil
which shows the path traversed by the material swallowed. In this exam, the exact course taken by the food can be precisely identified, as well as the areas where the process does not occur efficiently; it is possible to view a deposit of contrasted material in places with changes in motility.4,5
Although videofluoroscopy is the standard for diagnosis, it is not easy to access for patients with swallowing disorders, besides having restrictions on its indication. Therefore, clini-cal evaluation is routinely used for detection of swallowing disorders and determination of treatment.6,7 This method consists of several steps that, when taken together, describe the swallowing changes according to the characteristics presented by the patient, thus allowing the determination of therapeutics.5,7,8
One of the aspects considered in the clinical evaluation is laryngeal function, which requires assessment of the ana-tomical conditions of the region, evaluated by palpation and aspects of mobility and its functional capacity, evaluated by changes in vocal production after swallowing. Altered vocal production after swallowing has been considered a leading indicator of inefficiency of the process, because stasis of food in the laryngeal-pharyngeal cavity during swallowing is commonly observed in patients with dysphagia.9,10 The presence of food in this region can alter the space of the vocal tract, modifying voice quality.11Although this parame-ter is routinely evaluated in clinical protocols, few studies have analyzed its reliability for detection of dysphagia, indi-cating possible bias of this method when indiindi-cating a change in swallowing. Moreover, studies do not compare voices of individuals with and without swallowing disorders, which could determine whether this modification can actually be attributed to a disturbance of this function or it occurs for all subjects immediately after swallowing.
This study aimed to: (1) investigate the reliability of the protocol used; (2) check whether significant change occurs in the perceptual assessment of voice after swallowing in indi-viduals with oropharyngeal dysphagia; and (3) compare significant changes related to voice quality in the group with dysphagia compared with the control group.
Methods
Design and Sample
This study presents a descriptive cross-sectional prospective comparison between subjects with and subjects without oropharyngeal dysphagia aiming to verify changes of voice production after swallowing. The study was approved by the Ethics Research Committee under protocol 293.856.
Men and women 18 years or older capable of continuous voice production for at least 4 seconds and swallowing at least one of the consistencies in the evaluation (pasty, liquid and solid) were included. The study sample was divided into two groups: individuals with (G1) and individuals without (G2) oropharyngeal dysphagia. Subjects who were diagnosed with swallowing disorder by videofluoroscopy composed G1 and were stratified according to the score in the dysphagia severity scale from 1 to 5, signifying severe to discrete dysphagia. Individuals in G2 showed no swallowing disorders
and scored 7 on the scale used, compatible with normality.12 Pairing by sex and age was performed, with a difference of up to 5 years between pairs. Individuals with tracheostomy, organic-functional and organic vocal fold lesions, or injury of laryngeal nerves causing vocal fold paralysis were exclud-ed. Subjects who had surgical removal of tumor and tissues involved in the swallowing process and all those individuals cognitively unable to respond to the protocol were also excluded.
Fifty-two individuals, 27 (14 men and 13 women) in G1 and 25 (12 men and 13 women) in G2, were evaluated, with mean ages of 71.07 for men and 76.69 for women in thefirst group and 68.05 and 78.53, respectively, in the second group. The evaluations performed yielded 201 vocal recordings, including 101 in G1 and 100 in G2. The difference in the number of recordings between groups was due the greater number of subjects in G1; the number of recordings was also less than expected due to the impossibility of evaluating some consistencies due to limitations of bolus preparation and oropharyngeal dysphagia.
Procedures
All study participants underwent evaluation of vocal produc-tion before and after a sequence of swallows during video-fluoroscopy, using three consistencies of foods evaluated in the following order: pasty, liquid and solid. For the recording of vocal productions, the digital recorder DVR-Powerpack 576.BK (Powerpack, China) with external microphone was used. Before the exam, subjects were asked to perform a deep inspiration followed by emission of vowel /a/ in the usual tone of voice; if the emission lasted at least 4 seconds, it was considered valid. The same instructions were made for eval-uations performed after swallowing each food consistency tested in the exam.
Videofluoroscopy
Videofluoroscopy examinations were performed with the Siemens Axion Iconos R100 fluoroscopy (Siemens, USA) model coupled to an image recording system in a computer, which allows further detailed analysis of the exam. During the examination, subjects remained seated and images were captured in the lateral and anteroposterior positions, with upper and lower limits ranging from the oral cavity to the stomach.
The examinations were performed by evaluating pasty, liquid and solid consistencies prepared, respectively, as follows: yogurt-type petit suisse with liquid barium (Bariogel®, Brazil) at a ratio of 1:1 (20 mL of yogurt to 20 mL of barium); distilled water with liquid barium (Bariogel®) at a ratio of 1:1 (40 mL of water to 40 mL of barium); and bread soaked in liquid barium (Bariogel®).
each study group and will not be described in detail here. Nevertheless, it should be noted that 18 (66.6%) subjects had grade 5 dysphagia, 5 (18.51%) had grade 4, 1 (3.70%) had grade 3, 3 (11%) had grade 2 and 0 (0%) had grade 1, demonstrating that the majority of the sample had mild to moderate oropharyngeal dysphagia.
Perceptual Analysis of Vocal Quality
At the end of data collection, voice recordings were given to three judges with clinical experience in voice analysis and evaluation of swallowing. The perceptual analysis was classified using the GRBAS scale (grade, roughness, breath-iness, asthenia and strain).13The three judges received an instructional guide with the objectives and procedures of analysis to be performed. Values were assigned on a scale from 0 to 3 (no change, mild alteration, moderate alteration and severe alteration, respectively) to the parameters de-scribed in the protocol. In addition, the wet voice feature was included in perceptual assessment because it is com-monly attributed to the vocal production of individuals with dysphagia after swallowing. The judges were blinded to the information and evaluation results of patients. Moreover, they were not informed about which recordings occurred before or after swallowing or to the subject’s study group to
maintain the reliability of the data and to not influence these aspects in the analysis. The recordings were sent in stages, with each stage not containing more than one recording of each subject, so evaluators could not compare samples.
Statistics
The data collected were analyzed using descriptive statistics and statistical tests, arranged in tables. The Kolmogorov-Smirnov test was used to test the normality of the data. To measure the reliability of the protocol used, we applied Cronbach’s alpha to measure the correlation between judges. Moreover, the means of the results obtained from the judges for each variable evaluated were calculated. The comparison of the voice emission before and after swallow-ing of each consistency was performed usswallow-ing thettest for paired samples for variables with normal distribution and the WilcoxonUtest for variables with non-normal distri-bution. Maximum level of significance of 5% was adopted and the statistical software used for data analysis was SPSS version 20.0.
Results
►Table 1shows the reliability of the protocol used, GRBAS scale and wet voice in various stages of evaluation by the three judges. Cronbach’s alpha coefficient demonstrated a good correlation between the answers provided by evaluators for all times.
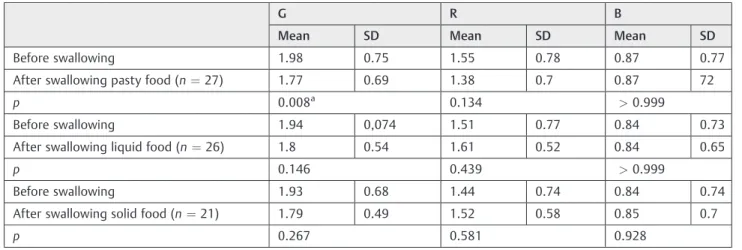
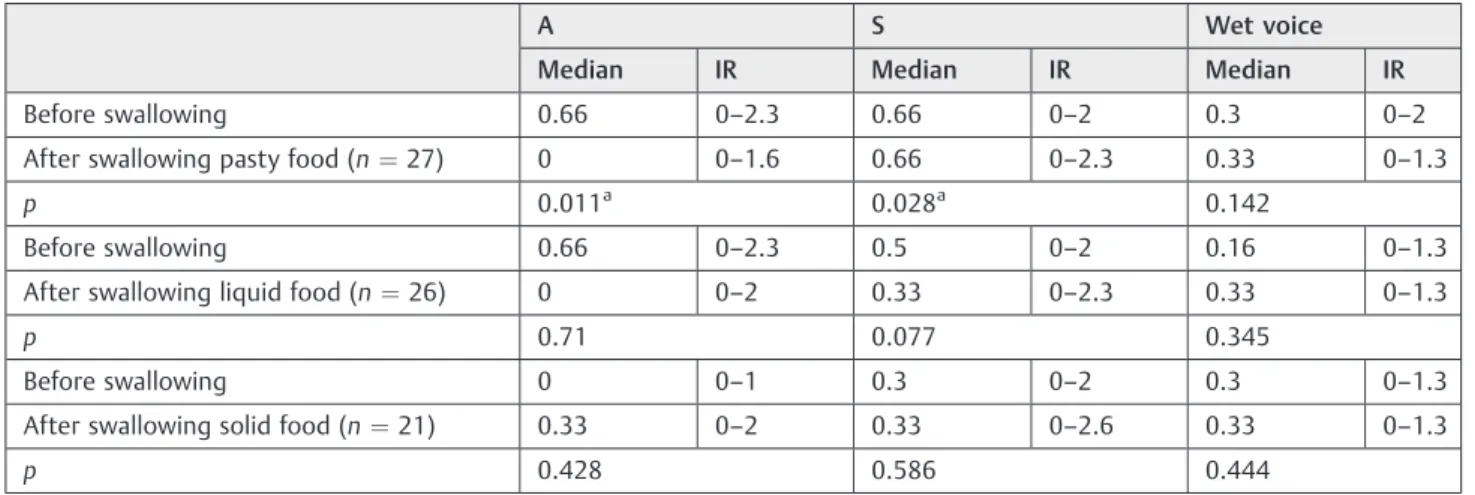
►Table 2shows a significant decrease only in the voice grade after swallowing pasty food and►Table 3demonstrates a significant decrease in the aspect of asthenia and increased strain after swallowing pasty food in individuals with oro-pharyngeal dysphagia.
►Table 4presents the data before and after swallowing on the G2 of variables with significant vocal change in the G1. Through the WilcoxonUtest, a statistical difference in voice modification after swallowing was not observed in G2.
Table 1 Compatibility between judges in the application of GRBAS scale and wet voice at each moment of evaluation
Moment of evaluation Number of items evaluated
Cronbach’s alpha
Before swallowing 6 0.898
After swallowing pasty food
6 0.882
After swallowing liquid food
6 0.872
After swallowing solid food
6 0.863
Table 2 Emission before and after swallowing of each consistency in individuals with oropharyngeal dysphagia (Studentttest)
G R B
Mean SD Mean SD Mean SD
Before swallowing 1.98 0.75 1.55 0.78 0.87 0.77
After swallowing pasty food (n¼27) 1.77 0.69 1.38 0.7 0.87 72
p 0.008a 0.134 >0.999
Before swallowing 1.94 0,074 1.51 0.77 0.84 0.73
After swallowing liquid food (n¼26) 1.8 0.54 1.61 0.52 0.84 0.65
p 0.146 0.439 >0.999
Before swallowing 1.93 0.68 1.44 0.74 0.84 0.74
After swallowing solid food (n¼21) 1.79 0.49 1.52 0.58 0.85 0.7
p 0.267 0.581 0.928
Abbreviations: B, breathiness; G, grade; R, roughness; SD, standard deviation. a
Discussion
The same anatomical structures are involved in phonation and swallowing, especially in the laryngeal region, which is responsi-ble for the main execution of these functions [14]. Some studies have been conducted to identify vocal parameters that can contribute to detection of oropharyngeal dysphagia.11,14–16
Vocal production is initiated by the exhalation of air, which passes through the vocal folds in adduction position, produc-ing a sound that is modified by the vocal tract that features the voice of each individual. The length and diameter of the vocal tract, ranging from the vocal folds to the nasal cavity, the placement of structures, such as the tongue and lips, as well as the permeability of the paranasal sinuses modify the sound produced by the vocal folds, making the voice of each person unique due to anatomical peculiarities.17,18Thus, anatomical or functional modifications in these structures, as well as the presence of food in the pharyngolaryngeal cavity in cases of oropharyngeal dysphagia, can lead to perceptual changes in the usual voice.11,18
The results of this study helped confirm that perceptual parameters commonly evaluated for vocal characterization may vary after swallowing in individuals with oropharyngeal dysphagia. This is not observed in subjects without this change, which is of fundamental importance in clinical applicability.19 Furthermore, judges were compatible on the assignment of the observed features, as shown in►Table 1. Perceptual analysis needs to have high compati-bility in intra- and interevaluators so that the data are reliable compared with the real vocal production.20The scale used for perceptual analysis in this study is often by professionals that work in the voice area and has shown fairly consistent applicability by independent evaluators, allowing greater reliability between results obtained in this study.13,21 A proviso should be made for the wet voice parameter added to the protocol in this study, which will be discussed later.
Voice grade depends on the perception of the evaluator and consequently, previous experiences in voice analysis is necessary to assign a gravity score based on a set of vocal characteristics perceived as variations of normality.13,21The Table 3 Emission before and after swallowing of each consistency in individuals with oropharyngeal dysphagia (WilcoxonUtest)
A S Wet voice
Median IR Median IR Median IR
Before swallowing 0.66 0–2.3 0.66 0–2 0.3 0–2
After swallowing pasty food (n¼27) 0 0–1.6 0.66 0–2.3 0.33 0–1.3
p 0.011a 0.028a 0.142
Before swallowing 0.66 0–2.3 0.5 0–2 0.16 0–1.3
After swallowing liquid food (n¼26) 0 0–2 0.33 0–2.3 0.33 0–1.3
p 0.71 0.077 0.345
Before swallowing 0 0–1 0.3 0–2 0.3 0–1.3
After swallowing solid food (n¼21) 0.33 0–2 0.33 0–2.6 0.33 0–1.3
p 0.428 0.586 0.444
Abbreviations: A, asthenia; IR, interquartile range; S, strain. a
p<0.05.
Table 4 Emission before and after swallowing of each consistency in group 2 (WilcoxonUtest)
G A S
Median IR Median IR Median IR
Before swallowing 0.66 0.3–2.3 0 0–1 0.33 0 to 2.3
After swallowing pasty food (n¼25) 1 0–2 0 0 to 0.6 0.33 0–2
p 0.357 0.803 0.101
Before swallowing 0.6 0.3–2.3 0 0–1 0.3 0–2.3
After swallowing liquid food (n¼25) 1 0.3–2.3 0 0–1 0.3 0–2.3
p 0.406 0.167 0.439
Before swallowing 0.6 0.3–2.3 0 0–1 0.3 0–2.3
After swallowing solid food (n¼25) 0.6 0.3–2 0 0–1 0.3 0–1.6
p 0.646 0.428 0.586
use of this parameter in the evaluation of dysphagia allowed the identification of changes in the oropharyngeal transit of pasty food, with a decrease in severity of grade, even in a blinded analysis. It was noted that this modification only occurs for this consistency and was not modified for other consistencies evaluated. The viscosity of the pasty food permits it to adhere to the pharyngolaryngeal structures when there are changes in motility, as observed in imaging studies.22,23The presence of food in the pharyngolaryngeal cavity acts as a voice modifier and changes voice character-istics during the sound passage produced by the vocal folds over the vocal tract. The obstruction at any point in the vocal tract, as commonly accomplished by the lips and tongue during speech, changes the formants that compose the voice, giving more bass or treble according to the position of these structures.18,24Thus, the stasis of pasty food modified speech and decreased the aspects considered not normal and re-duced the evaluator’s perception of the grade of alteration, which can be associated with changes in the sound wave caused by the presence of food.11Nevertheless, the changes related to swallowing liquids and solids are not able to change this perception. The consumption of liquid is a beneficial resource for vocal production as it reduces the salivary viscosity and decreases dryness of the tract after long-term use, with little immediate benefits perceived aurally.25In case of change in motility for this consistency, no impact occurs on the voice after swallowing when there is no adherence of the material in the tract modifying the passage of sound. So as observed in a previous study, the use of liquid food for voice variability evaluation after swallowing shows little sensitivity because there is no immediately perceptible voice modifi ca-tion even in cases of tracheal aspiraca-tion.16In solid swallow-ing, it is believed that this change will not occur once the food causes a mechanical obstruction, leading to discomfort due to prolonged transit time of food, which affects effective breath-ing; phonation is performed only when there is clearance of the tract after conducting multiple swallows,26,27as observed in the tests performed.
Beyond the modification of voice grade, the parameters of vocal effort also changed after swallowing. During the per-ceptual analysis, the judges characterized the voice by assign-ing a marker of vocal effort, either asthenia or strain.13,21 Individuals with vocal asthenia showed a decrease in this aspect after swallowing, consequently verifying higher strain; those who already had vocal strain had an increase of this parameter. The vocal strain is caused by the increased resistance of the vocal tract during passage of expiratory air, performed in an attempt to compensate for structural changes or a lack of balance between air and vocal muscle use during phonation, with excessive muscular effort during emission.18,28This effort also occurs during coughing, when the muscles contract abruptly to expel a foreign body.29When there is food residue in the tract, phonation occurs with more effort to keep the usual voice pattern, because the food causes obstruction, demonstrating that the increased vocal strain is associated with the attempt to maintain a normal pattern of speech and withdrawing food deposited in the tract.11,14
Although there is scarce literature about the use of voice modifications to evaluate dysphagia, it is based primarily on clinical identification of the presence of wet voice after swallowing.30,31 Although commonly described as being a characteristic of voice in which there is a change in the usual pattern after swallowing, no features describe this variability in the literature, as opposed to the concepts of other vocal classifications observed.11,16,21This aspect complicates the standardization of analyses made by professionals in the area, because it involves subjective characterization with little scientific background. No significant change in this parameter before and after swallowing was observed in this study. As discussed in previous studies, this vocal characterization is sensitive and it is not always possible to identify individuals with alterations; the subjectivity and lack of standardization cause poor reproducibility between evaluators, reflecting a poor diagnostic prediction for dysphagia.11,16
Despite the importantfindings presented in this study, it is necessary to point out some limitations, among them, the sample size. Other authors who studied this method of evaluation also had this same difficulty concerning the lim-itations of the patients, because participation and integrity of oropharyngeal structures are necessary. In addition, the use of gold standard methods for evaluation are restricted to individuals who have conditions to accomplish such evalua-tion.11,14–16Even with this limitation, the results corroborate previous studies and demonstrate that this method of evalu-ation shows specificity to differentiate individuals without swallowing disorder.16,31
Further studies should be conducted to confirm our data to better standardize the use of voice assessment as a method of identification for oropharyngeal dysphagia. Other data ob-tained from this same sample demonstrating the use of parameters of vocal self-perception, acoustic voice analysis and comparison between voice modifications and video-fluoroscopic examination will be presented in other publica-tions to probe studies in this area.
Conclusion
Based on the data presented in this study, after swallowing pasty food, individuals with dysphagia decreased the grade of vocal alteration and increased strain, with no change in these vocal parameters for individuals without swallowing disorder, demonstrating its specificity for clin-ical use in the detection of oropharyngeal dysphagia. Nevertheless, the use of the wet voice parameter was not found to contribute to indicating this disorder, requiring further studies and standardization like other vocal parameters used in this study to allow a reliable evaluation for clinical applicability.
References
2 Hadley AJ, Kolb I, Tyler DJ. Laryngeal elevation by selective stimula-tion of the hypoglossal nerve. J Neural Eng 2013;10(4):046013 3 Pearson WG Jr, Hindson DF, Langmore SE, Zumwalt AC. Evaluating
swallowing muscles essential for hyolaryngeal elevation by using muscle functional magnetic resonance imaging. Int J Radiat Oncol Biol Phys 2013;85(3):735–740
4 Wang J, Li WY, Zhang ZH, et al. [Assessment of dysphagia: report of 37 cases]. Zhonghua Er Bi Yan Hou Tou Jing Wai Ke Za Zhi 2012; 47(11):889–893
5 American Speech-Language-Hearing Association. Guidelines for speech-language pathologists performing videofluoroscopic swal-lowing studies. 2004. Available at: http://www.asha.org/policy/ GL2004-00050/. Accessed April 28, 2014
6 Titsworth WL, Abram J, Fullerton A, et al. Prospective quality initiative to maximize dysphagia screening reduces hospital-ac-quired pneumonia prevalence in patients with stroke. Stroke 2013;44(11):3154–3160
7 Ko MJ, Kang MJ, Ko KJ, Ki YO, Chang HJ, Kwon JY. Clinical usefulness of Schedule for Oral-Motor Assessment (SOMA) in children with dysphagia. Ann Rehabil Med 2011;35(4):477–484
8 Kjaersgaard A, Nielsen LH, Sjölund BH. Randomized trial of two swallowing assessment approaches in patients with acquired brain injury: facial-oral tract therapy versusfibreoptic endoscopic evaluation of swallowing. Clin Rehabil 2014;28(3):243–253 9 Padovani AR, Moraes DP, Mangili LD, Andrade CRF. Protocolo
Fonoaudiológico de Avaliação do Risco para Disfagia (PARD). Rev Soc Bras Fonoaudiol. 2007;2(3):199–205
10 Daniels SK, Anderson JA, Willson PC. Valid items for screening dysphagia risk in patients with stroke: a systematic review. Stroke 2012;43(3):892–897
11 Groves-Wright KJ, Boyce S, Kelchner L. Perception of wet vocal quality in identifying penetration/aspiration during swallowing. J Speech Lang Hear Res 2010;53(3):620–632
12 O’Neil KH, Purdy M, Falk J, Gallo L. The dysphagia outcome and severity scale. Dysphagia 1999;14(3):139–145
13 Hirano M. Clinical Examination of Voice. New York, NY: Springer-Verlag; 1981
14 Malandraki GA, Hind JA, Gangnon R, Logemann JA, Robbins J. The utility of pitch elevation in the evaluation of oropharyngeal dysphagia: preliminaryfindings. Am J Speech Lang Pathol 2011; 20(4):262–268
15 Warms T, Richards J.“Wet voice”as a predictor of penetration and aspiration in oropharyngeal dysphagia. Dysphagia 2000;15(2):84–88
16 Waito A, Bailey GL, Molfenter SM, Zoratto DC, Steele CM. Voice-quality abnormalities as a sign of dysphagia: validation against acoustic and videofluoroscopic data. Dysphagia 2011;26(2):125–134 17 Cleveland TF. A clearer view of singing voice production: 25 years
of progress. J Voice 1994;8(1):18–23
18.Behlau M. Voz: o livro do especialista. Vol. 2. Rio de Janeiro, Brazil: Revinter; 2008
19 Rouquayrol MZ, Almeira N. Epidemiologia e Saúde. Rio de Janeiro, Brazil: Medsi; 2000
20 Kreiman J, Gerratt BR, Kempster GB, Erman A, Berke GS. Perceptual evaluation of voice quality: review, tutorial, and a framework for future research. J Speech Hear Res 1993;36(1):21–40
21.Behlau M. Voz: o livro do especialista. Vol. 1. Rio de Janeiro, Brazil: Revinter; 2001
22 Dantas RO, Dodds WJ. Influência da viscosidade do bolo alimentar deglutido na motilidade da faringe. Arq Gastroenterol 1990;27(4): 164–168
23 Prodomo LPV. Caracterização videofluoroscópica da fase faríngea da deglutição [dissertation]. Fundação Antonio Prudente: São Paulo; 2010
24 Sundberg J. Perception of singing. STL-QPSR 1979;20(1):1–48 25 Fujita R, Ferreira AE, Sarkovas C. Avaliação videoquimográfica da
vibração de pregas vocais no pré e pós hidratação. Rev Bras Otorrinolaringol (Engl Ed) 2004;70(6):742–746
26 Vivone GP, Tavares MMM, Bartolomeu RS, Nemr K, Chiappetta ALML. Análise da consistência alimentar e tempo de deglutição em crianças com paralisia cerebral tetraplégica espástica. Rev CEFAC 2007;9(4):504–511
27 Moro ET. Prevenção da aspiração pulmonar do conteúdo gástrico. Rev Bras Anestesiol 2004;54(2):261–275
28 Koishi HU, Tsuji DH, Imamura R, Sennes LU. Variação da intensi-dade vocal: estudo da vibração das pregas vocais em seres humanos com videoquimografia. Rev Bras Otorrinolaringol (Engl Ed) 2003;69(4):464–470
29 Gibson PG, Vertigan AE. Speech pathology for chronic cough: a new approach. Pulm Pharmacol Ther 2009;22(2):159–162 30 Murugappan S, Boyce S, Khosla S, Kelchner L, Gutmark E. Acoustic
characteristics of phonation in“wet voice”conditions. J Acoust Soc Am 2010;127(4):2578–2589