Copyright © 2004 by Sociedade Brasileira de Pediatria
O
RIGINALA
RTICLE447
1. M.Sc. Pediatrician, Hospital Márcio Cunha. Professor, School of Medicineof Vale do Aço, Ipatinga, MG, Brazil.
2. Ph.D. Full professor of Pediatrics, School of Medicine, Universidade Federal de Minas Gerais (UFMG), Belo Horizonte, MG, Brazil. 3. Ph.D. Adjunct professor, Department of the Locomotor System, School of
Medicine, Universidade Federal de Minas Gerais (UFMG), Belo Horizonte, MG, Brazil.
4. Pediatrician, Hospital Márcio Cunha. Professor of Pediatrics, School of Medicine of Vale do Aço, Ipatinga, MG, Brazil.
Manuscript received Dec 16 2003, accepted for publication Aug 11 2004. Suggested citation: Gaspar VL, Lamounier JA, Cunha FM, Gaspar JC. Factors related to hospitalization due to injuries in children and adolescents. J Pediatr (Rio J). 2004;80:447-52.
Abstract
Objective: To analyze some factors related to injuries and children and adolescents hospitalization.
Methods: This is a prospective, descriptive and observational research that took place at Márcio Cunha Hospital, Ipatinga, Minas Gerais, in the period of December 1st, 1999 to November 30th, 2000. The sample included 696 children and adolescents hospitalized for injuries, ages ranging from 0 to 19 years old. The International Statistical Classification of Diseases and Related Health Problems (10th version) was used as a parameter to classify the types of injuries and sites where they happened.
Results: The injuries represented 9.9% of children and adolescents hospitalizations, of which, 69.7% were male patients. As for the informants opinion about causes of injuries, 57.2% attributed then to human failure, 18% believed they were due to fate and 12.7% did not know how to express their opinions. Only 23.1% of the informants had received previous orientation about prevention and the main sources were media, school and work place. A total of 31.9% of the events took place at home. Transportation injuries caused 34.5% of hospitalizations; falls, 33.2%; exposure to inanimate mechanical forces, 9%; contact with poisonous animals, 5.2%; aggression, 5%; burns, 4.9%; exposure to animated mechanical forces, 3.3%; intoxication, 2.3%; and other types, 2.6%.
Conclusions: Males were more affected than females. Only a low percentage of the informants had received previous orientation about injury prevention. The most affected age group was between 15 and 19 years. Transportation accidents and falls were the most frequent causes of injuries.
J Pediatr (Rio J). 2004;80(6):447-52: Injury prevention, causes of injury, transportation injury, falls.
Factors related to hospitalization
due to injuries in children and adolescents
Vera L. V. Gaspar,1 Joel A. Lamounier,2 Fernando M. Cunha,3 José C. Gaspar4
Introduction
In Brazil, in 2001, according to Datasus,1 the external
causes of morbidity and mortality resulted in 21,526 deaths of children and adolescents, being the major cause of death among individuals aged between one and 19 years. Most of the deaths (13,657) occurred among adolescents between 15 and 19 years old.1 Another
relevant aspect is that for each person who dies there are
many other victims who survive their injuries and need hospitalization, emergency care and outpatient treatment.2 Danseco et al.3 estimated that one in every
four children or adolescents suffers some kind of injury every year, which requires medical care or limits their activities. We should also take into consideration the emotional distress, sequelae, and untimely deaths that result from injuries.
The study carried out by Agran et al.4 on hospitalization
and death from injuries in the 0-19-year-old group revealed that the highest rate was related to transportation accidents. Traffic safety is a public health problem and also involves many other sectors, which should all be committed to accident prevention.5
The current view about injuries is that both intentional and unintentional injuries are mostly preventable, and that their frequency varies according to age, gender, social class and geographical region.2 According to Blank,6
preventive strategies. Thus, the collection of data on injuries should be the first step towards prevention, as this information is essential for policy-makers to allocate more resources to their prevention.7
There is a paucity of prospective Brazilian studies on the hospitalization of children and adolescents because of injuries. Therefore, the aim of the present study is to analyze some factors related to injury hospitalizations in children and adolescents.
Methods
A prospective, descriptive and observational study was conducted at Hospital Márcio Cunha (HMC), a regional specialty center, located in Ipatinga, a town in the eastern region of the state of Minas Gerais, 217 km far from state capital Belo Horizonte. The study included children and adolescents aged between 0 and 19 years, who had to be hospitalized because of injuries. We did not include injured patients who remained under observation in the emergency room; only those who required hospitalization due to the severity of their injuries or due to the necessity of more complex therapeutic or investigative procedures were included.
The study protocol was approved by the Ethics Committee of HMC. The data were collected between December 1st 1999 and November 30, 2000. Parents, primary caregivers or adolescents were interviewed during hospital stay after having agreed to participate in the study. The interviews consisted of an individual questionnaire. Only the interviewee and the interviewer were allowed to stay in the room, in addition to the patient, whenever possible. The best time and occasion was arranged for the interview according to the interviewees availability. The questionnaire contained questions about sociodemographic variables, patients or caregivers opinions about the causes of injury, previous instructions on prevention, circumstances, types of injuries and diagnosis. Two staff pediatricians and two previously trained sixth-year medical students conducted the interview. The previous training of the students allowed for a uniform approach to the families and uniform data collection procedures. A pilot study with 10 patients was carried out in November 1999 so as to assess the efficiency of the questionnaire.
The data were analyzed using Epi-Info 6.04. Out of 7,082 children and adolescents hospitalized during the study period, 702 (9.9%) were hospitalized due to injuries. The final sample comprised 696 patients, since one parent refused to participate in the study and patient data could not be obtained in five cases.
The distribution of patients according to the types of injury and place where they occurred was based on the International Statistical Classification of Diseases and Related Health Problems, tenth revision, (ICD-10),8
volume 1, chapter XX. The data about the places at home where the events occurred are not from the same source, given the fact that ICD-10 does not include this information.
For statistical analysis, a chi-square test for linear trend was used to compare the proportion of types of injuries according to age. When two types of injuries were compared and the test result showed a similar proportion of injuries, according to age (p > 0.05), these types were placed in a single group. The odds ratio result quantifies the chance for individuals in a certain age group to have that group of injuries in relation to a standard age group, which, herein, corresponds to younger than 1 year old.
Results
The youngest patient was 16 days old and the oldest one was 19 years old, 10 months and 29 days. The mean age was 9.8±6.2 years; 485 (69.7%) patients were male and 211 (30.3%) were female, which corresponds to a 2.3:1 male/female ratio. As for the place where injuries occurred, 272 (39.1%) happened at home and 424 (60.9%) outside the home (Table 1). The results regarding the opinion of interviewees about the causes of injuries are shown in Table 2.
Table 1 - Place where injuries occurred
Home n %
Yard 90 33.1
Room 48 17.7
Kitchen 40 14.7
Porch 21 7.7
Stairs 20 7.4
Other 53 19.4
Total 272 100
Outside the home n %
Street, road, sidewalk, highway 286 67.5 Schools, other institutions and
public administration areas 59 13.9 Farm (rural real state) 38 9.0
Other 41 9.6
Total 424 100
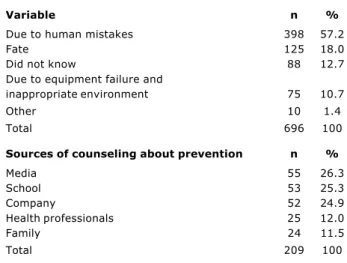
Table 2 - Opinion of interviewees about the causes of injuries and sources of counseling about prevention
Variable n %
Due to human mistakes 398 57.2
Fate 125 18.0
Did not know 88 12.7
Due to equipment failure and
inappropriate environment 75 10.7
Other 10 1.4
Total 696 100
Sources of counseling about prevention n %
Media 55 26.3
School 53 25.3
Company 52 24.9
Health professionals 25 12.0
Family 24 11.5
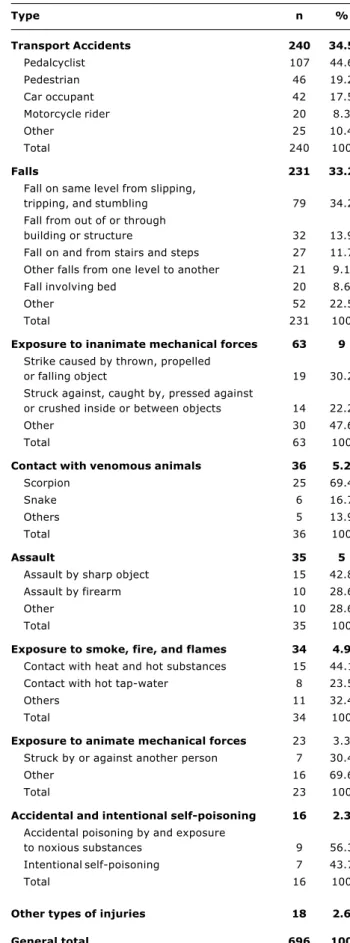
Table 3 - Distribution of hospitalizations regarding the types of injuries
Type n %
Transport Accidents 240 34.5
Pedalcyclist 107 44.6
Pedestrian 46 19.2
Car occupant 42 17.5
Motorcycle rider 20 8.3
Other 25 10.4
Total 240 100
Falls 231 33.2
Fall on same level from slipping,
tripping, and stumbling 79 34.2 Fall from out of or through
building or structure 32 13.9 Fall on and from stairs and steps 27 11.7 Other falls from one level to another 21 9.1 Fall involving bed 20 8.6
Other 52 22.5
Total 231 100
Exposure to inanimate mechanical forces 63 9 Strike caused by thrown, propelled
or falling object 19 30.2 Struck against, caught by, pressed against
or crushed inside or between objects 14 22.2
Other 30 47.6
Total 63 100
Contact with venomous animals 36 5.2
Scorpion 25 69.4
Snake 6 16.7
Others 5 13.9
Total 36 100
Assault 35 5
Assault by sharp object 15 42.8 Assault by firearm 10 28.6
Other 10 28.6
Total 35 100
Exposure to smoke, fire, and flames 34 4.9 Contact with heat and hot substances 15 44.1 Contact with hot tap-water 8 23.5
Others 11 32.4
Total 34 100
Exposure to animate mechanical forces 23 3.3 Struck by or against another person 7 30.4
Other 16 69.6
Total 23 100
Accidental and intentional self-poisoning 16 2.3 Accidental poisoning by and exposure
to noxious substances 9 56.3 Intentional self-poisoning 7 43.7
Total 16 100
Other types of injuries 18 2.6
General total 696 100
When asked about whether they had received previous instructions on injury prevention, 161 (23.1%) interviewees answered yes to this question, among whom 120 received instructions from more than one source, totaling 209 sources of information, whose distribution is presented in Table 2. The data on the distribution of hospitalizations regarding the types of injuries are shown in Table 3.
Of 240 patients who suffered transportation accidents, 103 (42.9%) were aged between 15 and 19 years. This age group was predominant among all modalities of this type of accident, except for pedestrian accidents, which were the most frequent type among children aged between 5 and 9 years old, totaling 22 (47.8%) events. Of patients who fell victims to transportation accidents, 107 (44.6%) were cyclists; 84 (78.5%) of whom were riders and 23 (21.5%), pillion passengers. Among the riders, 10 (11.9%) carried a pillion passenger. Thus, there were 33 (30.8%) accidents in which the bicycle carried more than one person at the time of injury. None of the cyclists was wearing a helmet.
With regard to falls, 79 (34.2%) occurred on the same level and 20 (8.6%) accounted for children who fell off the bed; of these, 13 (65%) were younger than one year.
Notably, among the accidents related to the exposure to inanimate mechanical forces, 25 (39.7%) occurred in the workplace.
Out of six patients with snakebites, five were bitten on the feet; four were barefoot and one was wearing sandals.
Contact with heat sources or with hot substances and exposure to fire and flames totaled 34 (4.9%) hospitalizations; of these, 31 (91.2%) happened at home, 19 (61.3%) of which occurred in the kitchen.
With regard to 16 patients with intoxication, nine (56.3%) were female; six (37.5%) occurred in children aged between one and four years and were unintentional; five (31.3%) occurred in female adolescents between 15 and 19 years old and were intentional.
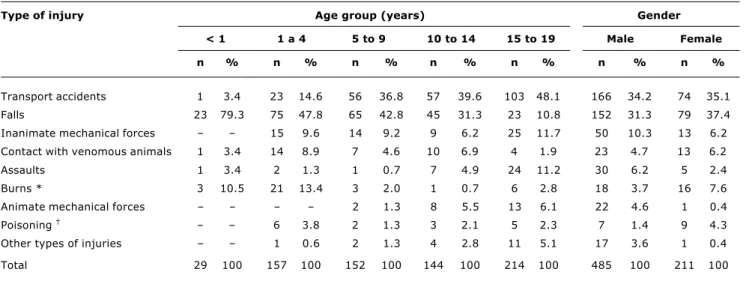
Patient distribution per type of injury according to age and gender is shown in Table 4.
In Table 5, the result of the chi-square test for linear trend shows that by considering the younger than one year old group as standard, the risk for transportation accidents, exposure to inanimate mechanical forces and other types of injuries increases continually and in direct proportion to age. On the other hand, injuries involving exposure to animate mechanical forces and aggressions decrease up to the age of nine years, increasing in the subsequent ages. An opposite behavior is observed in accidents that involve burns, which increase in the 1-4-year-old group and decrease in subsequent ages. Injuries resulting from falls, contact with animals and intoxications have a lower risk as age advances.
Type of injury Age group (years) Gender
< 1 1 a 4 5 to 9 10 to 14 15 to 19 Male Female
n % n % n % n % n % n % n %
Transport accidents 1 3.4 23 14.6 56 36.8 57 39.6 103 48.1 166 34.2 74 35.1 Falls 23 79.3 75 47.8 65 42.8 45 31.3 23 10.8 152 31.3 79 37.4 Inanimate mechanical forces 15 9.6 14 9.2 9 6.2 25 11.7 50 10.3 13 6.2 Contact with venomous animals 1 3.4 14 8.9 7 4.6 10 6.9 4 1.9 23 4.7 13 6.2 Assaults 1 3.4 2 1.3 1 0.7 7 4.9 24 11.2 30 6.2 5 2.4 Burns * 3 10.5 21 13.4 3 2.0 1 0.7 6 2.8 18 3.7 16 7.6 Animate mechanical forces 2 1.3 8 5.5 13 6.1 22 4.6 1 0.4 Poisoning 6 3.8 2 1.3 3 2.1 5 2.3 7 1.4 9 4.3
Other types of injuries 1 0.6 2 1.3 4 2.8 11 5.1 17 3.6 1 0.4
Total 29 100 157 100 152 100 144 100 214 100 485 100 211 100 Table 4 - Patient distribution per type of injury according to age and gender
* Contact with heat and hot substances and exposure to fire and flames.
† Accidental poisoning and intentional self-poisoning.
Odds ratio
Age group (years) < 1 1 to 4 5 to 9 10 to 14 15 to 19 p *
Transport accidents, inanimate
mechanical forces, other types of injuries 1 5.05 18.26 25.76 49.82 0.00 Falls, contact with animals, poisoning 1 0.32 0.2 0.14 0.04 0.00
Animate mechanical forces, assaults 1 0.36 0.56 3.26 5.85 0.00
Burns 1 1.34 0.17 0.06 0.25 0.00
Table 5 - Comparison of the proportion of types of injury according to the age group
* Chi-square test of linear trend.
† Accidental poisoning and intentional self-poisoning.
‡ Contact with heat and hot substances and exposure to fire and flames. Discussion
In this study, injury hospitalizations accounted for 9.9% of total hospital admissions of children and adolescents. This proportion reflects the importance of this issue, although it is still underestimated in our setting.6
As to gender, there was a male predominance (2.3:1), which is consistent with several other studies.1,3,9 This
difference may be explained by the fact that male individuals have a riskier behavior.9
Even though injuries are mostly seen as preventable nowadays,2 this is not what was observed in a significant
percentage of interviewees in this study, since 18% of them believed injuries were unavoidable acts of fate. Those who are unaware of the causes of injuries should be
warned about risk factors. On the other hand, the percentage of interviewees who had already received instructions on injury prevention was too low, much smaller than that of the other Brazilian study.10 A strategy
to prevent injuries in children is to educate the population.11 According to Brent & Weitzman,12
pediatricians are supposed to perform this role, providing parents with information about environmental risks.
In the present study, the highest percentage of transportation accidents involved cyclists and in 30.8% of them, the bicycle carried more than one person at the time of the accident, which is a risk factor, since it affects stability and increases the time for emergency braking.13 Although
several head traumas can be avoided by helmet use,14,15
none of the patients were wearing one at the time of the injury, which also was observed by Pereira et al.,16 however,
Ortega et al.,17 in Ohio, USA, reported that 26.1% of cyclists
were wearing a helmet.
Falls ranked second as a cause for hospitalization. According to the World Health Organization2 they rank fifth
as cause of burden of disease in the 5-to-14-age-year-old group. Among infants younger than one year, falls were the major type of injury, which also was observed in other studies.18-20 According to Pickett et al.,21 falls in this age
group could be avoided if parents or caregivers had perceived the risks beforehand and done something to prevent them. Among injuries related to the exposure to inanimate mechanical forces, 39.7% occurred in the workplace. Adolescents, who are not skilled enough to operate machines, are at great risk of suffering injuries. Therefore, it is important that they are properly instructed on how to operate the machines and that they are supervised.22
With regard to snakebites, the bites on the feet could be prevented by the wearing of appropriate shoes, which is a widely known and efficient measure. Gikas23 suggests
wearing calf-length boots to prevent snakebites.
As for firearm injuries, male adolescents aged between 15 and 19 years were the main victims. Preventing access to firearms by children and adolescents is the best strategy to reduce this type of injury.24
Burns, resulting from the contact with hot foods and hot water, occurred mainly at home, in the kitchen, which is a place of risk verified by other authors.12,25,26 According to
Agran et al.,19 the peak incidence of burns occurs between
12 and 14 months of life.
Intoxications, despite the small number of cases, were the only type of injury that affected the largest number of females, resulting from suicide attempts among females adolescents. The 1-4-year-old group showed greater risk for unintentional intoxications.
The largest frequency of injuries was observed among adolescents aged between 15 and 19 years old, a fact that was also observed in the data collected by Datasus.1
The analysis of data on the type of injuries according to age showed that the percentage of transportation accidents increased with age; conversely, the percentage of falls decreased.
The distribution of the major types of hospitalization injuries according to age helps the implementation of preventive measures. Thus, parents of infants younger than one year should be warned against the risks of falls, especially off the bed, and burns; those who have children aged between 1 and 4 years should be warned about the risks of falls, burns and transportation accidents; those with children aged between 5 and 9 years old should be informed about the risks of falls, transportation accidents, especially
involving pedestrians, and about injuries resulting from the exposure to inanimate mechanical forces; adolescents aged between 10 and 14 years old should be informed about the prevention of transportation accidents, falls and injuries related to the contact with venomous animals; adolescents between 15 and 19 years old should be warned against the risks of transportation accidents, injuries related to the exposure to inanimate mechanical forces and aggressions. The study was limited by the characteristics of HMC, which might have influenced the profile of hospitalized patients, as this hospital often treats severely ill patients who need to be cared for by specialists, who need imaging exams and/or intensive care. We did not include patients who had died before getting to the hospital, those who died in the emergency room, or those who did not require hospitalization.
Therefore this is not an epidemiological study. However, the findings and the information about the frequency of injuries that require hospitalization and about some factors related to injuries in children and adolescents may help the implementation of preventive measures.
Acknowledgments
We thank Dr. Márcio Neves Franco and Dr. Fabrício Bride Soares for helping with the interviews, and Marcelo Militão Abrantes for the statistical analysis.
References
1. Ministério da Saúde [site na Internet]. Sistema de Informações sobre Mortalidade. Óbitos por ocorrência segundo faixa etária. Capítulo CID-10:XX. Causas externas de morbidade e mortalidade Brasil; 2001 [citado 19 de abril de 2004]. [aproximadamente 3 telas]. Disponível em: http:// tabnet.datasus.gov.br/cgi/tabcgi.exe?sim/cnv/obtuf.def 2. Peden M, McGee K, Krug E, editors. Injury: a leading cause of
the global burden of disease, 2000. Geneva: World Health Organization; 2002.
3. Danseco ER, Miller TR, Spicer RS. Incidence and costs of 1987-1994 childhood injuries: demographic breakdowns. Pediatrics. 2000;105(2):E27.
4. Agran PF, Winn D, Anderson C, Trent R, Walton-Haynes L. Rates of pediatric and adolescent injuries by year of age. Pediatrics. 2001;108(3):E45.
5. Peden M, Scurfield R, Sleet D, Mohan D, Hyder AA, Jarawan E, et al. The fundamentals. In: World report on road traffic injury prevention. Geneva: World Health Organization; 2004. p. 3-29. 6. Blank D. Prevenção e controle de injúrias físicas: saímos ou não
do século 20? J Pediatric (Rio J). 2002;78:84-6.
7. Peden M, McGee K, Sharma G. The injury chart book: a graphical overview of the global burden of injuries [revista eletrônica].[citado 3 de julho de 2004]; Geneva: World Health Organization; 2002; [aproximadamente 76 p.]. Disponível em: http://www5.who.int/violence_injury_prevention
8. Organização Mundial da Saúde. Causas Externas de Morbidade e de Mortalidade. In: Classificação Estatística Internacional de Doenças e Problemas Relacionados à Saúde. Décima Revisão. Volume 1. São Paulo: Edusp; 1997. p. 969-1076.
9. Spady DW, Saunders DL, Schopflocher DP, Svenson LW. Patterns of injury in children: a population-based approach. Pediatrics. 2004;113:522-9.
11. Ramsay LJ, Moreton G, Gorman DR, Blake E, Goh D, Elton RA, et al. Unintentional home injury in preschool-aged children: looking for the key - an exploration of the inter-relationship and relative importance of potential risk factors. Public Health. 2003;117:404-11.
12. Brent RL, Weitzman M. The pediatricians role and responsibility in educating parents about environmental risks. Pediatrics. 2004;113:1167-72.
13. Committee on Injury and Poison Prevention American Academy of Pediatrics. Recreational activities and vehicles. In: Injury Prevention and Control for Children and Youth. 3rd ed. Elk Grove Village: AAP; 1997. p. 339-78.
14. Rivara FP, Thompson DC, Thompson RS. Bicycle helmets: its time to use them. BMJ. 2000;321:1035-6.
15. Cook A, Sheikh A. Trends in serious head injury among cyclist in England: analysis of routinely collected data. BMJ. 2000;321:1055.
16. Pereira CU, Abud LN, Abud FN, Leite RT. Traumatismo craniencefálico por acidente com bicicleta. Arq Bras Neurocir. 2000;19:83-7.
17. Ortega HW, Shields B J, Smith GA. Bicycle-related injuries to children and parental attitudes regarding bicycle safety. Clin Pediatr (Phila).2004;43:251-9.
18. Waisman I, Núñez J M, Sánchez J. Epidemiología de los accidentes en la infancia en la región Centro Cuyo. Rev Chil Pediatr. 2002;73:404-14.
19. Agran PF, Anderson C, Winn D, Trent R, Walton-Haynes L, Thayer S. Rates of pediatric injuries by 3-month intervals for children 0 to 3 years of age. Pediatrics. 2003;111(6 Pt 1):e683-92. 20. Powell E C, Tanz RR. Adjusting our view of injury risk: the burden
of nonfatal injuries in infancy. Pediatrics. 2002;110:792-6.
21. Pickett W, Streight S, Simpson K, Brison RJ. Injuries experienced by infant children: a population - based epidemiological analysis. Pediatrics. 2003;111(4 Pt 1):e365-70.
22. Committee on Injury and Poison Prevention American Academy of Pediatrics. Injuries in the workplace. In: Injury Prevention and Control for Children and Youth. 3rd ed. Elk Grove Village: AAP; 1997. p. 119-34.
23. Gikas RMC. Animais peçonhentos. In: Waksman RD, Gikas RMC. Segurança na infância e adolescência. São Paulo: Atheneu; 2003. p. 165-75.
24. Committee on Injury and Poison Prevention American Academy of Pediatrics. Firearm-Related injuries affecting the pediatric population. Pediatrics. 2000;105:888-95.
25. Waksman RD, Gikas RMC. Papel do pediatra no desenvolvimento do comportamento seguro. In: Waksman RD, Gikas RMC. Segurança na infância e adolescência. São Paulo: Atheneu; 2003. p. 21-31.
26. Razzak JA, Luby SP, Laflamme L, Chotani H. Injuries among children in Karachi, Pakistan - what, where and how. Public Health. 2004;118:114-20.
Corresponding author: Vera Lúcia Venâncio Gaspar Rua Jequitibá, 688, Horto CEP 35160-306 Ipatinga, MG Brazil