Copyright © 2004 by Sociedade Brasileira de Pediatria
O
RIGINALA
RTICLE495
1. M.Sc., Institute of Social Medicine, Universidade do Estado do Rio deJaneiro (IMS/UERJ). Pediatrician, Instituto Fernandez Figueira, Fundação Oswaldo Cruz, Rio de Janeiro, RJ, Brazil.
2. Epidemiologist. Professor, Institute of Social Medicine, Department of Epidemiology, Universidade Estadual do Rio de Janeiro (UERJ), Rio de Janeiro, RJ, Brazil.
3. Clinic psychologist. M.Sc., Pontifícia Universidade Católica do Rio de Janeiro (PUC/RJ), Rio de Janeiro, RJ, Brazil.
4. Clinic psychologist.
* This study was carried out at Instituto Fernandes Figueira (FIOCRUZ), in collaboration with FIOCRUZ and the Institute of Social Medicine of Universidade do Estado do Rio de Janeiro (IMS/UERJ). This study is part of the Master’s dissertation in Collective Health – IMS/UERJ, Epidemiology – 1999: Como estão sobrevivendo os pequenos prematuros? Um olhar sobre a população do Instituto Fernandes Figueira.
Manuscript received Mar 30 2004, accepted for publication Aug 25 2004. Suggested citation: Méio MD, Lopes CS, Morsch DS, Monteiro AP, Rocha SB, Borges RA, et al. Pre-school cognitive development of very low birth weight preterm children. J Pediatr (Rio J). 2004;80:495-502.
Abstract
Objective: To examine the cognitive development of school-aged children born preterm and with very low birthweight.
Methods: A cohort of premature infants born between January, 1991, and September, 1993 was examined at pre-school age. All fo them were born in a public Neonatal Intensive Care Unit, with birth weight less than 1,500g. The WPPSI-R Test was used for cognitive evaluation and applied by psychologists. Babies with malformations, genetic syndromes, congenital infections, transferred from other institutions or born at home, and those with conditions which precluded the application of the test, were excluded. A group of pre-school children in the same city, born at term, were tested for comparison.
Results: 79 children were studied, with mean birthweight 1,219.6 g (±168.9); of these, 44 (72.1%) attended school. No significant statistical difference was found between the groups (study and loss). The WPPSI-R Test mean scores were: 75.6±11.9 (total); 77±12.9 (performance) and 78.6±11.1 (verbal) for the study group, and 85.1±13.2 (total); 85.3±13.8 (performance) and 87.7±13.9 (verbal) for the comparison group. This difference was significant for total (p < 0.0001), verbal (p < 0.0001) and performance scores (p = 0.002), as well as for the subtests of the WPPSI-R Test.
Conclusions: Children who entered this study showed to have a borderline intellectual functioning at the moment of the evaluation. Results indicate they may face learning difficulties at school, thus requiring adequate stimuli that should be provided by the family and the school.
J Pediatr (Rio J). 2004;80(6):495-502: Cognition, psychometric tests, premature, very low birthweight.
Pre-school cognitive development
of very low birth weight preterm children
Maria D. B. B. Méio,1 Claudia S. Lopes,2 Denise S. Morsch,3 Ana P. G. Monteiro,4 Simone B. Rocha,4 Rosane A. Borges,4 Ana B. Reis4
Introduction
The higher survival rate in the neonatal period as a result of improved neonatal intensive care may influence the neuropsychomotor development of low-birthweight infants. Only the prevalence of severe sequelae, such as cerebral palsy, severe visual and hearing impairment, is not enough to assess the quality of survival in this age group. Studies have shown various disorders in motor, cognitive and behavioral areas, which may compromise the social life of these children.1,2
Preterm birth may pose risks to learning through cognitive and behavioral disorders, especially due to perception, attention and hyperactivity disorders.3-6 Bhutta et al.
birthweight and gestational age.2 According to Silbertin et
al.,7 cognitive disorders in general are observed at a later
stage and are grouped into developmental disabilities and disorganization disorders that affect mainly cognitive functions, such as memory and/or language, and that may be associated with psychomotor instability.
The aim of the present study was to assess cognitive development in the preschool period of very-low-birthweight infants, born in a public hospital in Rio de Janeiro, and to determine the cognitive development areas that were mostly affected. Part of the results has been previously published.8-11
Methods
This research is part of a cohort study conducted to investigate prognostic factors for abnormal cognitive development in very-low-birthweight preterm infants, born between January 1991 and September 1993.8 Preterm
infants with birthweight less than or equal to 1,500 g, discharged from the neonatal intensive care unit (NICU) of a public hospital of the city of Rio de Janeiro, were assessed between November 1996 and March 1998. Infants with congenital malformations, genetic syndromes, congenital infection, transferred from another hospital after the seventh day of life or who were born at home were excluded from the study. Exclusion criteria also included the presence of disorders that hindered the application of the chosen test: significant emotional disorder, autism, deafness, severe mental retardation, spastic quadriplegia and blindness. The study protocol was approved by the local Research and Ethics Committee. Newborn infants were classified according to their birthweight and gestational age, assessed by the Capurro method, used at the NICU at the time these infants were born, as appropriate for gestational age (AGA), small for gestational age (SGA) and large for gestational age (LGA), based on the intrauterine growth curve developed by Battaglia & Lubchenco.9
To assess cognitive development, we used the Wechsler Preschool and Primary Scale of Intelligence Revised (WPPSI-R).10 This test was applied by four psychologists
who were blinded to the patients medical chart information. While the test was being applied to the infants, their mothers were interviewed by another psychologist in a different room, after the infant allowed his/her mother to leave the room.
The WPPSI-R is a psychometric test that assesses intellectual functioning by measuring individual skills through different tasks, applied to children aged between three years and 11 months and seven years and three months. The childs performance is scored based on two subtest groups, the verbal scale and the performance scale. The verbal scale measures verbal memory and the ability to retain immediate and long-term verbal information, verbal comprehension, conceptual skills, ability to establish a relationship between numeric concepts and arithmetic operations, associative and rational
thinking, ability to summarize. The performance scale measures perceptual skills, analysis and synthesis, organization, visual motor coordination, spatial orientation and prediction, graphic visual-motor organization and planning. In the verbal scale, the assessed functions are influenced by the familys cultural environment, school education received and by the childs capacity to concentrate and pay attention. In the performance scale, the tested functions are influenced by the childs attention, concentration, motor functioning, vision, and perceptual skills. Scores between 85 and 115 are considered normal and values between 8 and 12 are considered as appropriate for different subtests. Concomitantly, a group of children in the same age group was assessed in a slum in the same city. This school was chosen for its similarity between the place of residence of families in both groups, which presupposes equivalent socioeconomic and cultural level of the two populations. After consent from the school, mothers were contacted and they answered a questionnaire about their childrens birth status. Only those children whose mothers informed they were born at full term and had not been admitted to an NICU were included in the study. Written consent was obtained from parents or primary caregivers.
The interrater reliability between the psychologists who applied the test revealed the following intraclass correlation coefficients (ICC): 0.82 (95%CI 0.56 1.00) for the total score, 0.89 (95%CI 0.71 1.00) for the verbal score and 0.91 (95%CI 0.24 1.00) for the performance score.11
The means and proportion of demographic, social and family characteristics and of the hospitalization diagnoses of this population were calculated. When losses were analyzed, the frequencies of prognostic factors and population characteristics were compared. The chi-square test and two-tailed Fishers exact test were used in situations in which the values of cells were lower than 5, and Students t test was used for equality of the means
of two independent samples for continuous variables. Epi-Info, version 6.0, and SPSS, version 6.1, were used for the statistical analysis.
Results
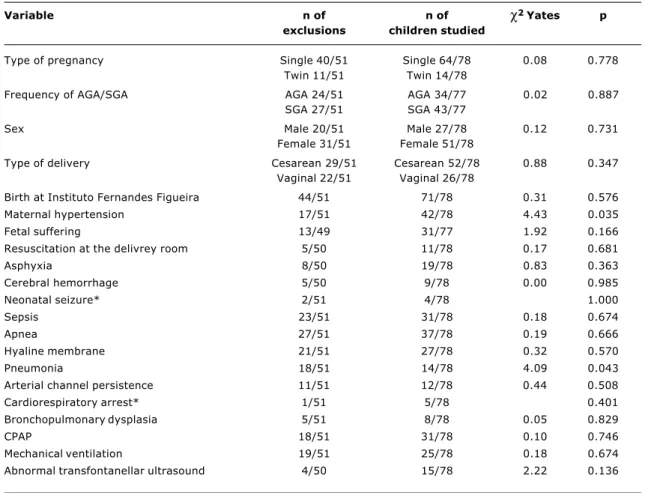
the results of the comparison between the study and excluded groups.
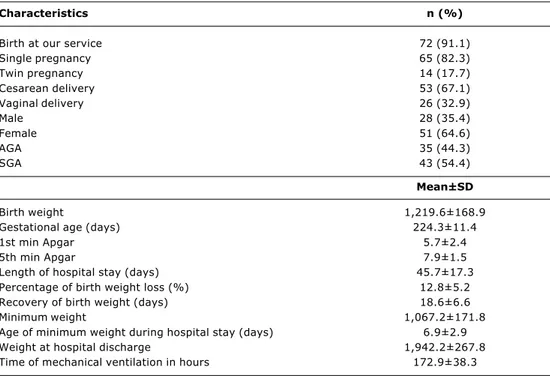
Table 3 shows the characteristics of the study population. Predominance of females and SGA infants was observed. The mean birthweight was 1,219.6 g (±168.9) with gestational age between 28 weeks and 36 weeks and three days. Mean maternal age at delivery was 27.4 years (±6.9), ranging from 11 to 42 years; 17.6% of the mothers (n = 13) were 20 years old or younger and 18.9% (n = 14) were 35 years old or older. None of the interviewed mothers was illiterate; most of them (56.1%) had not completed high school, and a large percentage of them (37.9%) had completed high school.
Most mothers (54.5%) did not have a job. There was predominance of married mothers (63.2%); 30.9% were separated and 5.9% were widowed. Income ranged from one to seven minimum wages (approximately US$ 87 to US$ 605) in 57.4% of the families; 38.2% had an income greater than eight minimum wages (around US$ 693) and only 4.4% of the families earned less than one minimum wage.
In the study group, 11 children presented mild neurological disorders: behavioral disorder (three), neuromotor dysfunction (four), diplegia (two), hemiplegia (three). No children presented with hearing impairment, one child had visual impairment and five had convergent strabismus. Thirty children received motor stimuli in the first years of life. Children were assessed at the average age of 55.4 months (±6.5), range of 48 to 71 months.
Information about school education was obtained for 61 children at the time of examination, 53 out of 61 children (86.8%) were attending school. In this group, 10 children had attended a day care center before entering school and eight were not in school yet. The mean age of entry to day care center was 28 months (SD 13.5, range of 6 to 48 months), with a higher frequency at 24 months. As for entry to school, mean age was 43.3 months (SD 8.1, range of 24 to 60 months), with a higher frequency at 48 months. At the time of evaluation, eight of 61 children were not attending school, 46 were in preschool, six were learning how to write and only one was attending the first grade.
Table 1 - Results of the comparison between the excluded and study groups regarding sex, birth place, pregnancy, type of delivery and prognostic factors present in the perinatal period
Variable n of n of
χ
2 Yates pexclusions children studied
Type of pregnancy Single 40/51 Single 64/78 0.08 0.778 Twin 11/51 Twin 14/78
Frequency of AGA/SGA AGA 24/51 AGA 34/77 0.02 0.887 SGA 27/51 SGA 43/77
Sex Male 20/51 Male 27/78 0.12 0.731 Female 31/51 Female 51/78
Type of delivery Cesarean 29/51 Cesarean 52/78 0.88 0.347 Vaginal 22/51 Vaginal 26/78
Birth at Instituto Fernandes Figueira 44/51 71/78 0.31 0.576 Maternal hypertension 17/51 42/78 4.43 0.035 Fetal suffering 13/49 31/77 1.92 0.166 Resuscitation at the delivrey room 5/50 11/78 0.17 0.681
Asphyxia 8/50 19/78 0.83 0.363
Cerebral hemorrhage 5/50 9/78 0.00 0.985 Neonatal seizure* 2/51 4/78 1.000
Sepsis 23/51 31/78 0.18 0.674
Apnea 27/51 37/78 0.19 0.666
Hyaline membrane 21/51 27/78 0.32 0.570
Pneumonia 18/51 14/78 4.09 0.043
Arterial channel persistence 11/51 12/78 0.44 0.508 Cardiorespiratory arrest* 1/51 5/78 0.401 Bronchopulmonary dysplasia 5/51 8/78 0.05 0.829
CPAP 18/51 31/78 0.10 0.746
Mechanical ventilation 19/51 25/78 0.18 0.674 Abnormal transfontanellar ultrasound 4/50 15/78 2.22 0.136
Table 2 - Results of the comparison between the mean birth weight, gestational age, length of hospital stay, weight loss during hospital stay and time for the recovery of birth weight, duration of mechanical ventilation and 1st and 5th min Apgar in the excluded and studied groups
Variable n of excluded/ Mean (SD) Mean (SD) T p
studied infants excluded infants studied infants
Gestational age (days) 51/77 225.7 ( 13.5) 224.3 ( 11.4) 0.639 0.524 Birth weight (g) 51/78 1,243.9 ( 183.4) 1,219.6 ( 168.9) 0.772 0.441 Length of hospital stay (days) 51/78 48.6 ( 19.8) 45.7 ( 17.3) 0.877 0.382 Minimum weight (g) 50/77 1,090.2 ( 174.4) 1,067.2 ( 171.8) 0.732 0.465 Age of minimum weight 50/77 7.2 ( 3.4) 6.9 ( 2.9) 0.540 0.590 Percentage of birth weight loss 50/77 12.7 ( 5.5) 12.8 ( 5.2) -0.177 0.860 Recovery of birth weight (days) 51/77 20 ( 7.3) 18.6 ( 6.6) 1.217 0.226 Weight at hospital discharge (g) 51/78 1,956.7 ( 275.6) 1,942.7 ( 267.8) 0.286 0.775 Ventilation (hours) 19/25 140.6 ( 120.1) 172.9 ( 38.3) -0.749 0.458 1st min Apgar 50/76 6.1 ( 2.3) 5.7 ( 2.4) 0.982 0.328 5th min Apgar 49/78 8.4 ( 1.1) 7.9 ( 1.5) 1.945 0.054
t test for comparison of mean of both independent samples. SD = standard deviation.
Table 3 - Characteristics of the study population regarding the neonatal factors
Total number of children studied = 79. AGA = adequate for gestational age; SGA = small for gestational age.
Characteristics n (%)
Birth at our service 72 (91.1) Single pregnancy 65 (82.3)
Twin pregnancy 14 (17.7)
Cesarean delivery 53 (67.1) Vaginal delivery 26 (32.9)
Male 28 (35.4)
Female 51 (64.6)
AGA 35 (44.3)
SGA 43 (54.4)
Mean±SD
Birth weight 1,219.6±168.9
Gestational age (days) 224.3±11.4
1st min Apgar 5.7±2.4
5th min Apgar 7.9±1.5
Length of hospital stay (days) 45.7±17.3 Percentage of birth weight loss (%) 12.8±5.2 Recovery of birth weight (days) 18.6±6.6 Minimum weight 1,067.2±171.8 Age of minimum weight during hospital stay (days) 6.9±2.9 Weight at hospital discharge 1,942.2±267.8 Time of mechanical ventilation in hours 172.9±38.3
As for the comparison group, since children were selected at school at preschool age, we do not have accurate information on neonatal characteristics, such as weight and neonatal age. However, we only selected children who were born at full term and who had stayed in a rooming-in facility. Schoolchildren were assessed at
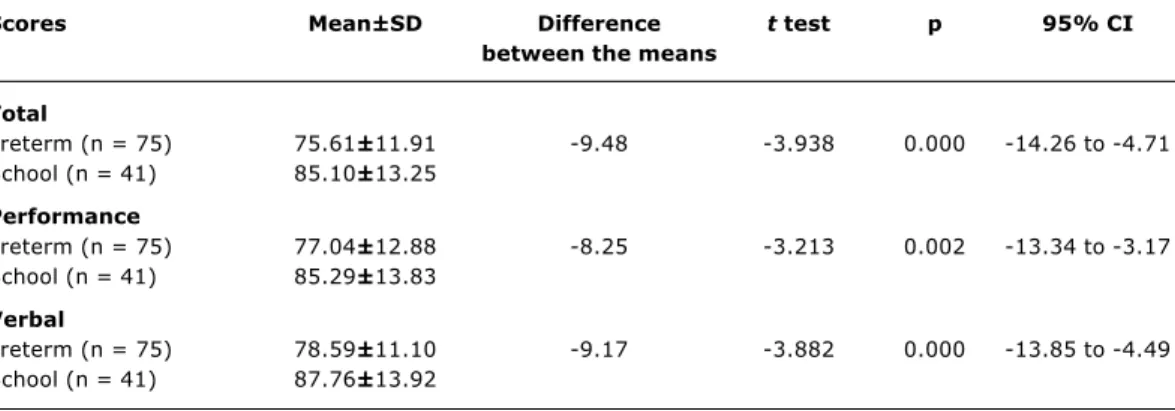
The mean total score of the WPPSI-R was 75.6±11.9. The mean performance score was 77±12.9 and that of the verbal score was 78.6±11.1. The results obtained from schoolchildren were 85.1±13.2 for the total score, 85.3±13.8 for the performance score, and 87.7±13.9 for the verbal score. There was a significant difference between the means (Table 4).
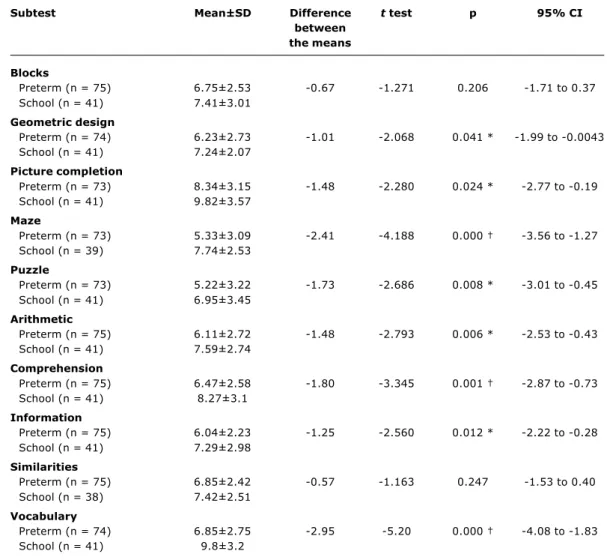
By comparing the mean results of the subtests of both groups, the major differences were related to subtests Mazes and Vocabulary, followed by Comprehension, Arithmetic, Puzzle, Information, Picture Completion and Geometric Design. Subtests Block Design and Similarities did not show any significant differences (Table 5).
Discussion
In this population, the mean intelligence quotient (total score of the WPPSI-R test) was below normal due to the high incidence of children with involvement of specific cognitive areas. These results are worse than those reported in the literature, which show lower mean IQ values in the group of very-low-birthweight preterm infants, but within normal limits.2,12-15 In our group, the mean results ranged from 65
to 89 points in the different scores proposed by the test (total, verbal and performance). This means that these childrens intellectual functioning was close to being deficient, at the time of evaluation. Bhutta et al., in a meta-analysis, reported a difference of 10.2 points in the mean score, between the control and preterm groups, which is significantly correlated to gestational age and birthweight.2 In our study,
very-low-birthweight preterm infants had lower scores, which are consistent with the literature.
Specific cognitive disorders have been described in very-low-birthweight infants, such as those that affect visual motor coordination and memory,16 spatial and visual
perceptual skill,17 visual motor and perceptual motor
Table 4 - Mean total scores, performance and verbal scores of studied and control children and the difference between the means with the results of the t test for the difference between the means
Scores Mean±SD Difference t test p 95% CI
between the means
Total
Preterm (n = 75) 75.61±11.91 -9.48 -3.938 0.000 -14.26 to -4.71 School (n = 41) 85.10±13.25
Performance
Preterm (n = 75) 77.04±12.88 -8.25 -3.213 0.002 -13.34 to -3.17 School (n = 41) 85.29±13.83
Verbal
Preterm (n = 75) 78.59±11.10 -9.17 -3.882 0.000 -13.85 to -4.49 School (n = 41) 87.76±13.92
coordination18 and visual motor and visual perceptual
coordination.19 In the study group, the mean performance
score was slightly lower than the verbal score. As for the subtests, only the mean obtained by the study group in subtest Picture Completion was as expected for this age group, albeit significantly different from that of schoolchildren. In the other subtests, the results were at least two points below expected. The compromised areas corresponded to the following functions: planning, visual motor functioning, conceptual formation, verbal and numeric skills, rational and associative thinking, capacity to summarize, perceptual organization, spatial orientation, remote memory. These results are in accordance with those reported in recent studies on preterm infants, where involvement of visual motor coordination, memory, arithmetic, associative processes, graphic and language capacity (both comprehensive and expressive) has been observed.21,22
The tests assess the aspects related to systematic learning influenced by family and social environments. In the study population, approximately one third of the children were not attending school, without receiving proper systematic and pedagogical stimuli, which might contribute to unfavorable results in comparison to those described in the literature.2,4,13-15 The fact that the children were
attending different grades in school, due to their ages, does not affect the test results, since the test is age-matched. The individual observation of the best results showed children with access to different schools, who belong to a socially and culturally privileged group in the population seen in our service. On the other hand, those children whose family had a low income belonged to the low birthweight group.
Items of the performance score: Blocks, Geometric design, Picture completion, Maze and Puzzle. Items of the verbal score: Arithmetic, Comprehension, Information, Similarities, and Vocabulary.
* p < 0.05 † p < 0.005
Table 5 - Means of the results of each subtest of preterm and school children and the differences between the means with the results of t test for the differences of the means
Subtest Mean±SD Difference t test p 95% CI
between the means
Blocks
Preterm (n = 75) 6.75±2.53 -0.67 -1.271 0.206 -1.71 to 0.37 School (n = 41) 7.41±3.01
Geometric design
Preterm (n = 74) 6.23±2.73 -1.01 -2.068 0.041 * -1.99 to -0.0043 School (n = 41) 7.24±2.07
Picture completion
Preterm (n = 73) 8.34±3.15 -1.48 -2.280 0.024 * -2.77 to -0.19 School (n = 41) 9.82±3.57
Maze
Preterm (n = 73) 5.33±3.09 -2.41 -4.188 0.000 -3.56 to -1.27 School (n = 39) 7.74±2.53
Puzzle
Preterm (n = 73) 5.22±3.22 -1.73 -2.686 0.008 * -3.01 to -0.45 School (n = 41) 6.95±3.45
Arithmetic
Preterm (n = 75) 6.11±2.72 -1.48 -2.793 0.006 * -2.53 to -0.43 School (n = 41) 7.59±2.74
Comprehension
Preterm (n = 75) 6.47±2.58 -1.80 -3.345 0.001 -2.87 to -0.73 School (n = 41) 8.27±3.1
Information
Preterm (n = 75) 6.04±2.23 -1.25 -2.560 0.012 * -2.22 to -0.28 School (n = 41) 7.29±2.98
Similarities
Preterm (n = 75) 6.85±2.42 -0.57 -1.163 0.247 -1.53 to 0.40 School (n = 38) 7.42±2.51
Vocabulary
Preterm (n = 74) 6.85±2.75 -2.95 -5.20 0.000 -4.08 to -1.83 School (n = 41) 9.8±3.2
information that demand logical thinking and spatial orientation skills.21 Abnormalities persisted even when
social class differences were controlled, with preterm infants showing the worst results in all classes. Ment et al. found an increase in cognitive scores between the ages of 36 and 96 months for the assessed preterm infants, except for those who had cerebral hemorrhage in the neonatal period and severe CNS injury, whose scores decreased.23 The factors
associated with the best results at 96 months of life were maternal level of education and the fact that the children belonged to well-structured families, with father and mother living in the same household. The study conducted by Ment et al. highlights the importance of continuing cognitive
stimulation in children who are discharged from NICUs, especially preterm infants. Our results suggest that, although the sample is reasonably homogenous from a clinical viewpoint, individual results varied, probably due to the clinical histories of each child, his/her capacities to respond to injuries and also the environmental and familys capacity to facilitate his/her development, which is in agreement with Ment et al.
Gregory24 recalls that there are biological tools as far
history, which may favor or hinder the proper utilization of these resources, and consequently, favor or hinder a healthier cognitive development. Preterm infants have skills that are characteristic of their developmental stage, but their exposure to neonatal intensive care and to early interaction, requires the participation of yet absent competencies, overloading their overall developmental process. Thus, health professionals in charge of caring for these infants after their hospital discharge should be attentive to detect problems and intervene whenever necessary, and the assessment of intellectual functioning is an important component of this follow-up.
According to Silbertin et al.,7 the problems often arise
at the entry to nursery school, and worsen during graphic tasks and while learning to read and to make calculations, which may produce coercive attitudes towards learning by the family, which in some cases may become permanent. In other words, these disorders, when not properly detected, may cause poor school achievement even in those children with a good intellectual performance. Understanding this is important so that these children and their families can receive adequate support.
Sample size was one of the limitations of our study. However, the major problem was the high loss rate. No statistically significant differences were noted between the two groups. Losses therefore occurred at random, not contributing to the selection bias, despite the high percentage observed. It should be underscored that children with severe disorders were not tested and were excluded from the study, not interfering with the mean scores. Moreover, in order to minimize the possibility of classification bias, interrater reliability was analyzed, showing excellent concordance between the psychologists. As for the comparison group, children in the same age group were evaluated, despite the difference in gender distribution within the group. These children attended a school in the slums, but their families had a socioeconomic level that was similar to that of children in the study group. Since no entrance exams were required by this school, it was not possible to have a systematic biased selection of children with better intellectual potential.
Studies with cohort of preterm infants show some peculiarities in this population. However, these peculiarities should be carefully analyzed in order to avoid labeling these patients; thus preterm birth should not be understood as the only risk for these babies, at the cognitive and relational level. Several factors contribute to the future performance of these children, which requires the observation of their skills through a dynamic approach, where different situations may interfere in specific stages of their development, compromising future learning.
References
1. Bennet FC, Scott DT. Long-term perspective on premature infant outcome and contemporary intervention issues. Semin Perinatol. 1997;21:190-201.
2. Bhutta AT, Cleves MA, Casey PH, Cradock MM, Anand KJS. Cognitive and behavioral outcomes of school-aged children who were born preterm. JAMA. 2002;288:728-37.
3. Hille ETM, Ouden ALD, Bauer L, van Den Oudenrijn C, Brand R, Verloove-Vanhorick SP. School performance at nine years of age in very premature and very low birth weight infants: perinatal risk factors and predictors at five years of age. J Pediatr. 1994;125:426-34.
4. Horwood LJ, Mogridge N, Darlow BA. Cognitive, educational and behavioural outcomes at 7 to 8 years in a national very low birthweight cohort. Arch Dis Child Fetal Neonatal Ed. 1998;79:F12-F20.
5. Resnick MB, Gomatam SV, Carter RL, Ariet M, Roth J, Kilgore KL, et al. Educational disabilities of neonatal intensive care graduates. Pediatrics. 1998;102:308-14.
6. Saigal S, Hoult LA, Streiner DL, Stoskopf BL, Rosenbaum PL. School difficulties at adolescence in a regional cohort of children who were extremely low birth weight. Pediatrics. 2000;105: 325-31.
7. Silbertin-Blanc M, Hascoet JM, Tchenio D. Regards croisés et divergents des professionnels sur les bébés nés trés grand prématurés. Neuropsychiatrie de lenfance et de ladolescence. 2001;49:449-60.
8. Méio MDBB, Lopes CS, Morsch DS. Fatores prognósticos para o desenvolvimento cognitivo de prematuros de muito baixo peso. Rev Saude Publ. 2003;37:311-8.
9. Battaglia FC, Lubchenco LO. A practical classification of newborn infants by weight and gestational age. J Pediatr. 1967;71:159-63. 10. Weschler D. WPPSI-R-Wechsler Preschool and Primary Scale of Intelligence - Revised. San Antonio: The Psychological Corporation; 1989.
11. Méio MDBB, Lopes CS, Sichieri R, Morsch DS. Confiabilidade do Teste WPPSI-R na avaliação do desenvolvimento cognitivo de pré-escolares. Cad Saude Publ. 2001;17:99-105.
12. Stjernqvist K, Svenningsen NW. Extremely low-birth-weight infants less than 901g: development and behaviour after 4 years of life. Acta Paediatr. 1995;84:500-6.
13. Hutton JL, Pharoah POD, Cooke RWI, Stevenson RC. Differential effects of preterm birth and small gestational age on cognitive and motor development. Arch Dis Child. 1997;76:F75-F81. 14. Anderson P, Doyle LW, The Victorian Infant Collaborative Study
Group. Neurobehavioral outcomes of school-age children born extremely low birth weight or very preterm in the 1990s. JAMA. 2003;289:3264-72.
15. Hack M, Wright LL, Shankaran S, Tyson JE, Horbar JD, Bauer CR, et al. Very-low-birth-weight outcomes of the National Institute of Child Health and Human Development Neonatal Network, November 1989 to October 1990. Am J Obstet Gynecol. 1995;172:457-64.
16. Damman O, Walther H, Allers B, Schroder M, Drescher J, Lutz D, et al. Development of a regional cohort of very-low-birthweight children at six years: Cognitive abilities are associated with neurological disability and social background. Dev Med Child Neurol. 1996;38:97-108.
17. Olsen P, Vainionpää L, Pääkkö E, Korkman M, Pyhtinen J, Järvelin M. Psychological findings in preterm children related to neurological status and magnetic resonance imaging. Pediatrics. 1998;102:329-36.
18. Lie KG. Sensitivity of perceptuomotor measures for very low birthweight (VLBW <= 1500g) pre-schoolers. Child Care Health Development. 1994;20:239-49.
19. Goyen T, Lui K, Woods R. Visual-motor, visual-perceptual, and fine motor outcome in very-low-birthweight children at 5 years. Dev Med Child Neurol. 1998;40:76-81.
20. Wolke D, Meyer R. Cognitive status, language attainment, and prereading skills of 6-year-old very preterm children and their peers: the Bavarian Longitudinal Study. Dev Med Child Neurol. 1999;41:94-109.
Corresponding author: Maria D. B. B. Méio
Rua Jornalista Carlos Rezzini, 95, Jacarepaguá CEP 22750-470 Rio de Janeiro, RJ
Brazil
Phone: +55 (21) 2447.1688 Fax: +55 (21) 3392.8766 E-mail: [email protected]
22. Ment LR, Vohr B, Allan W, Katz KH, Schneider KG, Westerveld M, et al. Change in cognitive function over time in very low-birth-eight infants. JAMA. 2003;289:705-11.