461
AbstractObjective: To verify the behavior of the mineral bone content and density in male adolescents according to age and secondary sexual characters.
Methods: 47 healthy adolescents between 10 and 19 years old were assessed according to weight, height, body mass index, puberty stage, calcium intake, bone mineral density and content in the lumbar spine and in the proximal femur. The bone mass was measured through bone densitometries. The intake of calcium was calculated through a 3-day diet. The BMI (body mass index) was calculated with the Quetelet Index and the puberty stage was defined according to Tanners criteria. The analysis used descriptive statistics such as average and standard deviation, and variance estimates to compare the different age groups. Moreover, the Tukey test was used to determine the significant differences.
Results: It was evident that the calcium intake in the different ages assessed has not reached the minimum value of 800 mg. The bone mineral density and content showed an increase after the age of 14, as well as when the teenagers reached the sexual maturation stage G4. The mineralization parameters showed a high level when the teenagers were in the G3 stage, however, without statistical significance.
Conclusion: The results indicate an important level of bone mineralization during adolescence. Maturation levels superior to G3 have shown more mineralization. This study proves that the critical years for bone mass gain start after the 14-15 years old or older.
J Pediatr (Rio J). 2004;80(6):461-7: Adolescence, puberty stage, secondary sex characters, bone mass, bone mineral density.
Bone mineralization among male adolescents:
critical years for bone mass gain
Carla C. Silva,1 Tamara B. L. Goldberg,2 Altamir S. Teixeira,3 José C. Dalmas4 Copyright © 2004 by Sociedade Brasileira de Pediatria
O
RIGINALA
RTICLE1. Graduate student, Graduate Program in Pediatrics, School of Medicine of Botucatu, Universidade Estadual Paulista (UNESP), São Paulo, SP, Brazil.
2. Ph.D. Assistant professor, Department of Pediatrics, School of Medicine of Botucatu, UNESP, São Paulo, SP, Brazil.
3. Assistant professor, Department of Tropical Diseases and Imaging Diagnosis, School of Medicine of Botucatu, UNESP, São Paulo, SP, Brazil.
4. Associate professor, Department of Applied Mathematics, Universidade Estadual de Londrina (UEL), Londrina, PR, Brazil.
Manuscript received Jan 08 2004, accepted for publication Aug 25 2004.
Suggested citation: Silva CC, Goldberg TB, Teixeira AS, Dalmas JC. Bone mineralization among male adolescents: critical years for bone mass gain. J Pediatr (Rio J). 2004;80:461-7.
Introduction
Bone mineralization begins in the womb, continues throughout childhood and reaches maximum velocity during adolescence. These years are the most crucial period for bone mass acquisition. A number of different researchers have stated that the end of childhood and adolescence are the periods during which the greatest increment in bone mineral capital occurs, for both sexes.1-5
Studies relating adolescence and with bone health have been gaining important recognition in international research. This fact is founded on the cyclic principle which relates bone mass deposition to the whole course of life. Childhood and adolescence are marked by a highly i m p o r t a n t b o n e f o r m a t i o n r a t e , w i t h f o r m a t i o n predominating over reabsorption; during adulthood the two processes stabilize and from around 45-50 years of age, particularly among females, there is a predominance of bone reabsorption.
Bone reabsorption is not a process that is exclusive to females, since findings of osteopenia and osteoporosis among males have been increasing significantly.6
At more advanced ages large magnitude bone loss may indicate that osteopenic and osteoporotic processes have set it. Osteoporosis is a heterogeneous disorder, considered a serious public health problem, which could be represented, in part, by inadequate bone acquisition during childhood and adolescence.8 Factors related to nutrition, such as calcium intake and physical exercise, particularly those involving greater impacts, have demonstrated positive effects on bone tissue, irrespective of age.9
The development over recent years of highly accurate methods for measuring bone mass have permitted better understanding of the dynamics of bone tissue. Double-emission x-ray bone densitometry offers extremely precise analysis with low radiation exposure levels and is appropriate for assessing children and adolescents.10-12
In Brazil few investigators have dedicated themselves to the study of bone mineralization in healthy children and adolescents.13-16 This being so the purpose of the present study was to determine the behavior of bone mineral content and of bone mineral density among male adolescents with respect of age group and level of maturity of secondary sexual characteristics.
Patients and methods
Volunteer, healthy adolescents aged 10 to 19 took part in this study. They were all students at the Associação Brasileira de Educadores Lassalistas, Colégio La Salle. The school is part of the private educational system and is located in the town of Botucatu - São Paulo State. The research project was approved by the Botucatu Medical Faculty Commission for Ethics in Research (at UNESP) and the adolescents and their guardians were made aware of the studys content by means of explanations delivered within the school environment. Before participating in the study, a free and informed consent form was supplied to and signed by both the guardian and adolescent.
The inclusion criteria demanded that the adolescents weights were between the 10th and 90th percentiles and that their statures were between percentiles 10 and 97.5 for each age group,17 and that body mass index (BMI) be adequate for age18 and that they consumed dairy products daily. Adolescents could not be smokers or using alcohol, could not be enrolled on any extracurricular sporting activities, taking part only in Physical Education activities at the school. No control was made of habitual physical activity since investigations indicate that programmed sporting activities demonstrate the greatest increases in bone mass.1,2,7,9
Exclusion criteria were defined to rule out: adolescents with a history of prematurity or low birth weight, those who had undergone prolonged corticoid therapy or those who were on calcium and/or iron supplements during the twelve months prior to the study. Also excluded were adolescents presenting any of the following conditions: diabetes mellitus, acute or chronic malnutrition, congenital or acquired bone diseases, gastrointestinal diseases associated with malabsorption, a history of nephropathy,
with or without chronic renal failure, endocrinopathies, premature or late puberty, chronic drug consumption, cystic fibrosis, celiac disease and the use of drugs that negatively affect bone metabolism such as anticonvulsants, antacids containing aluminum. Dietary exclusion criteria were exclusively vegetarian diets, high consumption of fiber, caffeine or soft drinks and failure to consume dairy products daily.
The data collection sequence began within the school environment where, at an initial point, adolescents who did not present any dysfunction and/or compromise as cited in the exclusion criteria were chosen at random and measured and weighed. When the weights and measurements were within the proposed limits the adolescents were asked about smoking habits and the consumption of alcoholic beverages. If the answers to these questions were satisfactory the adolescents were invited to participate in the study and, in the case of those that did volunteer, contact was made with guardians to inform them of the methods involved and their consent was obtained. Both the adolescents and their guardians were at liberty to withdraw consent at any point in the study without prejudice.
Of the 497 schoolchildren registered, 47 adolescents met the inclusion criteria and, having volunteered, took part in all assessments. As a result of the stringency of the inclusion criteria each age group contained five adolescents, with the exception of the 19-year-old group, which contained two adolescents.
Those adolescents who both met the eligibility criteria and volunteered were then invited, together with their guardians, to attend the Adolescents Clinic at the UNESP Botucatu Medical Facultys Hospital das Clínicas, where they were interviewed together with their guardians, followed by a general and specific physical examination in order to detect any physical abnormality. Secondary sexual characteristics were assessed and the results matched to the Tanner criteria.19 In order to verify the impact of puberty stage on bone mineralization, the level of maturity, gauged by visual inspection of genitals, was compared with the results for bone mineral content (BMC) and bone mineral density (BMD) obtained by double-emission x-ray bone densitometry (DXA).
The adolescents diets were characterized next using a three-day dietary recall with the aim of obtaining information on consumption, preferences, foods refused, the main meals involving calcium and any other factors that could possibly interfere in the bioavailability of this mineral.20 Proximal composition of the dietary information was calculated using a computerized nutritional analysis system developed by the Nutrition Department at the Public Health Faculty of the Universidade de São Paulo.21
Data was stored and analyzed on the computer program Statistica, version V. Age groups (AG) from 10 to 19 years were defined as follows: 10 complete years to 11 years, 11 months and 29 days (AG 1); 12 years to 13 years, 11 months and 29 days (AG 2); 14 years to 15 years, 11 months and 29 days (AG 3); 16 years to 17 years, 11 months and 29 days (AG 4) and dos 18 years to 19 years, 11 months and 29 days (AG 5). Descriptive statistics were used to characterize the adolescents (mean and standard deviation) in terms of measurements of weight, stature, BMI and three-day mean calcium intake. Next, an analysis of variance was performed to compare all AGs and maturity levels with respect of BMC and BMD and, additionally, a Tukey test was performed to identify significant differences. The level of significance was set at 5%.
Results
The objective of this study was to determine and understand the bone mineralization of male Brazilian adolescents. To this end the general characteristics of the sample of adolescents studied, with respect of body weight, stature and BMI are given first (Table 1). Observe that mean values for each of these indicators, for each of the age groups defined for the study, exhibit values similar to those published by the National Center for Health Statistics (NCHS), since each individual included had to be within the limits defined in Methods.17,18 Body weight, stature and BMI all increase with age, exhibiting significant differences from 14 to 15 years of age (AG 3) for these parameters (Table 1).
Table 1 - General characteristics of the sample of adolescents studied with respect of body weight (kg), stature (m) and BMI (kg/m2) and total calcium intake (mg/day)
ANOVA analysis of variance and Tukey’s test to find the differences between the age groups. Symbols show the differences between the age groups (p < 0.05).
* Difference between AG 3 and the other groups. † Difference between AG 2 and the other groups. ‡ Difference between AG 1 and the other groups.
BMI = body mass index; SD = standard deviation.
Age group Weight (kg) Stature (m) BMI (kg/m2) Calcium (mg/day)
Age (years) X±SD X±SD X±SD X±SD
(AG 1) 10-11 (n = 10) 36.25±4.54 * 1.425±0.06 17.78±1.31 783±236
(AG 2) 12-13 (n = 10) 43.17±9.08 * 1.540±0.08 17.99±1.83 740±198
(AG 3) 14-15 (n = 10) 57.55±8.86 1.694±0.07 19.97±2.06 887±228
(AG 4) 16-17 (n = 10) 64.06±7.51 1.729±0.07 21.39±1.79 894±275
(AG 5) 18-19 (n = 7) 70.34±3.20 * 1.803±0.05 21.65±1.16 1,073±434
Total (n = 47) 53.24±14.37 1.628±0.15 19.64±2.98 863±280
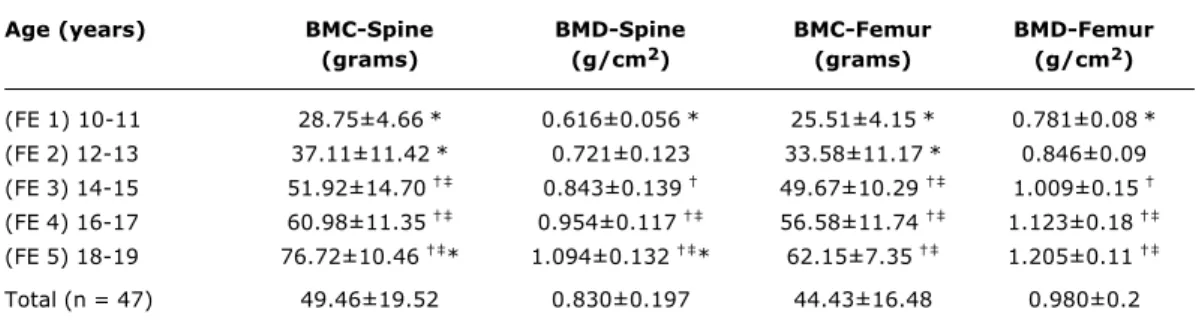
Based on an analysis of the dietary recall, calcium intake was found to vary from 740±198 mg/day to 1,073±434 mg/day, with an average of 863±280 mg/day. Table 2 contains values for bone mineral content and bone mineral density for the lumbar spine and proximal femur listed according to the adolescents ages. Statistical analysis indicated significant differences from 14 to 15 years (F3) for lumbar spine bone mineral content with: (F3
≠
F1 p = 0.0003; F3≠
F2 p = 0.0352 and F3≠
F5 p = 0.0013) and at the proximal femur (F3≠
F1 p = 0.00014 and F3≠
F2 p = 0.0043). For the bone mineral density of the lumbar spine, we have (F3≠
F1 p = 0.0009 and F3≠
F5 p = 0.0021) and in the proximal femur region (F3≠
F1 p = 0.00014 and F3≠
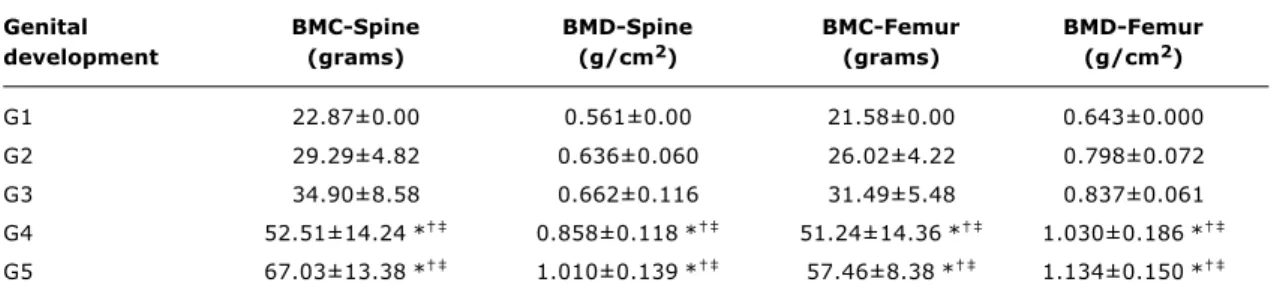
F2 p = 0.0043).Bone mineralization parameters were compared with degree of sexual maturity, specifically genital development, in an attempt to identify those puberty stages that indicated the greatest increment in bone mass. The results indicated significant differences at G4 and G5 both for bone mineral content (BMC at spine: G4
≠
G1, G2, G3 or G5 p < 0.004 and G5≠
G1, G2 or G4 p < 0.0006; BMC at femur: G4≠
G1, G2 or G3 p < 0.004; G5≠
G1, G2 or G3 p < 0.0006) and for bone mineral density (BMD at spine: G4≠
G1, G2, G3 or G5 p < 0.018; G5≠
G1, G2, G3 or G4 p < 0.0012; BMD at femur: G4≠
G1, G2 or G3 p < 0.0107; G5≠
G1, G2 or G3 p < 0.001). These findings indicate that between G1 and G3 mineralization parameters do not change to a significant extent.Table 2 - Mean and standard deviations of bone mineral content and bone mineral density in the lumbar spine (L1-L4) and proximal femur regarding the age groups
ANOVA analysis of variance and Tukey’s test to find the differences between the age groups. Symbols show the differences between the age groups (p < 0.05).
* Difference between AG 3 and the other groups. † Difference between AG 1 and the other groups. ‡ Difference between AG 2 and the other groups.
BMC = bone mineral content; BMD = bone mineral density.
Age (years) BMC-Spine BMD-Spine BMC-Femur BMD-Femur
(grams) (g/cm2) (grams) (g/cm2)
(FE 1) 10-11 28.75±4.66* 0.616±0.056* 25.51±4.15* 0.781±0.08* (FE 2) 12-13 37.11±11.42* 0.721±0.123 33.58±11.17* 0.846±0.09 (FE 3) 14-15 51.92±14.70 0.843±0.139 49.67±10.29 1.009±0.15 (FE 4) 16-17 60.98±11.35 0.954±0.117 56.58±11.74 1.123±0.18 (FE 5) 18-19 76.72±10.46 * 1.094±0.132 * 62.15±7.35 1.205±0.11
Total (n = 47) 49.46±19.52 0.830±0.197 44.43±16.48 0.980±0.2
differences between 14 and 15 years for bone mineral content at the proximal femur and lumbar spine respectively. It can also be observed that bone mineral content is greater at the spine than at the proximal femur for all age groups.
In Figure 2 it can be observed that, relating bone mineral density to age produces similar results to those for bone mineral content. Bone mineral density demonstrates significant differences from 14 to 15 years at both the lumbar spine and the proximal femur, although values for bone mineral density at the femur are greater than at the spine.
The behavior of bone mineralization was similar and grew with the advance of sexual maturity (Figures 3 and 4), indicating significant differences at G4 and G5, for both bone mineral content and bone mineral density, and at both locations measured.
Overall, as can be observed in the figures indicated, from G3 onwards, a pronounced increase is detected in both bone mineral content and bone mineral density.
Discussion
A number of different factors are listed as being important for maximum growth of bone mineral density during puberty. Among these factors, those that stand out are contributions of a genetic nature, alterations to the bodys dimensions, weight and stature, the hormonal profile leading to skeletal and sexual maturity, the practice of physical activity by the adolescents and sufficient calcium ingestion during this age r a n g e a n d t h a t a r e r e f l e c t e d i n i n t e n s e b o n e mineralization.6,8,22-24
With respect of total dietary calcium, it was found that the adolescents daily intakes did not reach the minimum recommended levels for any of the age groups. The figure varied from 740 mg/day to 1,073 mg/day, whereas the quantity considered ideal for both male and female adolescents, according to the Dietary Reference Intakes (DRI) is 1,300 mg/day.25 The literature suggests that the maximum intake level should not pass 2,500 mg/day, which value was not exceeded by any of the adolescents in our sample. Notwithstanding, the values verified in our study were greater than those found in other Brazilian studies of the same age group.26-28 Cross-sectional studies performed with children and adolescents have indicated that beneficial effects on peak bone mass result from adequate calcium intake.8 It appears to be evident that reduced intake of this mineral during the growing phase of children and adolescents results in reduced bone mineralization when compared with individuals from the same age group whose calcium intake is adequate.29 Proof of the beneficial impact that calcium intake has on the bone mineralization of children and adolescents was described in a longitudinal study undertaken by Lee et al.30 These researcher offered 800 mg/day of calcium carbonate supplementation for 18 months to children of both sexes with a mean age of 8.5 years. The results demonstrated a significant increase in the BMC at the lumbar spine of the children on supplements when compared with a control group.
Figure 3 - Variation in bone mineral content according to sexual maturity levels
* ≠ BMC - Lumbar spine at G1, G2 and G3. § ≠ BMC - Femur at G1, G2 and G3. 80
70
60
50
40
30
20
10
G1 G2 G3
Sexual maturation (genitals)
G4 G5
§
§
g
ra
m
s
BMC - Femur BMC - Lumbar spine
Figure 4 - Variation in bone mineral density according to sexual maturity levels
* ≠ BMC - Lumbar spine at G1, G2 and G3. § ≠ BMC - Femur at G1, G2 and G3. 1.3
1.1 1.2
1.0
0.9
0.8
0.7
0.6
0.5
g
/c
m
2
§
§
G1 G2 G3
Sexual maturation (genitals)
G4 G5
BMD - Femur BMD - Lumbar spine
Figure 2 - Variation in bone mineral density according to age group
* > significant in BMD - Lumbar spine (p < 0.05). § > significant in BMD - Femur (p < 0.05). 1.3
1.1 1.2
1.0
0.9
0.8
0.7
0.6
0.5
g
/c
m
2
§
10-11 12-13 14-15
Age (years)
16-17 18-19
BMD - Femur BMD - Lumbar spine
Figure 1 - Variation in bone mineral content according to age group
* > significant in BMC - Lumbar spine (p < 0.05). § > significant in BMC - Femur (p < 0.05). 90
80
70
60
50
40
30
20
10-11 12-13 14-15
Age (years)
16-17 18-19
BMC - Femur BMC - Lumbar spine
§
g
ra
m
s
of pediatric populations tend to be perpetuated during adulthood and minimize the risk of fractures in later life.2,8,9
With respect of sexual dimorphism, it has revealed that boys have healthier habits than girls in terms of both calcium intake and level of physical activity during childhood and adolescence.8,32
Table 3 - Means and standard deviation of bone mineral content and bone mineral density in the lumbar spine and proximal femur according to the sexual maturity levels
ANOVA analysis of variance and Tukey’s test to find the differences between the age groups. Symbols show the differences between the age groups (p < 0.05).
* Difference between G1 and the other sexual maturity levels. † Difference between G2 and the other sexual maturity levels. ‡ Difference between G3 and the other sexual maturity levels.
BMC = bone mineral content; BMD = bone mineral density.
Genital BMC-Spine BMD-Spine BMC-Femur BMD-Femur
development (grams) (g/cm2) (grams) (g/cm2)
G1 22.87±0.00 0.561±0.00 21.58±0.00 0.643±0.000
G2 29.29±4.82 0.636±0.060 26.02±4.22 0.798±0.072
G3 34.90±8.58 0.662±0.116 31.49±5.48 0.837±0.061
G4 52.51±14.24* 0.858±0.118* 51.24±14.36* 1.030±0.186*
G5 67.03±13.38* 1.010±0.139* 57.46±8.38* 1.134±0.150* The results of the present study indicate significant
differences from the 14 to 15 year age group onwards both in terms of bone mineral content and bone mineral density, at both the lumbar spine and the proximal femur. Rubin et al.,8 assessed the bone mineral density of 299 children and adolescents of both sexes in the 6 to 8 years age group. The results indicated an important acceleration in bone mineral density, at the lumbar spine, from 13 years for males with stabilization occurring around 15 to 16 years, denotes a similarity with the present study. In an investigation of 207 Caucasian children and adolescents of both sexes aged between 9 and 17 years, pronounced differences were observed for the male sex, both at the lumbar spine and at the proximal femur between 13 and 17 years.22 For Theintz et al.,23 the period between 13 and 17 years was fundamental to increasing bone mineral density at the lumbar spine and the proximal femur.
Everything indicates that the age band from 14 to 16 years is a critical period for the bone mineralization process. These data are in agreement with a number of other investigations in which linear increases were observed in bone mass during childhood with an exponential increase during puberty at all of the several points at which bones were studied.8,13,14,31,34
While age is an extremely important temporal indicator with respect of the alterations that occur during the period of adolescence, it is limited with relation to the constant modifications that occur during puberty as a function of the different levels of maturity that can be observed at the same age.
The results presented in Tables 2 and 3 reveal that from 14 to 15 years of age and between maturity levels G4 and G5, male adolescents experience a significant increase in bone mass, which reflects gains in bone mineral content and bone mineral density at the locations under investigation, i.e. the lumbar spine and proximal
femur. This age group and maturity profile indicate significantly critical phases in the acquisition of bone mass, which is reflected in a high rate of mineralization.
The current study found evidence of increased bone mineralization during the years of puberty, concomitant with the significant increase in body dimensions and its relationship with maturation of secondary sexual characteristics.
With respect of the population studied, it is important to point out that these adolescents are part of a specific social strata, with adequate weight and stature and higher calcium intake than a number of other studies published in Brazil. 26-28 Thus, the results presented are indicative of the variation
in BMC and BMD of a sample of healthy adolescents. To date, the study is the only reference that has employed the inclusion and exclusion criteria described here. Nevertheless, other researchers should be cautious when comparing their data with the findings of the current study, since they originate from a regional investigation.
Obviously the apparent peak bone mass observed, the result of intense bone anabolism in the 14 to 15 year age groups of this study, should be confirmed by means of longitudinal studies of male Brazilian adolescents. Nevertheless, we believe that the publication of these results is of fundamental importance since, when compared with international published data they indicate great similarity and are highly representative.
References
1. Pettersson U, Nordströnm P, Alfredson H, Henriksson-Larsén K, Lorentzon R. Effect of high impact activity on bone mass and size in adolescent female: a comparative study between two different types of sports. Calcif Tissue Int. 2000;67:207-14.
2. Lima F, Falco V, Baima J, Carazzato JG, Pereira RMR. Effect of impact load and active load on bone metabolism and body composition of adolescent athletes. Med Sci Sports Exerc. 2001;33:1318-23.
3. Jones G, Riley MD, Whiting S. Association between urinary potassium, urinary sodium, current diet, and bone density in prepuberal children. Am J Clin Nutr. 2001;73:839-44. 4. Outila TA, Kärkkäinen MUM, Lmberg-Allardt CJE. Vitamin D
status affects serum parathyroid hormone concentrations during winter in female adolescents: associations with forearm bone mineral density. Am J Clin Nutr. 2001;74:206-10.
5. Crawford PB, Wang MC, Sabry ZI, Hudes M, van Loan M, Bachach LK. Adolescent diet is predictive of peak bone mass. Am J Clin Nutr. 2002;75:S356.
6. Lorentzon M, Lorentzon R, Bäckström T, Nordstöm P. Estrogen receptor gene polymorphism, but not estradiol levels, is related to bone density in health adolescents boys: a cross-sectional and longitudinal study. J Clin Endocrinol Metab. 1999;84: 4597-601.
7. Nordström PK, Thorsen K, Nodström G, Bergström E, Lorentzon R. Bone mass, muscle strength, and different body constitutional parameters in adolescent boys with a low or moderate exercise level. Bone. 1995;17:351-6.
8. Rubin K, Schirduan V, Gendreau P, Sarfarazi M, Mendola R, Daisky G. Predictors of axial and peripheral bone mineral density in health children and adolescents, with special attention to the role of puberty. J Pediatr. 1993;123:863-70.
9. Mackelvie KJ, Khan KM, Mckay HA. Is there a critical period for bone response to weight-bearing exercise in children and adolescents? A systematic review. Br J Sports Med. 2002;36: 250-7.
10. Bonjour JP. Peak bone mass, calcium, and protein intakes. Feed Toddlers Adolesc. 1996;37:31-43.
11. Boot AM, Bouquet J, Ridder MAJ, Krenning EP, Keizer-Schrama SMPFM. Determinants of body composition measures by dual-energy x-ray absorptiometry in Dutch children and adolescents. Am J Clin Nutr. 1997;66:232-8.
12. Plapler PG. Osteoporose e exercícios. Rev Hosp Clin Fac Med Univ São Paulo. 1997;52:163-70.
13. Fonseca ASM. Densidade mineral óssea da coluna lombar com densitometria de dupla emissão com fontes de raio-x (DEXA) em crianças de 6 a 14 anos de idade [dissertação]. São Paulo: Universidade Federal de São Paulo; 1992.
14. Brandão CMA. Avaliação da densidade mineral óssea durante a puberdade, em crianças normais de São Paulo. Influência de fatores antropométricos, composição corporal e do SDHEA na massa óssea [tese]. São Paulo: Universidade Federal de São Paulo; 1999.
15. Silva CC, Teixeira AS, Goldberg TBL. Densidade e conteúdo mineral ósseo de adolescentes na faixa etária de 10 a 20 anos. Processo CNPq nº130043/2003. Botucatu: Departamento de Pediatria; 2001.
16. Silva CC, Teixeira AS, Goldberg TBL. Impacto da ingestão de cálcio sobre a mineralização óssea em adolescentes. Rev Nutr PUCCAMP. 2004;17(3).
17. Hamill PVV, Drizd TA, Johnson CL, Reed RB, Roche AF, Moore WM. Physical growth: National Center for Health Statistics Percentiles. Am J Clin Nutr. 1979;32:607-29.
18. Prevalence of overweight among adolescents - United States, 1988-91. MMWR Morb Wkly Rep. 1994;43:818-21.
19. Marshall WA, Tanner JM. Variation in the pattern of pubertal changes in boy. Arch Dis Child. 1970;45:13.
20. Cintra IP, von der Heydy MED, Schitz BAS, Francheschini SCC, Taddei JAAC, Sigulen DM. Métodos de inquéritos dietéticos. Cad Nutr. 1997;13:11-23.
21. Philiphi ST, Szarfarc SC, Lattrza AR. Virtual Nutri. Versão 1.0 for Windows. Departamento de Nutrição: Faculdade de Saúde Pública Universidade de São Paulo; 1996.
22. Bonjour JP, Theintz G, Buchs B, Sloman D, Rizzoli R. Critical years and stages of puberty for spinal and femoral bone mass accumulation during adolescence. J Clin Endocrinol Metab. 1991;73:555-63.
23. Theintz G, Buchs B, Rizzoli R, Sloman D, Clavien H, Sizonenko PC, et al. Longitudinal monitoring of bone mass accumulation in health adolescents: evidence for marked reduction after 16 years of age at the levels of lumbar spine and femoral neck in female subjects. J Clin Endocrinol Metab. 1992;75:1060-5. 24. Blanchet C, Giguère Y, Prudhomme D, Dumont M, Rousseau F,
Dodin S. Association of physical activity and bone: influence of vitamin D receptor genotype. Med Sci Sport Exerc. 2002;34: 24-31.
25. Institute of Medicine (US). Dietary references intakes for calcium, phosphorus, magnesium, vitamin D and fluoride. Washington (DC): National Academy Press; 1998.
26. Albuquerque MFM, Monteiro AM. Ingestão de alimentos e adequação de nutrientes no final da infância. Rev Nutr PUCCAMP. 2002;15:291-9.
27. Garcia GCB, Gambardella AMD, Frutuoso MFP. Estado nutricional e consumo alimentar de adolescentes de um centro de juventude da cidade de São Paulo. Rev Nutr PUCCAMP. 2003;16:41-50. 28. Vargas DM, Rigotti T, Gütz CNRM, Lobe MCS, Fernandes JA.
Mineralização óssea em crianças e adolescentes com diabetes melito tipo 1. J Pediatr (Rio J). 2003;79:253-8.
29. Jackman LA, Millane SS, Martin BR, Wood OB, McCabe GP, Peacock M, et al. Calcium retention in relation to calcium intake and postmenarcheal age in adolescent females. Am J Clin Nutr. 1997;66:327-33.
30. Lee WTK, Leung SSF, Leung DMY, Cheng JCY. A follow-up study on the effects of calcium-supplement withdrawal and puberty on bone acquisition of children. Am J Clin Nutr. 1996;64:71-7. 31. Nordström P, Pettersson U, Lorentzon R. Type of physical
activity, muscle strength, and pubertal stage as determinants of bone mineral density and bone area in adolescent boys. J Bone Miner Res. 1998;13:1141-8.
32. Silva CC, Guedes JERP. Dimorfismo sexual na composição corporal e no desempenho motor de adolescentes de 10-16 anos. Rev Bras Ativ Fís Saúde. 2003;8:20-9.
33. Carrascosa A, Guissinyé M. Crescimento e mineralização do esqueleto durante a puberdade e adolescência: regulação nutricional e hormonal.An Nestlé. 1998;55:9-17.
34. Hui SL, Dimeglio LA, Longcope C, Peacock M, McClintock R, Perkins AJ, et al. Difference in bone mass between black and white American children: attributable to body build, sex hormone levels, or bone turnover? J Clin Endocrinol Metab. 2003;88:642-9.
Corresponding author: Tamara Beres Lederer Goldberg
Departamento de Pediatria Disciplina de Medicina do Adolescente CEP 18607-918 Botucatu, SP
Brazil
Phone: +55 (14) 3811.6274/3811.6083 E-mail: [email protected]
Acknowledgements