evaluation study using data of the Cervical Cancer
Information System, 2006-2013*
Correspondence:
Andressa Moura Damacena – Rua Francisca de Melo Lobo, No. 355, Condomínio Vila Vitória, Casa 141, Teresina-PI, Brasil. CEP: 64020-190
E-mail: [email protected] Abstract
Objective: to assess the cervical cancer screening tests in Teresina, Piauí, Brazil. Methods: this is an evaluation study of Teresina Cervical Cancer Information System (Siscolo), for the period from 2006 to 2013, based on descriptive statistical
analyses. Results: 604,331 pap smear tests of women residents in Teresina were registered on the system; 1.8% presented
premalignant or malignant cytological conditions (atypical cells, intraepithelial lesions and cancer); positive results were higher among women aged >64 years old; there was a reduction of 43.9% in the number of tests performed among women in the target age group of the screening program; there was an increment in the percentage of unsatisfactory samples, from 0.33
to 0.89%. Conclusion: Teresina cervical screening program presents some limitations that need to be overcome, especially
concerning the insufficient tests offer, its low proportion of positive results and the growing number of unsatisfactory samples.
Keywords: Uterine Cervical Neoplasms; Vaginal Smears; Cervical Intraepithelial neoplasia; Mass Screening; Program Evaluation.
doi: 10.5123/S1679-49742017000100008
Andressa Moura Damacena1 Laércio Lima Luz2
Inês Echenique Mattos2
1Fundação Municipal de Saúde, Diretoria Regional de Saúde Sul, Teresina-PI, Brasil
2Fundação Oswaldo Cruz, Escola Nacional de Saúde Pública Sergio Arouca, Rio de Janeiro-RJ, Brasil
Introduction
Cervical cancer is the third most frequent type of cancer in the Brazilian female population; 16,340 new cases and an incidence rate of 15.85/100,000 women are estimated for 2016.1
The cervical cancer is preventable and curable when early detected.2 This neoplasn begins in the form of
precursor lesions, which may or may not progress to an invasive process in a period of 10 to 20 years.2 This
relatively long time span, allows preventive actions to be performed in order to break the disease epidemiological chain.3 The substantial reduction in the incidence and
mortality from cervical cancer in some countries has been associated with the implementation of population-based screening programs.4
The conventional method for cervical cancer screening is the cervix cytopathology test, or pap smear test, considered a low cost, simple and easy to perform test.5
Despite current efforts to broaden access to this test for early detection of cervical cancer, we have observed a reduced production of cervical cancer screening tests in most Brazilian states between 2012 and 2013.5 Piauí
has stood out for presenting, in the 2002-2012 period, one of the largest increases in morbidity and mortality rates due to cervical cancer when compared to other Brazilian states, and for following with the same trend estimated for the 2016-2017 period.1
This study aimed to evaluate the screening of cervical cancer in Teresina, Piauí, Brazil.
Methods
This is an evaluation study of screening for cervical cancer in the city of Teresina.
The database of Teresina Cervical Cancer Information System (Siscolo) was used and it presents the records of all pap smear tests performed by the Brazilian National Health System (SUS). The analysis
focused on the period from 2006 to 2013. Siscolo is a open access system; the version 4.0 is used since its implementation in 2006, and incorporates the new Brazilian Nomenclature for Cervical Reports6 and uses
the Bethesda System as a reference.
All pap smear tests from women living in Teresina, registered at Siscolo from 2006 to 2013 were considered in this study.
The following characteristics and indicators of Siscolo were selected to evaluate cervical cancer screening: proportion of tests performed per year and age group; ratio test/target population; proportion of positive results; proportion of premalignant or malignant alterations in the tests per year and age group; completeness of variables; previous cytology tests; time since the last preventive screening; percentage of unsatisfactory samples; and presence of the transformation zone.
The absolute and relative annual rates (%) of the tests were calculated according to age groups (in years: <25, 25-64, and > 64).
The percentage variation in the number of tests conducted in the period from 2006 to 2013 was calculated using the formula A, as follows:
[(number of tests performed in 2013 in the age group – number of tests performed in 2006 in the age group)/number of the tests performed in 2006 in the age group] x 100
To calculate the percentage variation in the proportion of tests performed on specific age groups, compared to the total number of tests, Formula B was applied:
(percentage of tests carried out in 2013 in the age group) – (percentage of tests carried out in 2006 in the age group)
The ratio between pap smear tests and target population was presented in two age groups, because since 2011, with the advent of new Brazilian Guidelines for Screening Cervical Cancer,7 the age group for screening
has been widened, passing from 25-59 to 25-64. The target population was obtained from the 2010 Demographic Census and by population estimates provided by the Brazilian Institute of Geography and Statistics (IBGE) and published on its website (http://www.ibge.gov.br). This indicator assesses whether the tests offered to the target population were enough to reach the coverage goal of the Program for the Control of Cervical Cancer.
Alterations in cytopathologic exams were presented according to age group and year of the exam, using the percentage distribution of alterations and the proportion
The cervical cancer is preventable
of positive results. The proportion of positive results expresses the prevalence of cellular alterations in the exams and the capacity of the screening process to detect lesions in the examined population. This proportion was calculated through the sum of all cytopathologic exams with abnormal results, divided by the total of assessed exams (satisfactory exams) and multiplied by 100. We consider positive results the following classification:8
very low (less than 2% of the exams), low (between 2 and 2.9%), expected (between 3 and 10%) and higher than expected (greater than 10 %).
Premalignant or malignant cervical cytological abnormalities were analyzed (atypical cells, intraepithelial lesions and cancer). Intraepithelial lesions can be classified as follows: low-grade squamous intraepithelial lesion (LSIL); high grade squamous intraepithelial lesion (HGSIL); high-grade lesion – cannot exclude microinvasion (HSIL-micro).
Completeness of the variables was measured through the proportion of complete records, i.e. without 'ignored'/'missing' data. This indicator was interpreted based on the criteria used by Romero and Cunha: excellent, when the completeness percentage was >95%; good, between 90.1 and 95%; regular, between 80.1 and 90%; bad, between 50.1 and 80%; and poor when ≤50%.9
The variables 'previous cytology test' (if the woman had undergone this test previously) and 'time since the last preventive examination' (how long ago [in years] was the test performed: that same year, 1, 2, 3, 4 or more years) were also analyzed for the age group from 25 to 64.
The quality of the examination was assessed through the variable 'adequacy of the sample' (percentage of unsatisfactory samples). A sample is considered unsatisfactory when it does not present minimal conditions for slide analysis for the diagnosis, leading to the need of a test repetition.8 The percentage that
indicates unsatisfactory samples is the number of unsatisfactory samples in relation to the total number of tests performed, multiplied by 100.
The quality of the test related to the material collected was assessed through the variable 'presence of the transformation zone (TZ)' for each of the three age groups. During the examination, the squamous, glandular and metaplastic epithelia can be collected. The sample has the presence of TZ when it allows the verification of metaplastic and/or
glandular epithelium in the examined material.10 It is
mainly in the transformation zone where precursor lesions of cervical cancer come out and where cytological abnormalities are concentrated,10 hence
the importance of the samples to present TZ. This indicator was calculated by dividing the number of samples with presence of TZ and the total number of satisfactory samples, multiplied by 100.
Descriptive statistical analysis was performed using frequency distributions, with the software Excel 2010.
This study was approved by the Research Ethics Committee of the Sérgio Arouca National School of Public Health/Oswaldo Cruz Foundation: Report No.03/2014, issued on September 19th, 2014.
Results
In the period from 2006 to 2013, 604,331 pap smear tests of women living in Teresina were registered at SISCOLO. From the total of tests, 69.4% were carried out in women aged from 25 to 64 years. There was a reduction in the number of examinations in all age-groups – including the priority group of the program, which decreased 43.9% (Table 1).
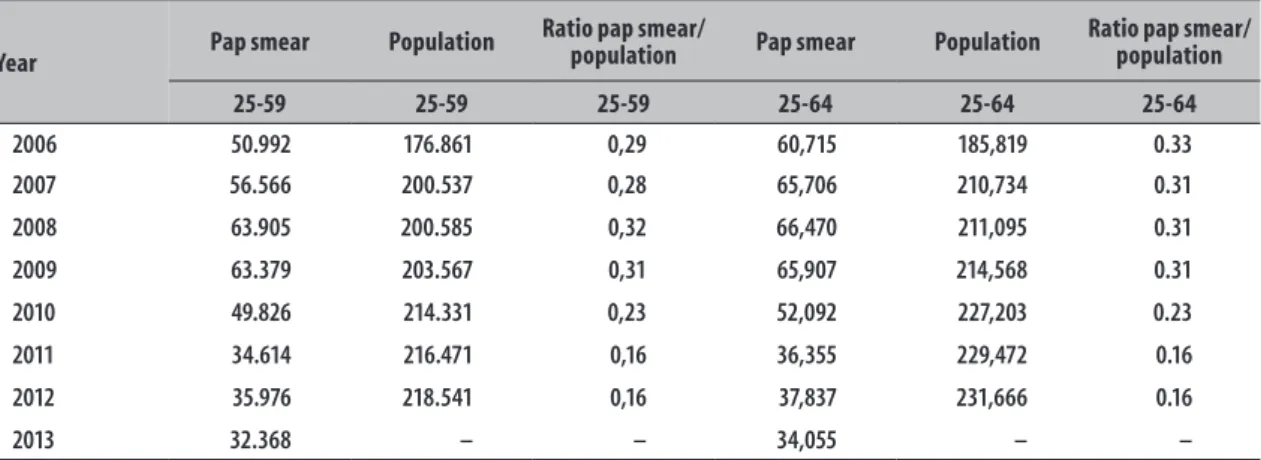
It was also possible to observe that the ratio between pap smear tests and target population decreased 44.8% in women from 25 to 59 years and 51.5% in those from 25 to 64 years, over the studied period. In 2006, in Teresina, considering women from 25 to 64 years, this ratio corresponded to 0.33 test/woman/year, whereas in 2012, this value was 0.16 (Table 2).
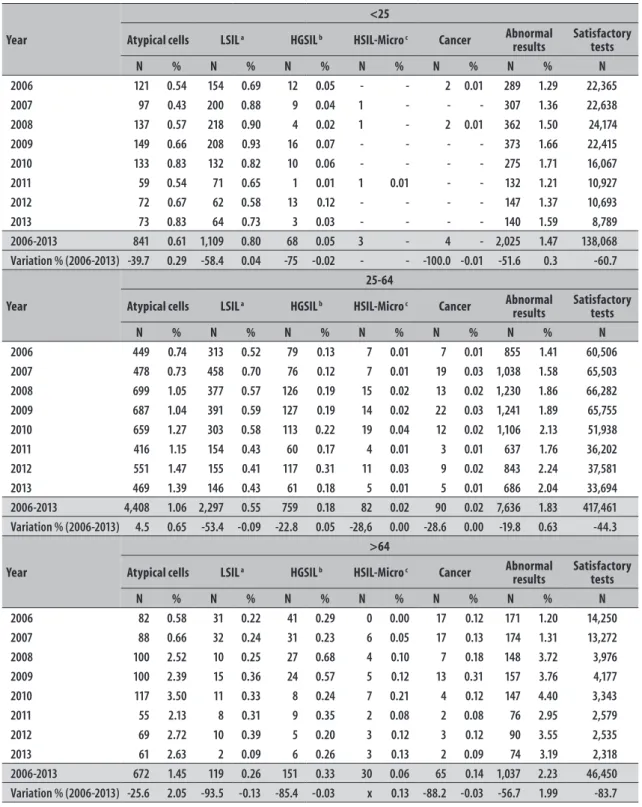
From the total of pap smear tests performed, 1.8% presented abnormalities (10,698 pap smear tests). The atypical cells were the main types of alteration found, with higher prevalence in women >64 years old. Between 2006 and 2013, the proportion of positive results increased 0.3%, 0.6% and 2.0% for the age groups <25, 25-64 and > 64 years, respectively (Table 3).
During the studied period, the LSIL accounted for more than half of the results with alterations in the age group < 25 years (54.7%), whilst among women aged 25-64 years it accounted for 30.0% of abnormal results, and among those >64 years, 11.5%, with prevalences of 0.8%, 0.6% and 0.3% for the three age groups, respectively (Table 3).
results) and < 25 age group (3.4% of abnormal results), with prevalences of 0.3%, 0.2% and 0.1%, respectively, during the studied period (Table 3).
The cancer diagnosis was more frequent in the age group > 64 (6.3% of abnormal results), whereas in the 25-64 age group it corresponded to 1.2% of abnormal results, and in the < 25 age group, 0.2% (Table 3).
The proportion of positive results of the tests was higher for women > 64 years old (2.23%), and lower in those < 25 years old (1.47%). The LSIL were prevalent in younger women, <25 years (Table 3).
Some Siscolo variables should be highlighted for their bad completeness (classified as 'ignored'/'blank' data), according to the criteria used by Romero and Cunha.9 The
lowest percentages of completeness have been observed in the variables 'education level' and 'ethnicity/ skin color', for which the values have oscillated during the period analyzed: from 42.0% (2008) to 5.6% (2013).
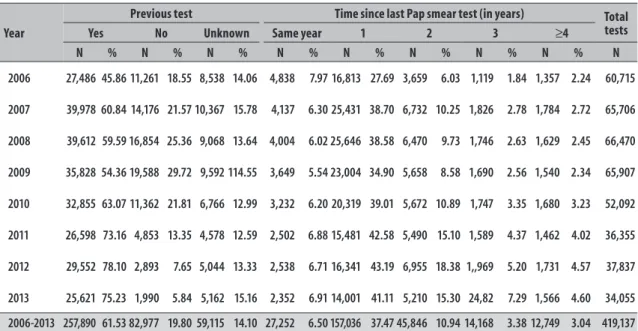
In the female population from 25 to 64 years old, we found that the percentage of tests recorded for the first time increased 11.2% between 2006 and 2009, and decreased 15.9% between 2010 and 2013 (Table 4).
In Teresina, the percentage of unsatisfactory samples increased for all age groups, especially in the 2010-2013 period. The highest percentage of unsatisfactory samples was observed in the age group > 64, in 2013 (1.4%).
In the period from 2006 to 2013, 601,979 tests (99.6%) were classified as satisfactory; 59.6%
Table 1 – Distribution of pap smear tests performed per year and variation percentage, according to age group, in the municipality of Teresina-PI, 2006-2013
Year
Age group (in years) Total pap smear
tests performed
<25 25-64 >64
N % N % N % N
2006 22,428 23.01 60,715 62.29 14,323 14.70 97,466
2007 22,674 22.29 65,706 64.61 13,323 13.10 101,703
2008 24,229 25.58 66,470 70.18 4,009 4.23 94,708
2009 22,454 24.26 65,907 71.20 4,199 4.54 92,560
2010 16,103 22.50 52,092 72.80 3,360 4.70 71,555
2011 10,957 21.95 36,355 72.83 2,603 5.21 49,915
2012 10,753 21.02 37,837 73.98 2,554 4.99 51,144
2013 8,867 19.58 34,055 75.21 2,358 5.21 45,280
2006-2013 138,465 22.91 419,137 69.36 46,729 7.73 604,331
Variation % (2006-2013) -60.46 -3.43 -43.91 12.92 -83.54 -9.49 -53.54
Table 2 – Ratio between pap smear tests and target population (age groups 25-59 and 25-64 years) in the municipality of Teresina-PI, 2006-2013
Year Pap smear Population
Ratio pap smear/
population Pap smear Population
Ratio pap smear/ population
25-59 25-59 25-59 25-64 25-64 25-64
2006 50.992 176.861 0,29 60,715 185,819 0.33
2007 56.566 200.537 0,28 65,706 210,734 0.31
2008 63.905 200.585 0,32 66,470 211,095 0.31
2009 63.379 203.567 0,31 65,907 214,568 0.31
2010 49.826 214.331 0,23 52,092 227,203 0.23
2011 34.614 216.471 0,16 36,355 229,472 0.16
2012 35.976 218.541 0,16 37,837 231,666 0.16
Table 3 – Percentage distribution of cytological alterations in pap smear tests performed per year and variation percentage, and type of alteration, according to age (in years) in Teresina-PI, 2006-2013
Year
<25
Atypical cells LSIL a HGSIL b HSIL-Micro c Cancer Abnormal
results Satisfactory tests
N % N % N % N % N % N % N
2006 121 0.54 154 0.69 12 0.05 - - 2 0.01 289 1.29 22,365
2007 97 0.43 200 0.88 9 0.04 1 - - - 307 1.36 22,638
2008 137 0.57 218 0.90 4 0.02 1 - 2 0.01 362 1.50 24,174
2009 149 0.66 208 0.93 16 0.07 - - - - 373 1.66 22,415
2010 133 0.83 132 0.82 10 0.06 - - - - 275 1.71 16,067
2011 59 0.54 71 0.65 1 0.01 1 0.01 - - 132 1.21 10,927
2012 72 0.67 62 0.58 13 0.12 - - - - 147 1.37 10,693
2013 73 0.83 64 0.73 3 0.03 - - - - 140 1.59 8,789
2006-2013 841 0.61 1,109 0.80 68 0.05 3 - 4 - 2,025 1.47 138,068
Variation % (2006-2013) -39.7 0.29 -58.4 0.04 -75 -0.02 - - -100.0 -0.01 -51.6 0.3 -60.7
Year
25-64
Atypical cells LSIL a HGSIL b HSIL-Micro c Cancer Abnormal
results Satisfactory tests
N % N % N % N % N % N % N
2006 449 0.74 313 0.52 79 0.13 7 0.01 7 0.01 855 1.41 60,506
2007 478 0.73 458 0.70 76 0.12 7 0.01 19 0.03 1,038 1.58 65,503
2008 699 1.05 377 0.57 126 0.19 15 0.02 13 0.02 1,230 1.86 66,282
2009 687 1.04 391 0.59 127 0.19 14 0.02 22 0.03 1,241 1.89 65,755
2010 659 1.27 303 0.58 113 0.22 19 0.04 12 0.02 1,106 2.13 51,938
2011 416 1.15 154 0.43 60 0.17 4 0.01 3 0.01 637 1.76 36,202
2012 551 1.47 155 0.41 117 0.31 11 0.03 9 0.02 843 2.24 37,581
2013 469 1.39 146 0.43 61 0.18 5 0.01 5 0.01 686 2.04 33,694
2006-2013 4,408 1.06 2,297 0.55 759 0.18 82 0.02 90 0.02 7,636 1.83 417,461
Variation % (2006-2013) 4.5 0.65 -53.4 -0.09 -22.8 0.05 -28,6 0.00 -28.6 0.00 -19.8 0.63 -44.3
Year
>64
Atypical cells LSIL a HGSIL b HSIL-Micro c Cancer Abnormal
results
Satisfactory tests
N % N % N % N % N % N % N
2006 82 0.58 31 0.22 41 0.29 0 0.00 17 0.12 171 1.20 14,250
2007 88 0.66 32 0.24 31 0.23 6 0.05 17 0.13 174 1.31 13,272
2008 100 2.52 10 0.25 27 0.68 4 0.10 7 0.18 148 3.72 3,976
2009 100 2.39 15 0.36 24 0.57 5 0.12 13 0.31 157 3.76 4,177
2010 117 3.50 11 0.33 8 0.24 7 0.21 4 0.12 147 4.40 3,343
2011 55 2.13 8 0.31 9 0.35 2 0.08 2 0.08 76 2.95 2,579
2012 69 2.72 10 0.39 5 0.20 3 0.12 3 0.12 90 3.55 2,535
2013 61 2.63 2 0.09 6 0.26 3 0.13 2 0.09 74 3.19 2,318
2006-2013 672 1.45 119 0.26 151 0.33 30 0.06 65 0.14 1,037 2.23 46,450
Variation % (2006-2013) -25.6 2.05 -93.5 -0.13 -85.4 -0.03 x 0.13 -88.2 -0.03 -56.7 1.99 -83.7
presented epithelium of TZ. A constant reduction in this percentage was observed: from 71.5% (2007) to 47.8% (2013) (Table 5).
Discussion
In the present study, we observed a sharp reduction in the number of tests in the period from 2006 to 2013, including the target population of the Program for
the Control of Cervical Cancer. There was also a high percentage of annual repetition of the test, low search of women who had never undergone the examination, low positivity proportion, low presence of the transformation zone, constant increasing trend in the percentage of unsatisfactory samples and low completeness of socioeconomic data on women enrolled in the program.
This study contributes to the situational diagnosis of cervical cancer screening in Teresina, as it evaluates
Table 4 – Frequency of pap smear tests in the age group 25-64 years in Teresina-PI, 2006-2013
Year
Previous test Time since last Pap smear test (in years) Total
tests
Yes No Unknown Same year 1 2 3 ≥4
N % N % N % N % N % N % N % N % N
2006 27,486 45.86 11,261 18.55 8,538 14.06 4,838 7.97 16,813 27.69 3,659 6.03 1,119 1.84 1,357 2.24 60,715
2007 39,978 60.84 14,176 21.57 10,367 15.78 4,137 6.30 25,431 38.70 6,732 10.25 1,826 2.78 1,784 2.72 65,706
2008 39,612 59.59 16,854 25.36 9,068 13.64 4,004 6.02 25,646 38.58 6,470 9.73 1,746 2.63 1,629 2.45 66,470
2009 35,828 54.36 19,588 29.72 9,592 114.55 3,649 5.54 23,004 34.90 5,658 8.58 1,690 2.56 1,540 2.34 65,907
2010 32,855 63.07 11,362 21.81 6,766 12.99 3,232 6.20 20,319 39.01 5,672 10.89 1,747 3.35 1,680 3.23 52,092
2011 26,598 73.16 4,853 13.35 4,578 12.59 2,502 6.88 15,481 42.58 5,490 15.10 1,589 4.37 1,462 4.02 36,355
2012 29,552 78.10 2,893 7.65 5,044 13.33 2,538 6.71 16,341 43.19 6,955 18.38 1,,969 5.20 1,731 4.57 37,837
2013 25,621 75.23 1,990 5.84 5,162 15.16 2,352 6.91 14,001 41.11 5,210 15.30 24,82 7.29 1,566 4.60 34,055
2006-2013 257,890 61.53 82,977 19.80 59,115 14.10 27,252 6.50 157,036 37.47 45,846 10.94 14,168 3.38 12,749 3.04 419,137
Table 5 – Presence of the transformation zone in pap smear tests, according to age (in years) in Teresina-PI, 2006-2013
Year <25 25-64 >64 All ages
n % N n % N n % N n % N
2006 5,794 25.91 22,365 23,208 38.36 60,506 9,781 68.64 14,250 38,783 39.93 97,121
2007 14,621 64.59 22,638 48,257 73.67 65,503 9,668 72.85 13,272 72,546 71.54 101,413
2008 14,361 59.41 24,174 45,705 68.96 66,282 1,868 46.98 3,976 61,934 65.59 94,432
2009 13,159 58.71 22,415 44,446 67.59 65,755 2,130 50.99 4,177 59,735 64.69 92,347
2010 9,431 58.70 16,067 34,550 66.52 51,938 1,671 49.99 3,343 45,652 63.98 71,348
2011 5,966 54.60 10,927 22,785 62.94 36,202 1,019 39.51 2,579 29,770 59.89 49,708
2012 5,808 54.32 10,693 22,420 59.66 37,581 895 35.31 2,535 29,123 57.32 50,809
2013 3,922 44.62 8,789 16,877 50.09 33,694 627 27.05 2,318 21,426 47.82 44,801
the frequency of examinations, to the prevalence of cytological alterations, coverage of the target population, quality of sample collection, analysis of slides, and Siscolo information completeness. A possible limitation of the findings presented herein would be related to inadequate monitoring of Siscolo data by health managers.11,12 The system was created
with the purpose of recording all pap smear tests performed by SUS.7 However, one cannot rule out possible flaws in this record, and consequently, differences between the control actions for cervical cancer developed by health units in Teresina and the information registered in Siscolo.
There is a consensus that a well-organized screening program can reduce the incidence and mortality due to cervical cancer by up to 90.0%,13
whose evidence comes mainly from the experience of developed countries, where significant reductions were obtained after introducing population-based screening programs.4 Cervical cancer screening
covers a number of steps: the screening examination, identification of positive cases, diagnostic confirmation and treatment.4,13,14 The parameter that distinguishes
the opportunist screening from the population-based screening programs is a routine monitoring and evaluation process.14 In the population-based
screening, we can identify the individual history of women in relation to the frequency of examinations, the date of the last examination and results, among other variables, allowing the identification of women who have repeated or have taken the tests for the first time. In Brazil, the opportunistic screening is more common, in which most women undergo pap smear tests after seeking health services for some other reason. Thus, some women undergo the examination more than necessary, while others do not even have access to it.14,15
From Siscolo data, when we select the variable 'service provider', we can observe that in the municipality of Teresina, between 2006 and 2009, there were two laboratories with a production scale of more than 15,000 tests/year. These two companies accounted for about 70.0% of the production of municipal examinations. From 2010 on, one of them presented a sharp reduction in the production of tests, reaching only 746 tests processed in 2013. Therefore, since 2010, Teresina has a single laboratory with a scale of production of more than 15 thousand tests/year, which is responsible for 57.0%, 82.0%, 90.0% and 89.0% of the tests carried out
in 2010, 2011, 2012 and 2013, respectively. Scientific evidence shows that the production scale is relevant to the quality of the analysis of the pap smear slides. This happens because suspicious lesions are relatively rare (3 to 10% of the samples), which requires a higher volume of tests so the professional in charge can become familiar with them and gain experience. Laboratories are recommended to have minimum production of 15,000 examinations/year to acquire a satisfactory level of competence – except for units of high complexity in oncology, university hospitals and monitoring laboratories.8
Regarding the cervical cancer, the main indicator agreed between the Ministry of Health, states and municipalities is the ratio of tests performed and the target population.17 This indicator should be weighted
by the participation of Supplementary Health in the municipality, since the tests undergone by beneficiaries of private health insurances are not registered at Siscolo. Given that the coverage of Supplementary Health among the female population in Teresina in 2006 was 15.0%, and in 2012, 22.4%, yet the present study found a ratio much lower than the expected for the indicator.18
Data on the offer of examinations allow to verify whether it is enough in quantity and directed according to the recommended interval (every three years after two consecutive normal tests within one year).5 Based
on the repetition of the test recommended every three years, the ratio tests/target population is expected to be 0.3 annually, in order to track 100% of women in the age group of the target population by the end of this three-year period. The repetition of pap smear test in the period up to one year is indicated only for women who were examined for the first time, or who have had tests with unsatisfactory sample, or have alterations which require monitoring in a shorter interval.6 However, there was a high percentage of tests
repetition within one year period. Similar results were also observed in another study at the same municipality of Teresina, with 464 young women who had completed a pregnancy in the first four months of 2006 in the hospitals of the capital,19 in which the main objective
program to capture women who have not yet taken this test.
Countries where well organized screening programs were implemented, which reduced the incidence and mortality rates for cervical cancer, such as the United States, Norway and the United Kingdom, presented proportion of positivity of 6,8%,20 4,9%21
and 6,4%22 respectively. In Teresina, we observed a
low proportion of positive results (1.8%), possibly a sign that suspicious alterations are not being identified in the laboratories, leading to false negative tests. In a study on the screening of cervical cancer in Brazil, with Siscolo data for the period from 2002 to 2006,11
the researchers have observed an increase in positive results for Pap smear tests in the country of 22.9%, with positivity of 2.3% in 2002 and 2.9% in 2006, but with significant variation between age groups and regions: increase in positive tests in the Southeast (53.1%), South (6.3%) and Midwest (26.9%); and reduction in the North (12.4%) and Northeast (2%).11 In 2006,
the Northeast presented positivity of 2.2% of the tests, whereas the North presented 3.3%, the Midwest 3.7%, the South 2.2% and the Southeast 3.4%.11 Comparing
these country data with the findings of this study for Teresina, in 2006, there are fewer positive tests than in the other capitals of the country.
The high proportion of atypical cells of undetermined significance (55.4% of abnormal tests) observed in this study points to the need for technical training for slides analysis. This ratio works as an indicator of laboratories quality. The literature indicates that 20 to 40% of patients with atypical cells will present low-degree lesions and from 5 to 15% of them will present high-degree lesions.23 In the older age groups, the
prevalence of LSIL decreased, whereas the prevalence of HGSIL increased, especially for the age group of 64 years and over. There are similar findings in studies conducted in England,24 in São Paulo25 and in the
municipality of Rio de Janeiro,26 among others. The
LSIL are considered non-precursor lesions and most of them regress spontaneously. Recently, it was suggested that the treatment of precursor lesions in adolescents and young women might be associated with increasing obstetric and neonatal morbidity.27 For women aged
over 64, the significant percentage of precursor lesions and cancer probably express the non-carrying out of pap smear and/or the low quality of screening, in earlier periods of their lives.
A research with Siscolo data for Brazil pointed to a gradual increase in the percentage of unsatisfactory samples of pap smear tests in the Midwest and Northeast regions, from 2002 to 2006.11 The minimum
quality standard established by the Pan American Health Organization for this indicator corresponds to a 5% limit; however, the goal is that it tends to zero, in order to ensure the effectiveness of screening.28 For
Teresina, the indicator is within that limit, although it has shown constant increasing trend in the analyzed period, which could indicate the need for evaluation, in order to improve the screening program.
The low presence of the TZ in the present study points to the need for technical training addressed to the stage of material collection. In a study on the screening of cervical cancer in the state of Maranhão in 2012, the authors pointed out that 64.2% of the tests had the presence of TZ12. Comparatively, in Teresina, the presence of TZ in
the same year was 6.8% lower than in Maranhão. Health professionals, when presenting the test results to women, should check if the sample have presence of TZ, since most of precursor lesions of cervical cancer arise in this area.10
In an evaluative study on the quality of SISCOLO data in Vitória, the capital of Espírito Santo State,29 authors
pointed the completeness of the variables 'education level' and 'ethnicity/skin color' as bad. Other authors point out the completeness of socioeconomic variables in other information systems as bad, assigning the failure to complete these fields to the little importance given by health professionals for these characteristics,30
although they are important variables to identify the socioeconomic level of women screened and, therefore, for the development of strategies for prevention and control of cervical cancer.
Even though the analyses of this study are restricted to the screening program for cervical cancer in Teresina, we believe that several of these limitations are common to other Brazilian municipalities’ programs, and the study can be a basis for the development of qualification strategies of this neoplasia control actions.
charge of analyzing the slides is to be highlighted. On the other hand, although the Siscolo presents a high potential as a management tool in the control program of cervical cancer, we suggest it to be structured as a longitudinal information system, enabling the understanding of the care offered to women over time. The quality of information registered at Siscolo and the establishment of routines for periodic and continuous evaluation of the data should be prioritized by health managers, in order to qualify the screening actions.
Authors' contributions
Damacena AM, Luz LL and Mattos IE contributed to the design of the study, data analysis, drafting and review of the manuscript.
Damacena AM organized the database to carry out the statistical analysis.
All authors have approved the final version of the manuscript and declared to be responsible for all aspects of the study, ensuring its accuracy and integrity.
1. Ministério da Saúde (BR). Instituto Nacional do Câncer José de Alencar Gomes da Silva. Estimativa 2016: incidência de câncer no Brasil. Rio de Janeiro: Instituto Nacional do Câncer; 2015.
2. Santos RS, Melo ECP, Santos KM. Análise espacial dos indicadores pactuados para o rastreamento do câncer do colo do útero no Brasil. Texto Contexto Enferm. 2012 out-dez;21(4):800-10.
3. Gonzaga CMR, Freitas-Júnior R, Barbaresco AA, Martins E, Bernardes BT, Resende APM. Cervical cancer mortality trends in Brazil: 1980-2009. Cad Saude Publica. 2013 Mar;29(3):599-608.
4. Van Der AaMA, Pukkala E, Coebergh JW, Anttila A, Siesling S. Mass screening programmes and trends in cervical cancer in Finland and the Netherlands. Int J Cancer. 2008 Apr;122(8):1854-8.
5. Ministério da Saúde (BR). Instituto Nacional de Câncer José de Alencar Gomes da Silva. Coordenação de Prevenção e Vigilância. Monitoramento das ações de controle dos cânceres do colo do útero e de mama. Inf Detecção Precoce. 2014 jan-abr;5(1):1-8.
6. Ministério da Saúde (BR). Secretaria de Atenção à Saúde. Instituto Nacional de Câncer. Coordenação de Prevenção e Vigilância. Nomenclatura brasileira para laudos cervicais e condutas preconizadas: recomendações para profissionais de saúde. 2. ed. Rio de Janeiro: Instituto Nacional de Câncer; 2006.
7. Ministério da Saúde (BR). Instituto Nacional de Câncer. Coordenação Geral de Ações Estratégicas. Divisão de Apoio à Rede de Atenção Oncológica. Diretrizes brasileiras para o rastreamento do câncer do colo do útero. Rio de Janeiro: Instituto Nacional de Câncer; 2011.
8. Ministério da Saúde (BR). Instituto Nacional de Câncer José de Alencar Gomes da Silva. Coordenação de Prevenção e Vigilância. Monitoramento das ações de
controle dos cânceres do colo do útero e de mama. Inf
Detecção Precoce. 2013 mai-ago;4 no esp:1-9.
9. Romero DE, Cunha CB. Avaliação da qualidade das variáveis epidemiológicas e demográficas do Sistema de Informações sobre Nascidos Vivos, 2002. Cad Saude Publica. 2007 mar;23(3):701-14.
10. Ministério da Saúde (BR). Instituto Nacional de Câncer José de Alencar Gomes da Silva. Coordenação de Prevenção e Vigilância. Monitoramento das ações de controle dos cânceres do colo do útero e de mama. Inf Detecção Precoce. 2012 jan-mar;3(1):1-8.
11. Dias MBK, Tomazelli JG, Assis M. Rastreamento do câncer de colo do útero no Brasil: análise de dados do Siscolo no período de 2002 a 2006. Epidemiol Serv Saude. 2010 jul-set;19(3):293-306.
12. Silva DSM, Silva AMN, Brito LMO, Gomes SRL, Nascimento MDSB, Chein MBC. Rastreamento do câncer do colo do útero no Estado do Maranhão, Brasil. Cienc Saude Coletiva. 2014 abr;19(4):1163-70.
13. International Agency for Research on Cancer. Globocan 2012: estimated cancer incidence, mortality and prevalence worldwide in 2012 [Internet]. Lyon: International Agency for Research on Cancer; 2012 [cited 2016 Aug 23]. Available from: http://globocan. iarc.fr/Default.aspx
14. Adab P, McGhee SM, Yanova J, Wong CM, Hedley AJ. Effectiveness and efficiency of opportunistic cervical cancer screening: comparison with organized screening. Med Care. 2004 Jun;42(6):600-9.
15. Quadros CAT, Victora CG, Costa JSD. Coverage and focus of a cervical cancer prevention program in southern Brazil. Rev Panam Salud Publica. 2004 Oct; 16(4):223-32.
16. Priest P, Sadler L, Peters J, Crengle S, Bethwaite P, Medley G, Jackson R. Pathways to diagnosis of cervical
Received on 31/05/2016
Approved on 30/07/2016
cancer: screening history, delay in follow up, and smear reading. BJOG. 2007 Apr;114(4):398-407.
17. BRASIL. Ministério da Saúde. Portaria no 325 de 21 de fevereiro de 2008. Estabelece prioridades, objetivos e metas do Pacto pela Vida para 2008, os indicadores de monitoramento e avaliação do Pacto pela Saúde e as orientações, prazos e diretrizes para a sua pactuação. Diário Oficial da República Federativa do Brasil, Brasília (DF), 2008 fev 22; Seção 1:37.
18. Agência Nacional de Saúde Suplementar. ANS Tabnet: informações em saúde suplementar [Internet]. Brasília: Agência Nacional de Saúde Suplementar; 2016 [citado 2016 ago 25]. Disponível em: http://www.ans. gov.br/anstabnet/cgi-bin/dh?dados/tabnet_02.def
19. Barroso MF, Gomes KRO, Andrade JX. Frequência da colpocitologia oncótica em jovens com antecedentes obstétricos em Teresina, Piauí, Brasil. Rev Panam Salud Publica. 2011 mar;29(3):162-8.
20. Davey DD, Neal MH, Wilbur DC, Colgan TJ, Styer PE, Mody DR. Bethesda 2001 implementation and reporting rates: 2003 practices of participants in the College of American Pathologists Interlaboratory Comparison Program in Cervicovaginal Cytology. Arch Pathol Lab Med. 2004 Nov;128(11):1224-9.
21. Nygård JF, Skare GB, Thoresen SO. The cervical câncer screening programme in Norway, 1992-2000: changes in Pap smear coverage and incidence of cervical cancer. J Med Screen. 2002 Feb;9(2):86-91.
22. Health and Social Care Information Centre. Cervical Screening Programme: England, statistics for 2014-15 [Internet]. Leeds: Health and Social Care Information Centre; 2015 [cited 2016 Aug 23]. Avaliable from: http://digital.nhs.uk/catalogue/PUB18932/nhs-cervical-stat-eng-2014-15-rep.pdf
23. Bueno KS. Atipias escamosas de significado indeterminado: novas qualificações e importância na conduta clínica. Rev Bras Anal Clin. 2008;40(2):121-8.
24. Mount SL, Papillo JL. A study of 10,296 pediatric and adolescent Papanicolaou smear diagnoses in northern New England. Pediatrics. 1999 Mar;103(3):539-45.
25. Rama CH, Roteli-Martins CM, Derchain SFM, Oliveira EZ, Aldrighi JM, Mariani Neto C. Detecção sorológica de anti-HPV 16 e 18 e sua associação com os achados do papanicolau em adolescentes e mulheres jovens. Rev Ass Med Bras. 2006 jan-fev;52(1):43-7.
26. Pedrosa ML, Mattos IE, Koifman RJ. Lesões intra-epiteliais cervicais em adolescentes: estudo dos achados citológicos entre 1999 e 2005, no Município do Rio de Janeiro, Brasil. Cad Saude Publica. 2008 dez;24(12):2881-90.
27. Kyrgiou M, Koliopoulos G, Martin-Hirsch P, Arbyn M, Prendiville W, Paraskevaidis E. Obstetric outcomes after conservative treatment for intraepithelial or early invasive cervical lesions: systematic review and meta-analysis. Lancet. 2006 Feb;367(9509):489-98.
28. Marrett LD, Robles S, Ashbury FD, Green B, Goel V, Luciani S. A proposal for cervical screening information systems in developing countries. Int J Cancer. 2002 Nov;102(3):293-9.
29. Almeida MVS, Amorim MHC, Thuler LCS, Zandonade E. Avaliação da qualidade dos dados do Sistema de informação do câncer de colo do útero em Vitória – ES, Brasil. Rev Bras Cancerol.2012;58(3):427-33.