Karla Mychellyne Costa Oliveira(a) Simonides Consani(a)
Luciano Souza Gonçalves(b) William Cunha Brandt(c) Renzo Alberto Ccahuana- Vásquez(d)
(a) Department of Dental Materials, Piracicaba Dental School, State University of Campinas, Piracicaba, SP, Brazil.
(b) Department of Restorative Dentistry, University of Uberaba, Uberaba, MG, Brazil.
(c) Department of Prosthodontics, Dentistry School, University of Taubaté, Taubaté, SP, Brazil.
(d) Department of Comprehensive Dentistry, University of Texas Health Science Center, San Antonio, TX, USA.
Corresponding author:
Karla Mychellyne Costa Oliveira E-mail: [email protected]
Received for publication on Oct 13, 2011 Accepted for publication on Jan 18, 2012
Photoelastic evaluation of the effect of
composite formulation on polymerization
shrinkage stress
Abstract: We compared polymerization stress in two commercial composites and three experimental composites made using camphorquinone (CQ) and/or phenylpropanedione (PPD) as photoinitiators. The internal surfaces of photo-elastic resin discs with cylindrical cavities were roughened and treated with
adhesive. Composites were divided into ive groups: two commercial com -posites (Filtek Silorane and Filtek Z250) and three experimental com-posites with CQ/amine, CQ/PPD/amine, and PPD/amine. Composites were photopo-lymerized inside cavities, and subjected to photoelastic analysis immediately and at 24 hours and 7 days later using a plane polariscope. Stress created by Silorane (3.08 ± 0.09 MPa) was similar to that of Z250 (3.19 ± 0.13 MPa) im-mediately after photopolymerization (p > 0.05). After 24 hours and 7 days, Z250 (3.53 ± 0.15 and 3.69 ± 0.10 MPa, respectively) showed higher stress than Silorane (3.19 ± 0.10 and 3.16 ± 0.10 MPa, respectively). Qualitative analysis immediately after photopolymerization showed composite/CQ promoted high-er stress than PPD, but stress levels at othhigh-er evaluated times whigh-ere statistically similar, varying between 3.45 ± 0.11 MPa and 3.92 ± 0.13 MPa. At 24 hours and 7 days, Silorane created the lowest stress. All photoinitiators created com-parable tensions during polymerization.
Descriptors: Composite Resins; Polymerization; Photoinitiators, Dental; Dental Stress Analysis.
Introduction
Dental composites are polymer-based materials that shrink during polym-erization. Stress occurs when shrinkage is limited and the material is rigid and
low resistant.1 These stresses may cause imperfections at the bond interface,
allowing marginal leakage and bacterial contamination.2 Many
factors—in-cluding some that are related to material composition such as organic matrix
composition, initiation system, and amount of inorganic iller—affect the de
-gree of polymerization shrinkage, inluencing contraction and strain.3-5
The organic matrices of composites contain different monomers. Recently, a new silorane-based monomer composite was introduced for use in dentistry. The silorane polymer chain is formed by cationic ring opening and involves the action of three initiator components. Ring opening results in molecular ex-pansion that compensates for polymerization shrinkage.6 Thus, stresses
gener-ated by polymerization processes associgener-ated with silorane are lower than those associated with methacrylate-based composites.7
Most composites include camphorquinone (CQ) as a photoinitiator agent
and an amine acting as co-initiator.8
1-Phenyl-1,2-pro-panedione (PPD) has been suggested as a possible CQ substitute, with the potential to reduce discoloration and improve the aesthetic properties of composites.9
Gener-ally, PPD-containing composites attain maximum po-lymerization values more slowly than those with CQ, because the polymerization rate and degree of conver-sion depend on the absorbed power density.10
The aim of this study was to use photoelastic analy-sis to evaluate polymerization shrinkage stress. Photo-elastic analysis is a visual measurement based on the property of some transparent materials to exhibit
inter-ference fringes when stressed in a polarized light ield.
This technique has been used previously to evaluate po-lymerization shrinkage stress in dental composites.4,11
These fringes have mathematical relationships and or-der numbers that are dependent on the load intensity ap-plied to the photoelastic material.12,13 In this study, stress
induced in three experimental and two commercial composites was assessed immediately after photopoly-merization and 24 hours and 7 days later.
Methodology
Composites composition
Commercial composites were Filtek Silorane (Si-lorane) and Filtek Z250 (Z250) (3M ESPE, St. Paul, USA) prepared using Adper Single Bond 2 and Silorane adhesive systems (3M ESPE).
For experimental composites, the organic matrix was composed of the dimethacrylate monomers bisphenol A glycidyl dimethacrylate (Bis-GMA, Aldrich Chemistry, São Paulo, Brazil), ethoxylated bisphenol A dimethac-rylate (Bis-EMA, Aldrich), urethane dimethacdimethac-rylate (UDMA, Aldrich), and triethyleneglycol dimethacrylate (TEGDMA, Aldrich). The inorganic matrix was com-posed of Bario Aluminium Silicate (BaAlSi, 0.5 µm,
Biodinâmica, Ibiporã, Brazil) and 20 wt.% silicon di-oxide (SiO2, 0.04 µm, Biodinâmica). Both were treated with 3% methacryloxipropyl trimethoxisilan. The ini-tiator agents were CQ (Aldrich) and PPD (Aldrich), the reducing agent was dimethyl amino ethyl methacrylate (DMAEMA) (Aldrich), and the inhibitor was butylated hydroxytoluene (0.1 wt.%) (Aldrich). The composition of the experimental composites is presented in Table 1. Experimental composites were prepared at room
tem-perature under low illumination by irst preparing sep
-arate organic and inorganic matrices and then mixing these phases.
Specimen preparation
Araldite GY 279 photoelastic base resin and Aradur 2963 catalyst (Araltec Produtos Químicos, São Paulo, Brazil) were used to fabricate discs 20 mm in diameter, 2 mm thick, with a central perforation 6 mm in diameter. Inner preparation surfaces of Araldite resin discs were roughened using a bench drill to improve photoelastic resin–composite bonding. Discs were stored at 37°C for 24 hours to allow relief of photoelastic resin stress. Be-fore specimen preparation, each disc was placed in the photoelastic device to assess residual stress. If any was detected, the disc was stored in an oven at 37°C for 24 hours until stress was completely released.
Photoelastic discs were separated into ive groups
(n = 5 each):
• Silorane,
• Z250,
• Experimental I (CQ),
• Experimental II (CQ/PPD), and
• Experimental III (PPD).
The inner surfaces of Araldite discs were treated with the appropriate adhesive system for each composite
Composites
Organic matrix (40 wt.%)
Filler (60 wt.%) Monomers Initiation system
Experimental I Bis-GMA (29%) UDMA (31%) Bis-EMA (31%) TEGDMA (7%)
CQ/amine (0.4/0.8%)
BaAlSi, 0.5 µm (80%) SiO2, 0.04 µm (20%) Experimental II CQ/PPD/amine (0.2/0.2/0.8%)
Experimental
III PPD/amine (0.4/0.8%)
Bis-GMA, bisphenol A glycidyl dimethacrylate; BIS-EMA, ethoxylated bisphenol A dimethacrylate; UDMA, urethane dimethacrylate; TEGDMA, triethyleneglycol dimethacrylate; CQ, camphorquinone; PPD,
following the manufacturer’s instructions. A bulk incre-ment of composite was placed in the central perforation of the photoelastic disc and polymerized using an LED-based dental curing unit (Ultra-Lume LED 5, Ultradent Products Inc., South Jordan, USA) set at 890 mW/cm2 in
standard exposure mode for 60 seconds to induce maxi-mum stress in the composite.
Optical calibration
To obtain the photoelastic constant (ƒσ) of Araldite resin, optical calibration was performed.14 Briely, a
beam of photoelastic resin was loaded using the four-points bending method, which produces stress patterns of pure bending, generating horizontal isochromatic fringes from a neutral axis on the center of the beam. According to a plot of 3 Pa versus h2N, the mean coef-icient value was ƒσ = 11271 N/m.
Photoelastic analysis
Photoelastic images were recorded with a 2.1-mega-pixel digital camera (FD Mavica, Sony model MVC-FD97, Tokyo, Japan) at three time points (immediately after light activation and 24 hours and 7 days post-po-lymerization) in a plane photoelastic device with exact
ilter angulations (90 degrees) to obtain constant colored fringes. Next, a red ilter was placed between the light source and the irst polarized lens to obtain constant light and dark ields on images. Fringes formed on the
photoelastic resin were qualitatively analyzed based on the Stress-Optical Law.15
Photoelastic measurements
Polymerization shrinkage stress data (in MPa) were calculated based on the methodology of Ernst et al.4
Ba-sically, three measurements of the irst-order photoelas
-tic fringe obtained from Araldite discs were obtained from each specimen (n = 5) on monochromatic images using UTHSCSA ImageTool software (University of Texas, San Antonio, TX, USA; available without cost from ftp://maxrad6.uthscsa.edu). Shrinkage stress
val-ues (σ0) were obtained from the isochromatic ring
diam-eters using the following equation:
σ0 = (Nx Dx 2 ƒ
σ)/(Di 2 2d)
where Nx is the isochromatic ring order, Dx is the
iso-chromatic ring diameter (mm), Diis the disc prepa-ration diameter (mm), ƒσ is the photoelastic constant (N/mm), and d is the disc thickness (mm).
Homogeneity and homoscedasticity tests were
per-formed to conirm normality of the data. The mean of
the shrinkage stress values was obtained, and the data
were statistically analyzed considering the ive groups
and the three different times for each group. The same data sets were analyzed for the different times using Re-peated Measures ANOVA followed by the Bonferroni
test. P values < 0.05 were considered signiicant.
Results
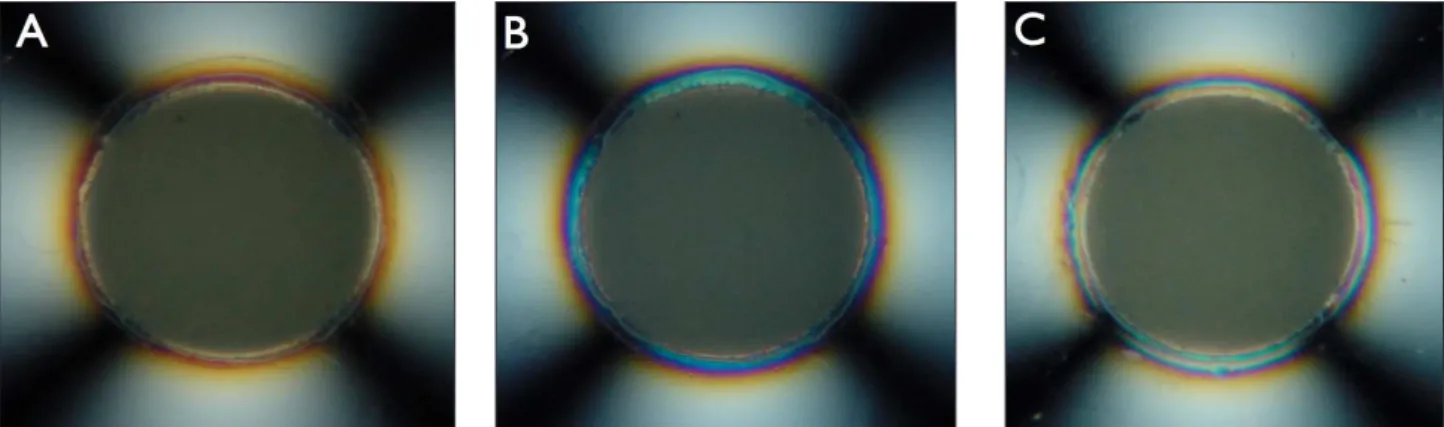
Each rainbow band corresponded to the irst-order
isochromatic fringe and, when monochromatic light was used, each line represented a fringe. The fringe
ap-peared when a ixed amount of deformation occurred
on the photoelastic disc. Thus, the fringes are directly related to the deformations created in the photoelastic resin by the polymerization shrinkage process.
Qualitative analysis
resin showed an orange fringe with some darker areas immediately after photoactivation, characterizing lower stress than in the CQ and CQ/PPD groups. Completely blue fringes were seen at 24 hours, and the beginning of a new fringe formation was observed at 7 days.
Quantitative analysis
Table 2 shows the calculated stress values. No sta-tistical difference between commercial composites was observed upon immediate evaluation (p > 0.05). After 24 hours and 7 days, the Z250 composite showed higher stress than Silorane (p < 0.05). The experimental com-posites were statistically equivalent at all evaluation times (p > 0.05). Stresses evaluated immediately after photoactivation were statistically lower than those after 24 hours and 7 days (p < 0.05), except for the silorane composite. Stresses observed after 24 hours and 7 days did not differ statistically for any composite tested
(p > 0.05).
Discussion
Photoelastic images revealed composite polymeriza-tion shrinkage stress. According to the literature, the resulting volumetric contraction is directed towards the center of the material mass, and the distribution of stress is controlled by free surfaces and bond quality.11 In this
study, the isochromatic fringe pattern was the result of traction forces that the composite induced on the pho-toelastic resin, suggesting that the resulting contraction occurred towards the material center, as previously sug-gested.11
Commercial composites showed lower polymeriza-tion shrinkage stress than experimental composites. The percentage of organic matrix was higher in the experi-mental composites (40 wt.%) than in the Z250 matrix (18 wt.%, according to the manufacturer). Composites Figure 1 - Stress fringes generated by commercial Silorane photoelastic resin immediately after photopolymerization (A) and 24 hours (B) or 7 days (C) later.
with high iller content undergo low volumetric contrac -tion because they have less resin matrix content.3 Com-posites with low iller content and low contraction may
undergo a rapid increase in material stiffness, resulting in high stress values.16
The results of this study conirmed that the com
-posite resin matrix inluences polymerization shrink -age stress. The Silorane composite showed the lowest stress at the three times evaluated. Statistical analysis demonstrated that Silorane and Z250 showed similar re-sults immediately after photopolymerization, but Z250 promoted higher stress than Silorane after 24 hours and 7 days. These two composites mainly differ in the monomer used in the organic matrix. Silorane is com-posed of silorane monomers, whereas Z250 is comcom-posed of dimethacrylate monomers such as GMA, Bis-EMA, and UDMA. Dimethacrylate monomers are po-lymerized by C=C double bond reactions, resulting in decreased space between the chains and consequently an increase in volumetric contraction.5 In contrast, the
cationic ring-opening reactions in silorane materials are responsible for the decreased polymerization stress, generating low stress shrinkage.6
Although there were no statistically signiicant dif
-ferences between experimental composites, qualitative analysis of images suggested that CQ composites gener-ated more stress in photoelastic resin than CQ/PPD or PPD composites immediately after photopolymeriza-tion. This discrepancy between qualitative and
quantita-tive results is probably due to the dificulty in measur
-ing some images to obtain accurate quantitative results. Some monochromatic images did not present clear fringe edges, which may have compromised the opera-tor’s ability to measure isochromatic fringe diameters.
The CQ absorption spectrum ranges from ~400 to
500 nm with an absorption peak at 468 nm, whereas PPD has a relatively wide absorption spectrum with an absorption peak at approximately 392 nm.10 The
spec-trum emitted by LED units produces more energy with-in the CQ absorption spectrum.17 Thus, CQ activation
was probably more eficient, so that the CQ polymeriza
-tion reac-tion was initiated more quickly than the PPD reaction, creating fringes with greater color variation or higher polymerization stress immediately after photo-polymerization. Fringes formed at 24 hours and 7 days were similar for the different initiation systems. Photo-polymerization was performed using a third-generation LED unit with secondary accessory LEDs that emit a second peak of energy at 402 nm. This probably con-tributed to enhanced PPD activation.
Moreover, PPD and CQ reactions are probably initi-ated using different mechanisms. CQ operates predomi-nantly by proton abstraction of the amine hydrogen, whereas PPD can undergo photocleavage and proton
abstraction, which forms free radicals more eficiently.9
Apparently, this had no effect on polymerization stress in this study, because PPD composites and CQ compos-ites generated similar stress values. Thus, it appears that both photoinitiators were able to promote double link conversion; although PPD reduced the reaction veloc-ity, this did not decrease total composite polymerization shrinkage.
Polymerization stress can be reduced without
de-creasing the degree of conversion when the low capac
-ity of the composite is increased.18 In the present study,
this appears to be less apparent in composites with CQ alone. Aside from the slower polymerization rate, other factors such as lower elastic modulus and glass transi-tion temperatures may reduce shrinkage stress.19
The composite with CQ/PPD showed intermediate
Group (Composites)
Time
Immediate 24 hours 7 days
1. Silorane 3.08 (0.09) aA 3.19 (0.10) aA 3.16 (0.10) aA
2. Z250 3.19 (0.13) aA 3.53 (0.15) bB 3.69 (0.10) bB
3. Experimental I 3.64 (0.19) bA 3.84 (0.16) cB 3.87 (0.17) cB 4. Experimental II 3.59 (0.17) bA 3.82 (0.17) cB 3.80 (0.11) cB 5. Experimental III 3.45 (0.11) bA 3.83 (0.19) cB 3.92 (0.13) cB
Values followed by the same lowercase letters in the same column and by the same capital letter in the same row are not significantly different (p > 0.05) as determined by the Bonferroni test.
stress fringes compared with composites with CQ or PPD alone, but the stress values were statistically simi-lar. This probably occurred because the combination of CQ/PPD led to an intermediate polymerization rate at the beginning of the reaction, but to a rate similar to that of CQ and PPD alone at the end of the polymerization process. This result is inconsistent with a previous study reporting a synergistic effect between CQ and PPD,
suggesting that one could expect more eficient use of
photon energy.9
Not all polymerization shrinkage occurs immedi-ately after light activation.20 Our results showed that
stress increased at 24 hours and remained constant at 7 days for all composites except Silorane. The contrac-tion observed after the light source was removed may be attributed to progressive cross-linking reactions that occur after photoactivation was concluded (post-cure), and to thermal contraction due to loss of radiant heat.7
Considering that the light exposure time was similar for all groups, thermal contraction may have occurred for all composites.
Photoelastic analysis was appropriate for evaluating polymerization shrinkage stress. However, the limita-tions of this study include the fact that other relevant aspects of stress development could not be monitored (such as kinetic reactions and polymerization rates), and that the degree of conversion and hardness of ex-perimental composites was not evaluated. Future stud-ies that address these limitations will improve our un-derstanding of polymerization shrinkage using different composites.
Conclusion
Within the limitations of this study, we conclude that polymerization shrinkage stress could be minimized by using silorane-based composites, which may cause less gap formation. Experimental composites containing
PPD showed a slight potential for minimizing polymer-ization shrinkage stress immediately after photoactiva-tion.
Acknowledgments
This report is based on a thesis submitted to the Piracicaba Dental School, State University of
Campi-nas, in partial fulillment of the requirements for the
Master’s degree. This investigation was supported by CAPES (Coordenação de Aperfeiçoamento de Pessoal de Nível Superior) at Piracicaba Dental School, UNI-CAMP.
References
1. Davidson CL, Feilzer AJ. Polymerization shrinkage and polym-erization shrinkage stress in polymer-based restoratives. J Dent. 1997 Nov;25(6):435-40.
2. Davidson CL. Handling the polymerization stresses - Restor-ative Dentistry in resin-based restorRestor-ative materials. Dental News. 2000;VII(IV):9-13.
3. Pearson J, Bouschlicher MR. Polymerization contraction force of packable composites. Gen Dent. 2001 Nov-Dec;49(6):643-7. 4. Ernst CP, Meyer GR, Klocker K, Willershausen B. Determination
of polymerization shrinkage stress by means of a photoelastic investigation. Dent Mater. 2004 May;20(4):313-21.
5. Atai M, Watts DC, Atai Z. Shrinkage strain-rates of dental resin monomer and composite systems. Biomaterials. 2005 Aug;26(24):5015-20.
6. Weinmann W, Thalacker C, Guggenberger R. Siloranes in dental composites. Dent Mater. 2005 Jan;21(1):68-74.
7. Ilie N, Jelen E, Clementino-Luedemann T, Hickel R. Low-shrinkage composite for dental application. Dent Mater J. 2007 Mar;26(2):149-55.
8. Stansbury JW. Curing dental resins and composites by photopo-lymerization. J Esthet Dent. 2000;12(6):300-8.
9. Park Y-J, Chae K-H, Rawls HR. Development of a new photoini-tiation system for dental light-cure composite resins. Dent Mater. 1999 Mar;15(2):120-7.
10. Schneider LFJ, Pfeifer CSC, Consani S, Prahl AS, Ferracane JL. Influence of photoinitiator type on rate of polymerization, degree
of conversion, hardness and yellowing of dental resin composites. Dent Mater. 2008 Sep;24(9):1169-77.
11. Kinomoto Y, Torii M, Takeshige F, Ebisu S. Polymerization con-traction stress of resin composite restorations in a model class I cavity configuration using photoelastic analysis. J Esthet Dent. 2000;12(6):309-19.
12. Ainola L, Aben H. Principal formulas of integrated photoelasticcity in terms of characteristic parameters. J Opt Soc Am A Opt Image Sci Vis. 2005 Jun;22(6):1181-6.
Oc-tober, 23; Cusco, Peru. Cusco: Editora PUCP; 2007. 1-8. Disponível em http://www.congreso.pucp.edu.pe/cibim8/pdf/27/27-05.pdf. 14. Vásquez-Rodríguez JM, Herrera-Franco PJ, Gonzalez-Chi PI. Mi-
Mi-cromechanical analysis of thermoplastic – thermoset interphase. Macromol Symp. 2004 Sep;216(1):117-29.
15. Souza FL, Cleudmar AA. Fotoelasticidade Automatizada Utili-zando Luz Polarizada Elíptica. Horizonte Científico. 2007;1(1):1-13.
16. Braga RR, Ballester RY, Ferracane JL. Factors involved in the de-velopment of polymerization shrinkage stress in resin-composites: a systematic review. Dent Mater. 2005 Oct;21(10):962-70. 17. Ogunyinka A, Palin WM, Shortall AC, Marquis PM.
Photoinitia-tion chemistry affects light transmission and degree of conver-sion of curing experimental dental resin composites. Dent Mater. 2007 Jul;23(7):807-13.
18. Musanje L, Ferracane JL. Effects of resin formulation and nano-filler surface treatment on the properties of experimental hybrid resin composite. Biomaterials. 2004 Aug;25(18):4065-71. 19. Eick JD, Kotha SP, Chappelow CC, Kilway KV, Geise GJ, Glaros
AG, et al. Properties of silorane-based dental resins and com-posites containing a stress-reducing monomer. Dent Mater. 2007 Aug;23(8):1011-7.