pISSN: 0976 3325 eISSN: 2229 6816
National Journal of Community Medicine Vol 2 Issue 3 Oct-Dec 2011 Page 362 ORIGINAL ARTICLE .
SOCIAL CLASS DIFFERENTIATION AND ITS IMPACT ON
QUALITY OF LIFE AMONG DIABETIC PATIENTS
Rohin Rameswarapu1, Trupti N Bodhare2, Samir D Bele2, Sameer Valsangkar3
1Post graduate student, 2Assistant Professor, 3Lecturer, Department of Community Medicine,
Prathima Institute of Medical Sciences, Karimnagar,Andhra Pradesh
Correspondence: Dr. Rohin Rameswarapu
Department of Community Medicine, Prathima Institute of Medical Sciences,
Karimnagar,Andhra Pradesh - 505417
Email: [email protected] Mobile: 9989709604
ABSTRACT
Social class is a significant modifier of quality of life in diabetic patients which we sought to measure in this study. A hospital based, cross sectional descriptive was conducted in diabetic patients using a semi structured questionnaire. A total of 103 diabetic patients consented and participated in the study. The sample consisted of 58 males and 45 females and most respondents had a duration of onset of diabetes between 1-5 yrs (47%). 68 (66%) of the respondents belonged to lower class, 27 (26%) to the middle class and 8 (8%) to the upper class. 92 (89.32%) of the respondents were using oral hypoglycemic agents and 11 (10.68%) used injectable insulin. Socioeconomic status was significant for the number of missed doses (P < 0.04). The mean scores for upper, middle and lower class on the items of financial burden were 3.99 ± 0.906, 3.37 ± 1.079, 3.00 ± 0.756, for general health were 3.49 ± 0.837, 2.96 ± 0.706, 2.63 ± 0.744 and for psychological distress were 3.56 ± 0.835, 2.70 ± 0.609 and 2.75 ± 0.707 respectively. Social class has a significant impact on quality of life and therapy compliance and measures to address this must be undertaken while providing comprehensive healthcare in diabetes for an optimal outcome.
Keywords: Diabetes, quality of life, social classification
INTRODUCTION
According to the World Health Organization there is “an apparent epidemic of diabetes, which strongly related to lifestyle and economic change”. The International Diabetes Federation estimates the total number of diabetic subjects to be around 40.9 million in India and this is further estimated to rise to 69.9 million by the year 2025. [1]
With the advancement in management and prolonging of life in chronic diseases, the quality of life and the healthcare costs in the daily management of such disease takes precedence. While compliance and good quality of life are an ideal for therapeutic end point, several factors belie its achievement.
The rising prevalence of chronic diseases in low and middle income nations has been attributed largely to components of social class, namely literacy, family income and occupation. Available evidence from developed countries indicates that the burden of chronic diseases and their risk factors are predominantly
concentrated among the economically poor. [2, 3]
The poor appear to be disproportionately burdened with the risk factors associated with these diseases. People of lower social class are also at a greatest risk for non compliance, lack of adequate access to healthcare and preventive care. [4]
pISSN: 0976 3325 eISSN: 2229 6816
National Journal of Community Medicine Vol 2 Issue 3 Oct-Dec 2011 Page 363
and value systems in which they live and in relation to their goals, expectations, standards
and concerns”. [5] The concept of health related
quality of life and its determinants have evolved since the 1980s to encompass those aspects of overall quality of life that can be clearly shown to affect health either physical or mental. [6 -8] In addition, health related quality of life assessment has gained recognition as an important research tool for evaluating the impact of new medical treatments and health care services for people with diabetes. [9, 10]
This study explores the impact factors like literacy, family income and education on the quality of life of diabetics thereby enabling a measure of comparison of the effectiveness of healthcare provided.
MATERIALS AND METHODS
A cross sectional descriptive study was conducted among diabetic patients attending outpatient department in hospital of Prathima Institute of Medical Sciences, Karimnagar. The study was conducted over a period of three months. A semi structured questionnaire was administered via a face to face interview and responses were recorded by the interviewer. Informed consent was obtained from the participants and confidentiality was assured.
The questionnaire consisted of five parts, 1) Socio-demographic information 2) Diabetes specific information including duration since initial diagnosis and nature of therapy 3) Compliance with diabetic therapy 4) Quality of life
Socio-demographic information collected included the age and gender of the respondents. Socio-economic classification was done based
the Kuppuswamy classification [11] based on
education, occupation and total family monthly income. Respondents were then classified into three classes of socio-economic status, upper class, middle class which included upper and lower middle class and lower class which included upper lower and lower class.
Diabetes specific information including duration since initial diagnosis and nature of therapy, whether the respondents were using oral hypoglycemic drugs or injectable insulin was obtained. Compliance with therapy was evaluated; a patient was considered non complaint with therapy if the patient missed
more than three doses of medication in a week. [12]
Quality of life was measured using a 8 item questionnaire which included questions relating to general health, activity limitation, financial burden, pain and discomfort, energy and vitality, emotional functioning, psychological distress and social functioning. Responses graded from 0 to 4 on a Likert scale with higher scores indicating poor quality of life.
Data entry and statistical analysis was done in PASW (SPSS) software, version 18. Statistical methods used included means, measure of dispersion, proportions, confidence intervals, chi square test.
RESULTS
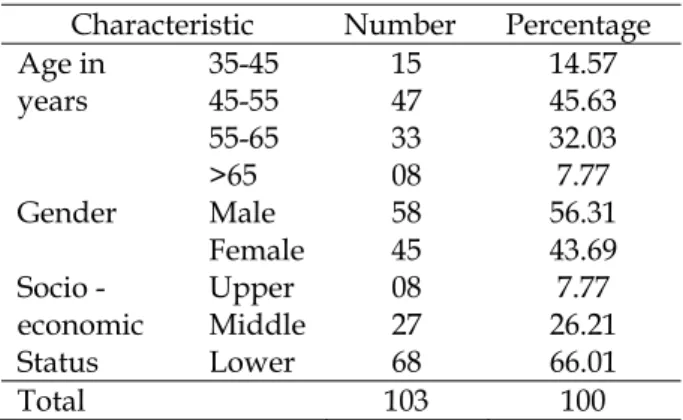
A total of 103 respondents consented and participated in the study. The sample consisted of 58 (56.31%) men and 45 (43.69%) women. 47 (45.63%) of the respondents were aged between 45 – 55 years, followed by 33 (32.03%) in the age group of 55 – 65 years, 15 (14.57%) in the age group of 35 – 45 years and 8 (7.77%) aged above 65 years. 68 (66.01%) belonged to the lower socio-economic class, 27 (26.21%) to the middle class and 8 (7.77%) belonged to the upper socio-economic class. These socio-demographic characteristics are depicted in table 1.
Table 1: Sociodemographic characteristics of Study Population
Characteristic Number Percentage
Age in years
35-45 15 14.57
45-55 47 45.63
55-65 33 32.03
>65 08 7.77
Gender Male 58 56.31
Female 45 43.69
Socio -economic Status
Upper 08 7.77
Middle 27 26.21
Lower 68 66.01
Total 103 100
pISSN: 0976 3325 eISSN: 2229 6816
National Journal of Community Medicine Vol 2 Issue 3 Oct-Dec 2011 Page 364
injectable insulin. The clinical characteristics of respondents are reported in table 2.
Table 2: Clinical characteristics of Study Population
Characteristic Number Percentage
Drugs OHA 92 89.32
Insulin 11 10.68 Duration in
years
< 1 11 10.68
1-5 49 47.57
5-10 35 33.99
>10 8 7.77
Total 103 100
In the lower class, 40 respondents were complaint with therapy whereas 28 were not. In the middle class, 22 and 5 were complaint and non complaint respectively. In the upper class, 7 and one respondents were complaint and non complaint respectively. Socioeconomic status was significant for the number of missed doses
(Yates corrected X2 = 6.137, P < 0.04). The
association between compliance and socio-economic status in presented in table 3.
Table 3: SES v/s drug compliance
Characteristics Compliant Non compliant
Lower class 40 28
Middle class 22 05
Upper class 07 01
Total 69 34
Yates corrected X2 = 6.137 p value < 0.04
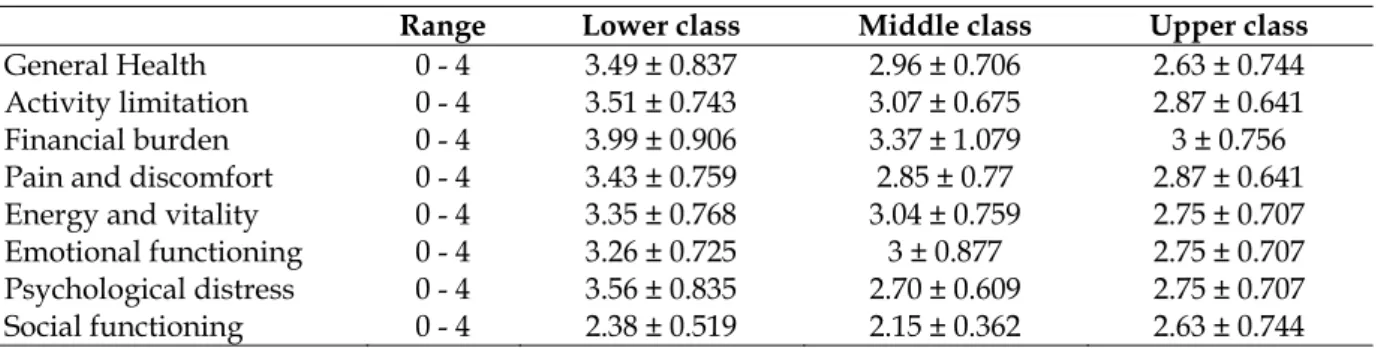
Quality of life was measured on a 8 item questionnaire and the most affected domains when compared across socioeconomic status were financial burden, general health and psychosocial burden. The mean scores for upper, middle and lower class on the items of financial burden were 3.99 ± 0.906, 3.37 ± 1.079, 3.00 ± 0.756, for general health were 3.49 ± 0.837, 2.96 ± 0.706, 2.63 ± 0.744 and for psychological distress were 3.56 ± 0.835, 2.70 ± 0.609 and 2.75 ± 0.707 respectively. The quality of life scores are depicted in table 4.
Table 4: SES versus quality of life
Range Lower class Middle class Upper class
General Health 0 - 4 3.49 ± 0.837 2.96 ± 0.706 2.63 ± 0.744
Activity limitation 0 - 4 3.51 ± 0.743 3.07 ± 0.675 2.87 ± 0.641
Financial burden 0 - 4 3.99 ± 0.906 3.37 ± 1.079 3 ± 0.756
Pain and discomfort 0 - 4 3.43 ± 0.759 2.85 ± 0.77 2.87 ± 0.641
Energy and vitality 0 - 4 3.35 ± 0.768 3.04 ± 0.759 2.75 ± 0.707
Emotional functioning 0 - 4 3.26 ± 0.725 3 ± 0.877 2.75 ± 0.707
Psychological distress 0 - 4 3.56 ± 0.835 2.70 ± 0.609 2.75 ± 0.707
Social functioning 0 - 4 2.38 ± 0.519 2.15 ± 0.362 2.63 ± 0.744
DISCUSSION
Quality of life is a direct measure of the impact of healthcare services and provision of treatment which is more relevant with increased life expectancy in diabetic people due to newer methods of management. It helps us assess the overall impact of the disease and enables a comparison of the ability to cope with disease. The measurement of quality of life is multi-factorial and factors affecting disease also affect quality of life. Social class is a strong determinant of both occurrence of disease and quality of life in diabetes. In comparable methods of treatment, the impact of social class on the disease and the burden on quality of life can be measured.
In our current study, most respondents belonged to the age group of 45 – 55 years which is the peak age for the onset of complications of diabetes, had an equitable
distribution of gender and predominantly belonged to lower socio-economic class. Most respondents had duration since initial diagnosis of 5 to 10 years. This socio-demographic distribution reflects the occurrence of disease in India and has been seen in larger studies such as
the study by Mohan et al [13] who measured the
prevalence of diabetes and metabolic syndrome in South India.
The study measured the nature of therapy, whether oral hypoglycemic drugs or injectable insulin and compliance with therapy. People in the lower socio-economic strata are more likely to be non complaint towards treatment as evidenced in the study. These finding are
similar to the findings by Kalyango et al, [12]
Oladele et al [14] and Piette et al [3] who also
pISSN: 0976 3325 eISSN: 2229 6816
National Journal of Community Medicine Vol 2 Issue 3 Oct-Dec 2011 Page 365
Elaboration into the causal mechanism of this and an explanation of the numerous variables involved requires further study with a larger sample size in the non complaint group.
The study measured quality of life over eight domains and the most significantly affected domains were financial burden, general health and psychological distress. In addition, quality of life across all eight domains had a lower mean in the lower socio-economic class when compared to the middle and upper class. Similar impact on quality of life in diabetes varying by the socio-economic status has been
seen in other studies. Larsson et al [15] obtained
lower scorings for physical functioning, general health, vitality and mental health on the domains for quality of life using SF-36 and they also observed more disability and higher complications in patients with lower social class
and educational level. Hassan et al [16] studied
the role of socioeconomic status, quality of life, and glycemic control in diabetic patients and found that quality of life deteriorated with socioeconomic status and non- compliance and poorer diabetic control. Chronic diseases such as diabetes have a varying effect on quality of life which is dependent on the social class of the patient which needs to be addressed in primary intervention for the disease.
CONCLUSION
Social class has a significant impact on quality of life and therapy compliance and measures to address this must be undertaken while providing comprehensive healthcare in diabetes for an optimal outcome.
LIMITATIONS
Quality of life measures were obtained through an oral questionnaire and only the subjective perception of the sample respondents was sought.
Cost analysis of the prescriptions in the diabetic regimens which would have added to the strength of the study with comparisons of the social class, average drug expenditure and compliance, was not performed due to incomplete availability of prescriptions and lack of manpower.
REFERENCES
1. Sicree R, Shaw J, Zimmet P. Diabetes and impaired glucose tolerance. In: Gan D, editor. Diabetes Atlas. International Diabetes Federation. 3rd ed. Belgium: International Diabetes Federation; 2006. p. 15-103. 2. Health inequalities: Europe in profile. An independent
expert report commissioned by and published under the auspices of the United Kingdom Presidency of the European Union. Available at: http://www.ec.europa.eu/health/ph_determinants/s
ocio_economics/documents/ev_060302_rd06_en.pdf, Accessed October 12th, 2008.
3. Piette JD, Wagner TH, Potter MB, Schillinger D: Health insurance status, cost-related medication underuse, and outcomes among diabetes patients in three systems of care. Med care. 2004; 42: 102-9.
4. Kim HY, Yun WJ, Shin MH, Kweon SS, Ahn HR, Choi SW, Lee YH, Cho DH, Rhee JA. Management of diabetic mellitus in low-income rural patients. J Prev Med Public Health. 2009 ;42:315-22.
5. The WHOQOL Group. The World Health Organization Quality of Life Assessment (WHOQOL). Development and psychometric properties. Soc Sci Med 1998;46:1569-1585.
6. McHorney CA. Health status assessment methods for adults: past accomplishments and future directions. Annual Rev Public Health 1999; 20:309-35.
7. Selim AJ, Rogers W, Fleishman JA, Qian SX, Fincke BG, Rothendler JA, Kazis LE. Updated U.S. population standard for the Veterans RAND 12-item Health Survey (VR-12). Qual Life Res. 2009;18:43-52.
8. Testa MA, Simonson DC: Health economic benefits and quality of life during improved glycemic control in patients with type 2 diabetes mellitus: a randomized, controlled, double-blind trial. JAMA 280:1490-96, 1998. 9. Andersson PO, Wikby A, Stenstrom U, Hornquist JO:
Pen injection and change in metabolic control and quality of life in insulin dependent diabetes mellitus. Diabetes Res Clin Pract 36:169-72, 1997.
10. Hornquist JO, Wikby A, Andersson PO, Dufva AM: Insulin-pen treatment, quality of life and metabolic control: retrospective intra-group evaluations. Diabetes Res Clin Pract 10:221-30, 1990.
11. Kumar N, Shekhar C, Kumar P, Kundu AS. Kuppuswamy's socioeconomic status scale-updating for 2007. Indian J Pediatr. 2007;74:1131-2.
12. Kalyango JN, Owino E, Nambuya AP. Non-adherence to diabetes treatment at Mulago Hospital in Uganda: prevalence and associated factors. Afr Health Sci. 2008 ; 8: 67–73.
13. V. Mohan, S. Shanthirani, R. Deepa, G. Premalatha, N. G. Sastry, R. Saroja. Intra-urban differences in the prevalence of the metabolic syndrome in southern India – the Chennai Urban Population Study. Diabet Med. 2001; 18:280-7.
14. Oladele CR, Barnett E. Racial/Ethnic and social class differences in preventive care practices among persons with diabetes. BMC Public Health 2006, 6:259.
15. Larsson D, Lager I, Nilsson PM. Socio-economic characteristics and quality of life in diabetes mellitus--relation to metabolic control. Scand J Public Health. 1999 ;27:101-5.