1Departamento de Petrologia e Metalogenia, Instituto de Geociências e Ciências Exatas, Universidade Estadual Paulista “Júlio de Mesquita Filho” – UNESP, Rio
Claro (SP), Brazil. E-mails: [email protected], [email protected]
2Instituto de Ciência e Tecnologia, Universidade Federal de Alfenas – UNIFAL, Poços de Caldas (MG), Brazil. E-mail: [email protected]
*Corresponding author
Manuscript ID: 20170086. Received in: 03/28/2017. Approved in: 08/25/2017. ABSTRACT: We studied 30 samples from 10 mining fronts of clayish rocks of the Corumbataí Formation, in the region of the San-ta Gertrudes Ceramic Pole (São Paulo, Brazil), in order to evaluate the variation of rare earth elements (REE), mineralogy, weathering efects and provenance. he proiles show diagnostic geochemical sig-natures that are uniform across the Corumbataí Formation samples in the studied region and can be correlated from mine to mine, i.e.: 1) the constant MgO/K2O ratio and the variation of other oxides, which allow the identiication of three main groups of samples; 2) si-milar groups of chemical index of weathering (CIW) and chemical index of alteration (CIA); 3) the immobile character of REE, h, and Sc. he erosion/denudation processes were apparently the same among the studied proiles, allowing the identiication of a similar weathering pattern among the mines, despite its location within the stratigraphic column. Mineralogical and geochemical data here re-ported suggest a dominant felsic source, but intermediate or mixed sources cannot be discarded. he chemical and mineralogical aspects observed are practically uniform along the studied proiles and mi-nes, which allow them to be used as raw material by the industries of the Santa Gertrudes Ceramic Pole (SGCP) region.
KEYWORDS: weathering; remobilization; sedimentary rocks; geo-chemistry; Paraná Basin; ceramic.
RESUMO: Foram analisadas 30 amostras de 10 frentes de lavra sobre rochas argilosas da Formação Corumbataí, na região do Polo Cerâmico de Santa Gertrudes (São Paulo, Brazil), visando avaliar a variação de elementos terras raras (ETRs), mineralogia, efeitos do intemperismo e proveniência. Os peris apresentam assinaturas geoquímicas carac-terísticas que são uniformes nas amostras da Formação Corumbataí na região de estudo e que são correlacionáveis entre as minas, isto é: 1) a razão constante de MgO/K2O e a variação de outros óxidos, o que permite o reconhecimento de três grupos principais de amostras; 2) grupos similares de índices químico de intempéries (CIW) e químico de alteração (CIA); 3) o caráter imóvel de ETRs, h e Sc. Os proces-sos de erosão/denudação aparentemente foram os mesmos entre os peris estudados, permitindo a identiicação de um padrão de intemperismo similar entre as minas, independentemente de sua localização na col-una estratigráica. Os dados mineralógicos e geoquímico aqui apresen-tados sugerem uma fonte dominantemente félsica, porém fontes inter-mediárias ou mistas não podem ser descartadas. Os aspectos químicos e mineralógicos observados são praticamente uniformes ao longo dos peris e minas, o que permite sua utilização como matéria-prima para as indústrias da região do polo cerâmico.
PALAVRAS-CHAVE: intemperismo; remobilização; rochas sedi-mentares; geoquímica; Bacia do Paraná; cerâmica.
Major and trace elements redistribution
in weathered claystones from the
Corumbataí Formation, Paraná
Sedimentary Basin, São Paulo, Brazil
Redistribuição de elementos maiores e traços em
argilitos intemperizados da Formação Corumbataí,
Bacia Sedimentar do Paraná, São Paulo, Brasil
Letícia Hirata Godoy1*, Diego de Souza Sardinha2,
Maria Margarita Torres Moreno1
INTRODUCTION
he Santa Gertrudes Ceramic Pole (SGCP), located in São Paulo State, approximately 180 km from the capital, is the biggest ceramic center in Latin America. he raw material utilized by the ceramic industries in the region is considered great when compared to other sedimentary rocks, since its natural properties allow achieving good quality products in relatively low temperatures with the use of dry milling pro-cess, therefore reducing the energetic costs (Azzi et al. 2016). he raw material is inserted in the geological context of Paraná Sedimentary Basin, a typically intracratonic basin, which is illed by sedimentary and basic igneous rocks, whose age varies from Late Ordovician to Late Cretaceus (Fúlfaro & Bjornberg 1983; Milani et al. 1994).
In the region of the SGCP and vicinities, the lithostrati-graphy of the Paraná Sedimentary Basin is represented by four main units, i.e., Itararé Group, Guatá Group (Tatuí Formation), Passa Dois Group (Irati and Corumbataí formations), and São Bento Group (Piramboia, Botucatu and Serra Geral forma-tions), from Late Carboniferous to Early Cretaceous, respecti-vely. he raw material encompasses the Corumbataí Formation sedimentary rocks, whose lower and upper contacts are with Irati and Piramboia formations respectively, locally afected by the basic igneous dykes of the Serra Geral Formation.
he raw material exhibits distinctive physical-chemical characteristics due to heterogeneity as a result of geological processes that lead to rock consolidation and weathering pro-cesses. he mineralogy of the claystones from Corumbataí Formation is dominantly composed by illitic clays, but chlo-rite, smectite and sometimes kaolinite are common too, this last one in the upper levels. Also, quartz, carbonate, hematite, feldspar (mostly sodic), analcime and others, in minor propor-tions, occur along (Moreno et al. 2009; Moreno et al. 2014). he Corumbataí Formation claystones in the studied region present a practically constant MgO/K2O ratio along with SiO2 increase, which constitutes a particularity that can be used to identify/select the raw materials from the wea-thering proiles in order to control the composition of the ceramic masses and inal products, as previously indicated by Moreno et al. (2014).
In this paper, we address four relevant questions inhe-rited from previous geochemical studies, by evaluating the mineralogy and chemical composition of major and trace elements, including the rare earth elements (REE), of 10 mining fronts:
1. Do the proiles show ingerprints that can be correlated from mine to mine?
2. In which conditions the claystones were afected by wea-thering processes and how the elements are remobilized and concentrated throughout the proiles and mines?
3. How the erosion/denudation afected the Santa Gertrudes Ceramic Pole (SGCP) weathered claystones?
4. How many sources supply sediment to the system, and how did these sources afect the characteristics of the raw material used in the SGCP?
METHODS
Several ield works were performed in order to collect information about rock type, structures, soil proiles, avai-lability and mode of occurrence of the clay ore, as well as photos and samples from all mines.
he samples, extracted with an auger, constitute the repre-sentative and homogenized material that occurs in one bench of the respective mining front. he numerical sequence of samples within a single proile increases from lower to upper portions. he samples were dried in a mule furnace with a constant temperature of 60ºC for 24 hours and dry milled in a hammer mill (Servitech, Santa Catarina, Brazil) coupled with a 1 mm sieve, in order to achieve a better homogenization.
he mineralogical analysis by X-Ray Difractometry (XRD; Siemens/Bruker D5000, Wisconsin, USA) was mea-sured with a copper radiation (WL = 1,542Å) and a nickel ilter in a 2θ range of 3 to 65º. he goniometer velocity was
set in 3º (2θ) per minute, and an exposure time of 1 second
for each 0,05º step was set. he analysis was performed in four conditions: total sample; natural ine fraction; ine frac-tion treated with ethylene glycol; and ine fracfrac-tion after ire at 500ºC for 4 hours (hiry et al. 2013). he difractograms were analyzed in the X’Pert High Score Plus software.
he chemical analyses of major and trace elements, inclu-ding REE, were performed in Acme Labs (Canada) with an inductively coupled plasma mass spectrometer (ICP-MS), using 0.2 g of sample and the lithium metaborate/tetra-borate fusion and diluted nitric acid digestion technique. Binary and ternary variation diagrams were elaborated from this data, in order to understand the distribution of trace elements, including REE, in the study area as a whole and along each proile in diferent mining fronts.
STUDY AREA
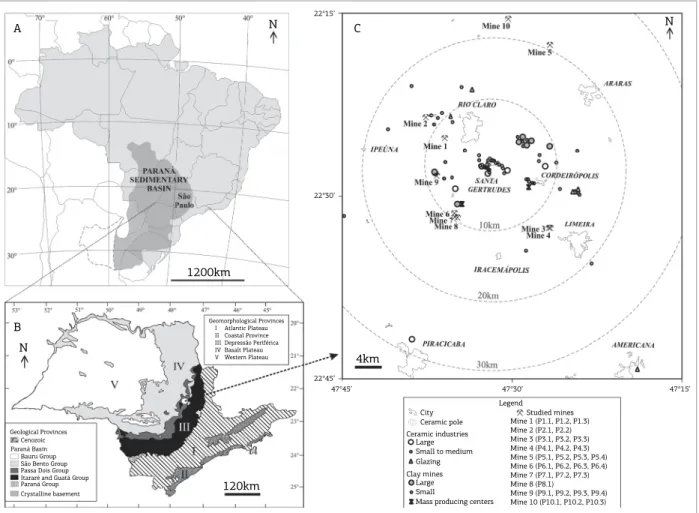
Figure 1. Location of the Paraná Basin in South America (A), simpliied map with general geological and geomorphological features in São Paulo State (B) and the sampling site location within SGCP (C). Modiied: Zálan et al. (1990), Penteado (1976) and Costa (2006).
Formation and were originated in a shallow marine envi-ronment transitioning to a luvial-lacustrine continental environment (Milani et al. 1994). Basic igneous dikes of the
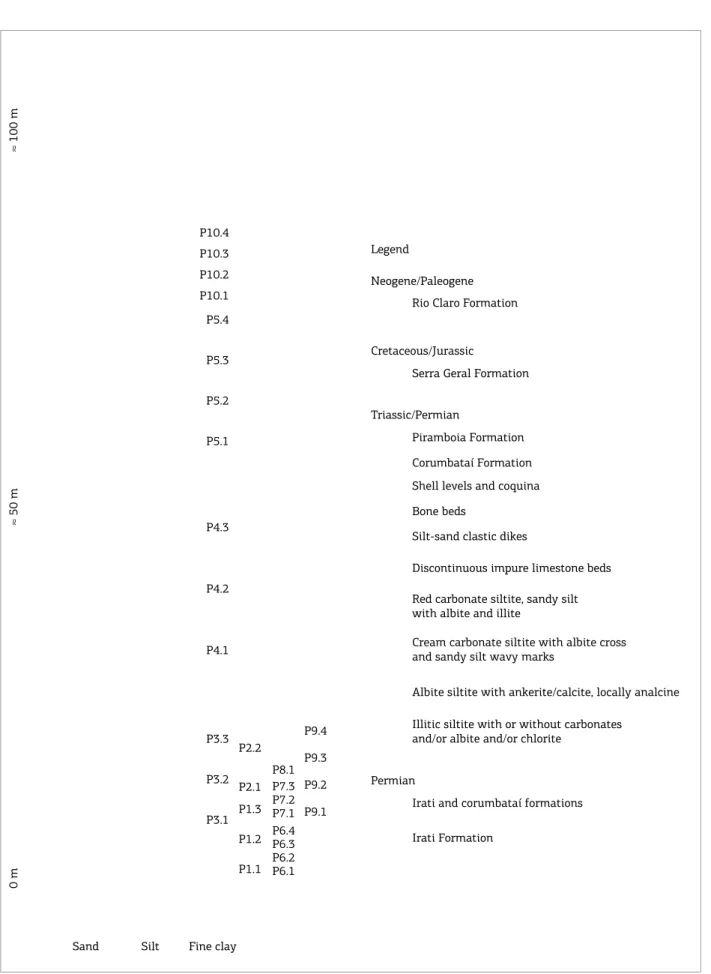
Serra Geral Formation are related to a magmatic province that feature lows and intrusions of tholeitic basalts (White 1908). Zanardo et al. (2016) suggest that the Corumbataí Formation was subjected to thermal efect after lithiica-tion, promoted by these dikes, which lead to mineralogy transformations, hydrothermal alteration and formation of hydraulic breccias (Fig. 2).
he stratigraphy of the Corumbataí Formation presen-ted in Figure 2, according to Zanardo et al. (2016), can be divided into ive mineralogical-textural levels that are composed predominantly by clayey siltstones interbedded with sandy siltstones, consisting of illite, quartz, feldspars, carbonates, hematite, montmorillonite, chlorite and zeoli-tes, of authigenic and/or detrital origin, within a maximum thickness of 130 m.
P1 mine corresponds to the bottom portion of Corumbataí Formation and it is characterized by plastic
material in high amounts throughout the mine, even in the basal strata. Although P2 mine is close to P1 mine, it has diferent characteristics since it is located within the inter-mediate to upper portions of the Corumbataí Formation stratigraphic column, in which there are high amounts of carbonates in some of its layers.
P3 and P4 mines begin in the bottom portion of Irati Formation and extent to the intermediate portion of Corumbataí Formation, both with intense weathered claystones in their upper portions. P5 mine correlates to the upper portion of P3 and P4 mines.
P6, P7 and P8 mines are positioned in the bottom por-tion of the Corumbataí Formapor-tion, however they cover a much less portion of the stratigraphic column, since they do not present the upper portion seen in P3 and P4 mines. Also, in these mines clays there is more plastic and they pre-sent pronounced weathering alteration characteristics in the upper layers, next to the contact with Rio Claro Formation.
P9 mine has four distinct strata, with only the middle layer of the proile representing the extracted volume for
N A
B
C N
N
1200km
120km
4km
Geomorphological Provinces I Atlantic Plateau II Coastal Province III Depressão Periférica IV Basalt Plateau V Western Plateau
Geological Provinces Cenozoic Paraná Basin Bauru Group São Bento Group Passa Dois Group Itararé and Guatá Group Paraná Group Crystalline basement
22°15’
22°30’
22°45’
47°30’
47°45’ 47°15’
Legend
Studied mines City
Ceramic pole Ceramic industries
Clay mines Large Small to medium Glazing Large Small
Mass producing centers
Mine 1 (P1.1, P1.2, P1.3) Mine 2 (P2.1, P2.2) Mine 3 (P3.1, P3.2, P3.3) Mine 4 (P4.1, P4.2, P4.3) Mine 5 (P5.1, P5.2, P5.3, P5.4) Mine 6 (P6.1, P6.2, P6.3, P6.4) Mine 7 (P7.1, P7.2, P7.3) Mine 8 (P8.1)
Figure 2. Schematic representation of the Corumbataí Formation in the SGCP region, with studied mines and its stratigraphic position. Modiied: Zanardo et al. (2016). Mine 1 (P1.1, P1.2, P1.3); Mine 2 (P2.1, P2.2); Mine 3 (P3.1, P3.2, P3.3); Mine 4 (P4.1, P4.2, P4.3); Mine 5 (P5.1, P5.2, P5.3, P5.4); Mine 6 (P6.1, P6.2, P6.3, P6.4); Mine 7 (P7.1, P7.2, P7.3); Mine 8 (P8.1); Mine 9 (P9.1, P9.2, P9.3, P9.4) and Mine 10 (P10.1, P10.2, P10.3).
≈
100 m
≈
50 m
0 m
Sand Silt Fine clay
Legend
Neogene/Paleogene
Rio Claro Formation
Cretaceous/Jurassic
Serra Geral Formation
Triassic/Permian
Piramboia Formation
Permian
Irati and corumbataí formations
Irati Formation Corumbataí Formation
Shell levels and coquina
Bone beds
Silt-sand clastic dikes
Discontinuous impure limestone beds
Red carbonate siltite, sandy silt with albite and illite
Cream carbonate siltite with albite cross and sandy silt wavy marks
Albite siltite with ankerite/calcite, locally analcine
Illitic siltite with or without carbonates and/or albite and/or chlorite
P10.4
P10.3
P10.2
P10.1
P5.4
P5.3
P5.2
P5.1
P4.3
P4.2
P4.1
P2.2
P2.1
P1.3
P1.2
P1.1 P3.3
P3.2
P3.1
P8.1 P7.3 P7.2 P7.1
P9.4
P9.3
P9.2
ceramic masses, the upper weathered and plastic clayish material being discarded and the bottom portion materials used in low percentage.
P10 mine is considered an especial occurrence among the studied mines since it is characterized by prominent amou-nts of carbonates, partially resembling P2 mine, and being situated in the upper portion of the Corumbataí Formation stratigraphic column.
MINERALOGY
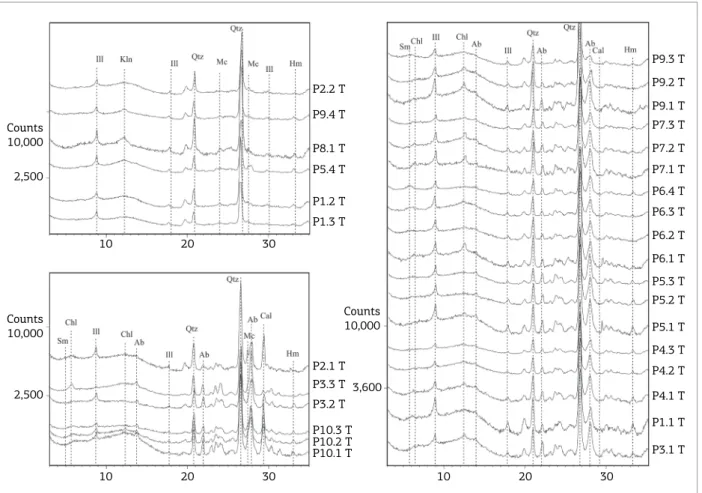
Illite, quartz and feldspar (albite and/or microcline) are the main minerals (Fig. 3) and three groups of sam-ples were identiied according to their mineralogy. he irst group (G1) has the highest calcite content and low amou-nts of microcline. In the second group (G2), the quantity of calcite decreases and a marked content of albite appe-ars. he third group (G3) is marked by the presence of kaolinite, a feature that distinguishes this group from the other two ones.
he decrease in calcite amounts towards upper samples can be attributed to weathering efects that causes its disin-tegration. he highest amounts of albite in G2 interfere with microcline relections by hiding them, but their pre-sence cannot be discarded since they reappear in the upper samples, most likely because weathering efects disintegrates albite, which allows the observation of microcline relections. he increased amounts of kaolinite towards the upper sam-ples of the proiles possibly indicate that they were neofor-med, therefore relecting a more advanced weathering state of these samples.
Chlorite occurs in samples from the bottom portion of the proiles (Fig. 3; samples in G1; P3.1, and P4.1, in G2) as indicative of the intense relections compared to the upper samples (Fig. 3; P5; P6; P7; P9; all in G2). he amounts of chlorite in upper portion samples can be attributed to the weathering reactions that intensely afec-ted the surface samples.
he weathering efect in quartz and albite is less evi-dent among the samples of each proile since they are pre-sent in similar amounts along the proiles. Only in G3, the
Figure 3. Difractograms for each mine proile. Where: T, total sample; Ill, illite; Kln, kaolinite; Sm, smectite; Chl, chlorite; Qtz, quartz; Mc, microcline; Ab, albite; Cal, calcite; Hm, hematite.
Counts 10,000
P3.3 T P2.2 T
P9.4 T
P8.1 T
P5.4 T
P1.2 T
P1.3 T
P2.1 T
P3.2 T
P10.3 T P10.2 T P10.1 T
3,600 Counts
10,000
Counts 10,000 2,500
P9.3 T
P9.2 T
P9.1 T
P7.3 T
P7.2 T
P7.1 T
P6.4 T
P6.3 T
P6.2 T
P6.1 T
P5.3 T P5.2 T
P5.1 T
P4.2 T
P1.1 T
P3.1 T P4.1 T P4.3 T
10 20 30
10 20 30 10 20 30
relections of albite show a decrease in intensity, which makes the relections of microcline visible (Fig. 3).
Mines 6 and 7 show similar mineralogy, composed by illite, smectite, chlorite, quartz and albite, and, although Mine 8 is very close to these mines in space, it presents kao-linite and absence of smectite/chlorite in the upper level of the proile, which indicates that Mine 8 is more weathered than mines 6 and 7.
In Mine 10 the samples present a particular mineralogy, with calcite being the main mineral, noted by the increased amounts and well-deined relections in Fig. 3 (G1).
WHOLE-ROCK GEOCHEMISTRY
he results of major and trace elements analyses for the studied samples are listed in Table 1, as well as the com-positions of the Upper Crust (UC, Taylor & McLennan 1985), Average Post-Archean Australian Shale (PAAS, Taylor & McLennan 1985) and Average North American Shale Composite (NASC, Gromet et al. 1984, Taylor & McLennan 1985) for comparison.
he SiO2 content varies from 55.3 to 70.3%, with the average value of 64.8%, among the studied mines. Along each
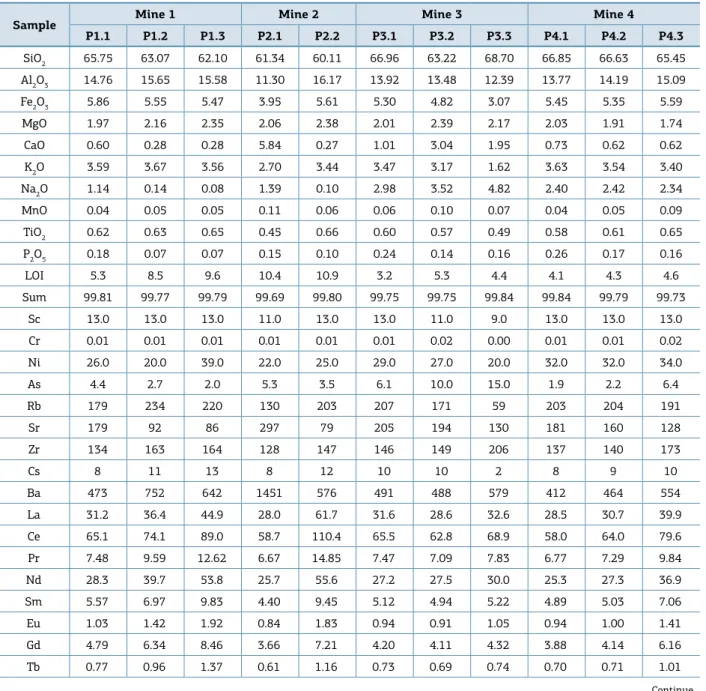
Table 1. Chemical composition of major elements as wt% and trace elements in ppm. Total Fe as Fe2O3, major and
minor elements in % and trace elements in ppm, UC (data from Taylor & McLennan 1985), PAAS (data from Taylor & McLennan 1985) and NASC (data from Gromet et al. 1984 and Taylor & McLennan 1985).
Sample Mine 1 Mine 2 Mine 3 Mine 4
P1.1 P1.2 P1.3 P2.1 P2.2 P3.1 P3.2 P3.3 P4.1 P4.2 P4.3
SiO2 65.75 63.07 62.10 61.34 60.11 66.96 63.22 68.70 66.85 66.63 65.45
Al2O3 14.76 15.65 15.58 11.30 16.17 13.92 13.48 12.39 13.77 14.19 15.09
Fe2O3 5.86 5.55 5.47 3.95 5.61 5.30 4.82 3.07 5.45 5.35 5.59
MgO 1.97 2.16 2.35 2.06 2.38 2.01 2.39 2.17 2.03 1.91 1.74
CaO 0.60 0.28 0.28 5.84 0.27 1.01 3.04 1.95 0.73 0.62 0.62
K2O 3.59 3.67 3.56 2.70 3.44 3.47 3.17 1.62 3.63 3.54 3.40
Na2O 1.14 0.14 0.08 1.39 0.10 2.98 3.52 4.82 2.40 2.42 2.34
MnO 0.04 0.05 0.05 0.11 0.06 0.06 0.10 0.07 0.04 0.05 0.09
TiO2 0.62 0.63 0.65 0.45 0.66 0.60 0.57 0.49 0.58 0.61 0.65
P2O5 0.18 0.07 0.07 0.15 0.10 0.24 0.14 0.16 0.26 0.17 0.16
LOI 5.3 8.5 9.6 10.4 10.9 3.2 5.3 4.4 4.1 4.3 4.6
Sum 99.81 99.77 99.79 99.69 99.80 99.75 99.75 99.84 99.84 99.79 99.73
Sc 13.0 13.0 13.0 11.0 13.0 13.0 11.0 9.0 13.0 13.0 13.0
Cr 0.01 0.01 0.01 0.01 0.01 0.01 0.02 0.00 0.01 0.01 0.02
Ni 26.0 20.0 39.0 22.0 25.0 29.0 27.0 20.0 32.0 32.0 34.0
As 4.4 2.7 2.0 5.3 3.5 6.1 10.0 15.0 1.9 2.2 6.4
Rb 179 234 220 130 203 207 171 59 203 204 191
Sr 179 92 86 297 79 205 194 130 181 160 128
Zr 134 163 164 128 147 146 149 206 137 140 173
Cs 8 11 13 8 12 10 10 2 8 9 10
Ba 473 752 642 1451 576 491 488 579 412 464 554
La 31.2 36.4 44.9 28.0 61.7 31.6 28.6 32.6 28.5 30.7 39.9
Ce 65.1 74.1 89.0 58.7 110.4 65.5 62.8 68.9 58.0 64.0 79.6
Pr 7.48 9.59 12.62 6.67 14.85 7.47 7.09 7.83 6.77 7.29 9.84
Nd 28.3 39.7 53.8 25.7 55.6 27.2 27.5 30.0 25.3 27.3 36.9
Sm 5.57 6.97 9.83 4.40 9.45 5.12 4.94 5.22 4.89 5.03 7.06
Eu 1.03 1.42 1.92 0.84 1.83 0.94 0.91 1.05 0.94 1.00 1.41
Gd 4.79 6.34 8.46 3.66 7.21 4.20 4.11 4.32 3.88 4.14 6.16
Tb 0.77 0.96 1.37 0.61 1.16 0.73 0.69 0.74 0.70 0.71 1.01
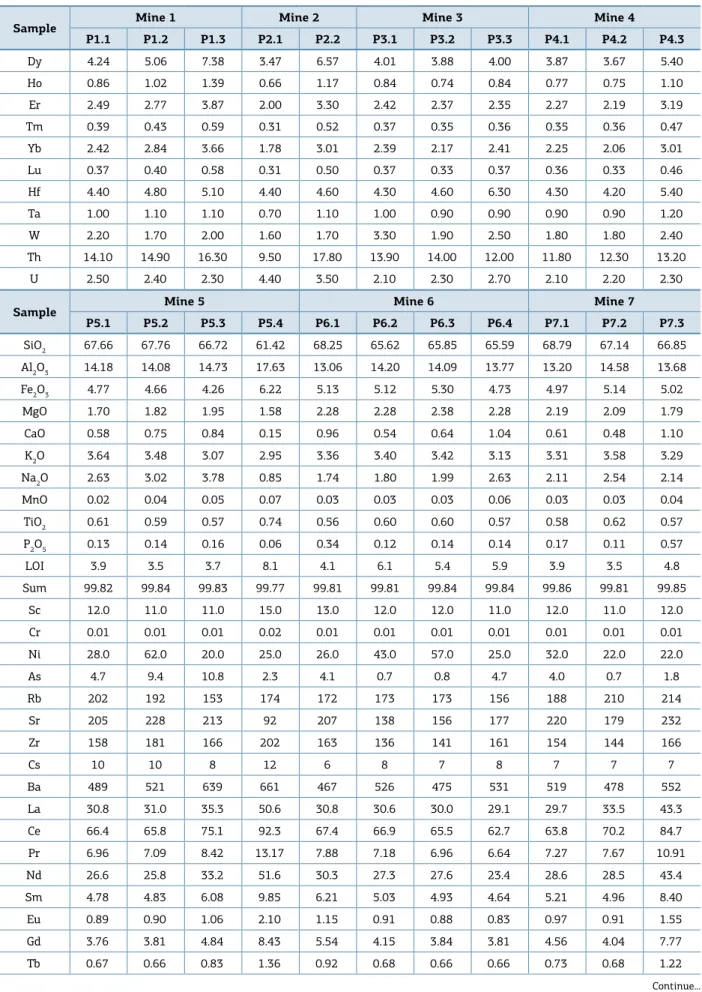
Table 1. Continuation.
Sample Mine 1 Mine 2 Mine 3 Mine 4
P1.1 P1.2 P1.3 P2.1 P2.2 P3.1 P3.2 P3.3 P4.1 P4.2 P4.3
Dy 4.24 5.06 7.38 3.47 6.57 4.01 3.88 4.00 3.87 3.67 5.40
Ho 0.86 1.02 1.39 0.66 1.17 0.84 0.74 0.84 0.77 0.75 1.10
Er 2.49 2.77 3.87 2.00 3.30 2.42 2.37 2.35 2.27 2.19 3.19
Tm 0.39 0.43 0.59 0.31 0.52 0.37 0.35 0.36 0.35 0.36 0.47
Yb 2.42 2.84 3.66 1.78 3.01 2.39 2.17 2.41 2.25 2.06 3.01
Lu 0.37 0.40 0.58 0.31 0.50 0.37 0.33 0.37 0.36 0.33 0.46
Hf 4.40 4.80 5.10 4.40 4.60 4.30 4.60 6.30 4.30 4.20 5.40
Ta 1.00 1.10 1.10 0.70 1.10 1.00 0.90 0.90 0.90 0.90 1.20
W 2.20 1.70 2.00 1.60 1.70 3.30 1.90 2.50 1.80 1.80 2.40
Th 14.10 14.90 16.30 9.50 17.80 13.90 14.00 12.00 11.80 12.30 13.20
U 2.50 2.40 2.30 4.40 3.50 2.10 2.30 2.70 2.10 2.20 2.30
Continue...
Sample Mine 5 Mine 6 Mine 7
P5.1 P5.2 P5.3 P5.4 P6.1 P6.2 P6.3 P6.4 P7.1 P7.2 P7.3
SiO2 67.66 67.76 66.72 61.42 68.25 65.62 65.85 65.59 68.79 67.14 66.85
Al2O3 14.18 14.08 14.73 17.63 13.06 14.20 14.09 13.77 13.20 14.58 13.68
Fe2O3 4.77 4.66 4.26 6.22 5.13 5.12 5.30 4.73 4.97 5.14 5.02
MgO 1.70 1.82 1.95 1.58 2.28 2.28 2.38 2.28 2.19 2.09 1.79
CaO 0.58 0.75 0.84 0.15 0.96 0.54 0.64 1.04 0.61 0.48 1.10
K2O 3.64 3.48 3.07 2.95 3.36 3.40 3.42 3.13 3.31 3.58 3.29
Na2O 2.63 3.02 3.78 0.85 1.74 1.80 1.99 2.63 2.11 2.54 2.14
MnO 0.02 0.04 0.05 0.07 0.03 0.03 0.03 0.06 0.03 0.03 0.04
TiO2 0.61 0.59 0.57 0.74 0.56 0.60 0.60 0.57 0.58 0.62 0.57
P2O5 0.13 0.14 0.16 0.06 0.34 0.12 0.14 0.14 0.17 0.11 0.57
LOI 3.9 3.5 3.7 8.1 4.1 6.1 5.4 5.9 3.9 3.5 4.8
Sum 99.82 99.84 99.83 99.77 99.81 99.81 99.84 99.84 99.86 99.81 99.85
Sc 12.0 11.0 11.0 15.0 13.0 12.0 12.0 11.0 12.0 11.0 12.0
Cr 0.01 0.01 0.01 0.02 0.01 0.01 0.01 0.01 0.01 0.01 0.01
Ni 28.0 62.0 20.0 25.0 26.0 43.0 57.0 25.0 32.0 22.0 22.0
As 4.7 9.4 10.8 2.3 4.1 0.7 0.8 4.7 4.0 0.7 1.8
Rb 202 192 153 174 172 173 173 156 188 210 214
Sr 205 228 213 92 207 138 156 177 220 179 232
Zr 158 181 166 202 163 136 141 161 154 144 166
Cs 10 10 8 12 6 8 7 8 7 7 7
Ba 489 521 639 661 467 526 475 531 519 478 552
La 30.8 31.0 35.3 50.6 30.8 30.6 30.0 29.1 29.7 33.5 43.3
Ce 66.4 65.8 75.1 92.3 67.4 66.9 65.5 62.7 63.8 70.2 84.7
Pr 6.96 7.09 8.42 13.17 7.88 7.18 6.96 6.64 7.27 7.67 10.91
Nd 26.6 25.8 33.2 51.6 30.3 27.3 27.6 23.4 28.6 28.5 43.4
Sm 4.78 4.83 6.08 9.85 6.21 5.03 4.93 4.64 5.21 4.96 8.40
Eu 0.89 0.90 1.06 2.10 1.15 0.91 0.88 0.83 0.97 0.91 1.55
Gd 3.76 3.81 4.84 8.43 5.54 4.15 3.84 3.81 4.56 4.04 7.77
Sample Mine 5 Mine 6 Mine 7
P5.1 P5.2 P5.3 P5.4 P6.1 P6.2 P6.3 P6.4 P7.1 P7.2 P7.3
Dy 3.52 3.64 4.39 7.08 4.75 3.64 3.57 3.70 4.09 3.70 6.80
Ho 0.74 0.76 0.88 1.41 0.93 0.79 0.69 0.75 0.85 0.74 1.35
Er 2.31 2.23 2.65 3.93 2.67 2.20 2.27 2.29 2.38 2.25 3.73
Tm 0.34 0.35 0.42 0.61 0.40 0.33 0.33 0.35 0.37 0.37 0.56
Yb 2.45 2.25 2.39 3.82 2.57 2.16 2.17 2.11 2.50 2.28 3.39
Lu 0.36 0.36 0.38 0.57 0.37 0.33 0.33 0.34 0.37 0.34 0.50
Hf 4.50 5.50 4.50 6.00 4.80 4.00 4.20 4.40 4.30 4.50 4.40
Ta 0.90 1.00 1.10 1.30 0.90 1.10 1.00 1.00 0.90 1.10 1.00
W 1.50 1.70 2.50 3.30 2.30 1.80 2.20 1.90 2.80 1.80 2.10
Th 12.90 13.40 17.90 15.70 11.80 14.10 13.50 12.10 14.30 14.30 14.20
U 2.90 2.70 2.80 3.60 2.30 2.40 2.50 2.30 2.30 2.30 3.00
Continue...
Table 1. Continuation.
Sample Mine 8 Mine 9 Mine 10 UC NASC PAAS
P8.1 P9.1 P9.2 P9.3 P9.4 P10.1 P10.2 P10.3
SiO2 67.44 70.32 68.16 63.15 63.51 55.32 61.34 63.30 66.00 64.80 62.80
Al2O3 15.19 12.83 13.51 14.71 15.89 9.74 12.27 11.45 15.20 16.90 18.90
Fe2O3 5.69 4.99 5.05 5.64 6.78 2.96 4.39 3.79 5.00 5.65 7.22
MgO 1.14 2.18 2.17 1.99 1.53 1.77 3.28 2.13 2.20 2.86 2.20
CaO 0.05 0.67 0.79 0.41 0.16 12.63 4.78 5.52 4.20 3.63 1.30
K2O 2.28 3.11 3.34 3.73 3.08 1.86 3.31 2.27 3.40 3.97 3.70
Na2O 0.09 2.15 1.48 0.83 0.09 3.19 2.74 2.92 3.90 1.14 1.20
MnO 0.03 0.03 0.04 0.06 0.06 0.15 0.08 0.08 0.08 0.06 0.11
TiO2 0.65 0.57 0.58 0.63 0.67 0.39 0.51 0.47 0.50 0.70 1.00
P2O5 0.10 0.09 0.34 0.08 0.07 0.14 0.21 0.13 - 0.13 0.16
LOI 7.2 2.9 4.4 8.6 8.0 11.7 6.9 7.8 - - 6.00
Sum 99.86 99.84 99.86 99.83 99.84 99.85 99.81 99.86 99.84 100.48 104.59
Sc 14.0 11.0 11.0 13.0 14.0 9.0 10.0 8.0 10.0 14.9 16.0
Cr 0.01 0.01 0.01 0.01 0.01 0.00 0.01 0.01 35 125 110
Ni 20.0 20.0 24.0 30.0 35.0 20.0 20.0 20.0 20.0 58.0 55.0
As 2.1 6.3 1.5 3.3 0.5 3.7 14.9 9.6 28.4
-Rb 185 169 191 231 231 91 166 96 110 125 160
Sr 60 215 241 147 118 323 274 230 350 142 200
Zr 161 146 151 149 160 161 152 176 240 200 210
Cs 7 7 8 9 9 5 8 5 4 5 15
Ba 353 472 504 611 535 602 588 655 700 636 650
La 47.8 29.6 32.7 35.4 40.4 31.1 29.0 30.0 30.0 31.1 38.2
Ce 98.5 64.3 67.9 71.7 79.9 62.4 61.5 60.5 64.0 67.033 79.6
Pr 11.15 6.97 8.09 8.23 10.10 7.23 7.16 7.16 7.10 8.83
Nd 42.8 27.3 32.6 31.6 41.0 27.2 28.1 27.9 26.0 30.4 33.9
Sm 6.75 4.88 6.21 5.49 8.42 4.92 5.13 5.25 4.50 5.98 5.55
Eu 1.20 0.89 1.14 0.98 1.79 0.93 0.98 1.03 0.88 1.253 1.08
Gd 5.27 4.23 5.52 4.71 11.12 4.21 4.43 5.03 3.80 5.5 4.66
Sample Mine 8 Mine 9 Mine 10 UC NASC PAAS
P8.1 P9.1 P9.2 P9.3 P9.4 P10.1 P10.2 P10.3
Dy 4.77 3.77 5.06 4.33 12.28 4.01 3.69 4.68 3.50 5.54 4.68
Ho 0.92 0.75 0.99 0.85 2.77 0.81 0.78 1.04 0.80 0.99
Er 2.63 2.15 2.84 2.48 7.61 2.50 2.31 2.99 2.30 3.275 2.85
Tm 0.42 0.34 0.44 0.40 1.09 0.39 0.35 0.44 0.33 0.41
Yb 2.74 2.28 2.72 2.53 6.41 2.81 2.24 2.81 2.20 3.113 2.82
Lu 0.41 0.34 0.41 0.38 0.94 0.43 0.33 0.41 0.32 0.456 0.43
Hf 4.80 4.30 4.40 4.60 4.60 4.70 4.70 5.10 5.8 6.3
-Ta 1.10 1.10 1.00 1.10 1.10 0.70 0.90 0.80 - 1.1 14.60
W 2.00 4.90 2.00 2.10 2.20 2.30 2.40 2.20 - 2.1
-Th 14.10 13.80 13.30 15.60 16.00 11.30 11.80 11.60 10.5 12.3 3.10
U 2.40 2.40 2.80 3.00 2.70 3.50 7.00 5.30 2.5 2.66
-UC: Upper Crust; PAAS: Average Post-Archaean Australian Shale; NASC: Average North American Shale Composite.
Table 1. Continuation.
proile, these values slightly decrease from lower to upper levels. he SiO2 content in the samples is attributed mainly to the presence of clay minerals, plagioclase and quartz and it varies according to the evolution of the weathering hydrolyses reactions. he smallest contents of this oxide are found in the carbonated samples from Mine 10, in which the CaO content increases.
he CaO has the same behavior as SiO2 of lower values in the upper levels, 0.1 to 12.6% and the average of 1.8%. he decreased content is consequence of the dissolution of calcite that occurs as an interstitial diagenetic mineral within the Corumbataí Formation claystones.
he Al2O3 has between 9.7 and 17.6% with the average of 13.8% among the mines. Along the proiles, the Al2O3 con-tent presents an opposite behavior when compared to SiO2 in consequence of Si to be more mobile than Al2O3. Fe2O3 and TiO2 oxides and the loss on ignition (LOI) also increase upward and vary between 2.7 to 6.8% (4.9% average), 0.4 to 0.7% (0.6% average) and 2.9 to 13.7% (6.4 average), respectively.
he MgO and K2O content are practically constant towards the upper levels. he average concentrations are 2.2% (1.1 to 4.4%) and 3.2% (1.6 to 3.8%), respectively. he constant con-tent of these two elements along the proiles is consequence of neoformation of smectite and illite that imprison Mg and K when dolomite was solubilized. he minor variation in the MgO/K2O ratios when compared to SiO2 constitutes an excellent intrinsic feature that can be used for the selection of raw materials from the Corumbataí Formation for ceramic purposes, as previously pointed out by Moreno et al. (2014).
he Na2O, MnO and P2O5 occur in minor proportions and vary along the proiles according to the presence of these ele-ments in minor minerals such as plagioclase (albite), or as minor element substitutions, i.e., Mn in calcite and P in clay minerals.
Figure 4. Ternary diagram of the (Al2O3)/(CaO+Na2O)/
(K2O) oxides, in molecular proportions, for the
sedimentary samples (Nesbitt and Young, 1982, 1984 and 1989), in comparison to the Upper Crust (UC, data from Taylor and McLennan, 1985), Average Post-Archaean Australian Shale (PAAS, data from Taylor and McLennan, 1985) and Average North American Shale Composite (N ASC, data from Gromet et al., 1984 and Taylor and McLennan, 1985).
PAAS: Average Post-Archean Australian Shale; NASC: Average North American Shale Composite; UC: Upper Crust.
Samples PAAS NASC UC Weathering trend
CaO+Na2O K2O
Al2O3 Kaolinite
Muscovite
K-feldspar Plagioclase
Smectite Illite
PAAS sediments, the irst one as the least weathered represen-tative and the last one as the most weathered one, respectively, according to the plotted data in Figure 4. hus, the samples can be divided into three main groups, following the com-positions of UC (G1), NASC and PAAS (G2) and one of an advanced weathering condition (G3), as shown in Figure 4.
he greater amounts of albite (Fig. 3), in (G1) indicate the immaturity of the sediments from the lower portion of Mine 2, Mine 3 and Mine 10. G2 corresponds to samples with intermediate (NASC composition) to relative advan-ced weathering state (PAAS composition).
he advanced weathering trend (G3) is marked by an increase in the relative contents of Al2O3, while the CaO and Na2O content decreases and is represented by the upper samples of Mines 1, 2, 8 and 9. In these samples, the rela-tive increase in Al2O3 is in accordance to the neoformation of kaolinite, as seen in Fig. 3.
he chemical index of weathering (CIW) and chemical index of alteration (CIA) (Harnois 1988, Nesbitt & Young, 1982) are calculated for all the samples and both show simi-lar patterns (Tab. 2 and Fig. 5) that correlate to the obser-vations made in the A-CN-K diagram. he highest values
UC: Upper Crust; PAAS: Average Post-Archaean Australian Shale; NASC: Average North American Shale Composite; CIA: chemical index of alteration; CIW: chemical index of weathering.
Table 2. Chemical indexes calculated for the samples. CIA = [Al2O3 / (Al2O3 + CaO + Na2O + K2O)] × 100 and CIW = [Al2O3 / (Al2O3 + CaO + Na2O)] × 100 in molecular proportions. Eu/Eu* = Eucn/[(Smcn)(Gdcn) and cn: chondrite normalized.
Mines Samples CIA CIW La/Th Th/Sc Eu/Eu* La/Lucn La/Smcn Gd/Lucn
Mine 1
P1.1 76.50 83.24 2.21 1.08 0.61 8.75 3.53 1.61
P1.2 87.13 96.69 2.44 1.15 0.65 9.45 3.29 1.97
P1.3 87.52 97.68 2.75 1.25 0.64 8.04 2.88 1.81
Mine 2 P2.1 66.95 72.48 2.95 0.86 0.64 9.38 4.01 1.47
P2.2 87.25 97.23 3.47 1.37 0.68 12.81 4.11 1.79
Mine 3
P3.1 59.28 63.55 2.27 1.07 0.62 8.87 3.89 1.41
P3.2 53.50 57.11 2.04 1.27 0.62 9.00 3.65 1.55
P3.3 36.33 38.57 2.72 1.33 0.68 9.15 3.93 1.45
Mine 4
P4.1 64.34 69.07 2.42 0.91 0.66 8.22 3.67 1.34
P4.2 63.46 68.41 2.50 0.95 0.67 9.66 3.84 1.56
P4.3 64.48 69.70 3.02 1.02 0.65 9.00 3.56 1.66
Mine 5
P5.1 59.40 64.29 2.39 1.08 0.64 8.88 4.06 1.30
P5.2 56.08 60.36 2.31 1.22 0.64 8.94 4.04 1.32
P5.3 49.19 52.66 1.97 1.63 0.60 9.64 3.66 1.58
P5.4 78.93 87.11 3.22 1.05 0.70 9.21 3.23 1.84
Mine 6
P6.1 68.77 74.35 2.61 0.91 0.60 8.64 3.12 1.86
P6.2 67.81 73.67 2.17 1.18 0.61 9.63 3.83 1.56
P6.3 66.92 72.40 2.22 1.13 0.62 9.44 3.83 1.45
P6.4 59.20 63.75 2.40 1.10 0.60 8.88 3.95 1.39
Mine 7
P7.1 64.63 69.90 2.08 1.19 0.61 8.33 3.59 1.53
P7.2 61.70 66.67 2.34 1.30 0.62 10.23 4.25 1.48
P7.3 64.61 69.72 3.05 1.18 0.59 8.99 3.25 1.93
Mine 8 P8.1 88.08 97.93 3.39 1.01 0.62 12.10 4.46 1.60
Mine 9
P9.1 64.47 69.60 3.05 0.19 0.60 9.04 3.82 1.55
P9.2 70.63 76.86 2.53 1.29 0.60 8.28 3.32 1.67
P9.3 78.77 86.37 2.57 1.25 0.59 9.67 4.06 1.54
P9.4 89.21 97.84 3.04 1.21 0.57 4.46 3.02 1.47
Mine 10
P10.1 44.25 46.98 3.84 1.01 0.62 7.51 3.98 1.22
P10.2 56.87 60.89 1.96 1.48 0.63 9.12 3.56 1.67
P10.3 52.20 55.82 2.65 1.26 0.61 7.60 3.60 1.52
UC - - 2.62 0.91 0.65 9.73 4.20 1.48
NASC - - 2.80 1.07 0.67 - - 1.50
Figure 5. Chemical Index of Weathering, CIW = [(Al2O3)/(Al2O3+CaO+Na2O)] * 100 and Chemical Index of Alteration,
CIA = [(Al2O3)/(Al2O3+ CaO + Na2O + K2O)] * 100 for the studied samples. Harnois (1988) and Nesbitt and Young (1982).
Chemical index of alterarion = 100*(Al2O3)/(Al2O3 + CaO + Na2O + K2O) Chemical index of weathering (CIW) = 100*(Al2O3)/(Al2O3+CaO+Na2O) 100
90
80
70
60
50
40
30
20
10
P1.1 P1.2 P1.3 P2.1 P2.2 P3.1 P3.2 P3.3 P4.1 P4.2 P4.3 P5.1 P5.2 P5.3 P5.4 P6.1 P6.2 P6.3 P6.4 P7.1 P7.2 P7.3 P9.2 P9.3 P9.4
P10.1 P10.2 P10.3 P8.1 P9.1
0
for CIW and CIA, of 94 ± 5 and 85 ± 4, respectively,
cor-respond to the samples located in the advanced weathering trend (Fig. 4), i.e., upper portion (surface) samples from
Mines 1, 2, 8 and 9.
he indexes do not show any signiicant changes along both Mine 4 and 7 and stay practically constant with ave-rage CIW and CIA values of 69 ± 1 and 64 ± 1, for Mine 4,
respectively, and 69 ± 2 and 64 ± 2, for Mine 7, respectively.
hus, in these mines little alteration due to water iniltra-tion and lixiviainiltra-tion, or even by hydrotermalism processes, has occurred.
In Mines 1, 2, 9 and 10 (P10.1, P10.2, P10.3), the CIW and CIA indexes increase from the lower portion towards the upper portion of the proiles, in a range of 65 ± 15 to
84 ± 20 for CIW and 60 ± 13 to 76 ± 17 for CIA.
he sam-ples from Mines 3 and 6 show a decrease in CIW and CIA indexes towards the upper portion of the proiles, with 63 ± 13 index for CIW and 59 ± 11 for CIA.
he samples from the middle and upper portion of Mine 1, as well as the upper portion samples from Mine 2, Mine 5 and Mine 9, and the sample from Mine 8, show the highest indexes of CIW and CIA, which are associated to an eleva-ted weathering degree. In the other hand, the middle and upper portion samples from Mine 3, middle portion samples from Mine 5 and the samples from Mine 10 show the lowest indexes, due to a smaller weathering degree. he remaining
samples present similar indexes, which indicates the same degree of weathering in the respective proile portions.
he highest and lowest degrees of weathering can be attributed to the coniguration of the proiles within the mines, i.e., lack or presence of a thick surface cover,
respec-tively, depth, time of exposure and local geomorphology, as well as to intrinsic characteristics of these rocks, i.e.,
perme-ability and the amount of fractures that can lead to more or less iniltration of rainwater.
In Mine 10, on the contrary of what happens in other mines, the upper portion of the stratigraphic column is still preserved probably due to a strata subsidence, which pre-vented the carbonates to be weathered and lixiviated from these samples.
Some mines also represent a particular case, as Mines 6 and 7, that are located in the lowest portion of the stratigra-phic column, and Mine 8, which is above the strata, showing because of that an increased weathering index.
he mineralogy in this case isn’t representative for a given range of CIW and CIA and cannot be taken as a guide in the weathering evolution, since rocks with distinct compo-sitions present very similar weathering indexes (e.g., groups of samples with the highest and lowest CIW and CIA), rocks with similar mineral composition show completely diferent weathering indexes (e.g., Mine 5 — P5.2/P5.3
composition more prone to be afected by the weathering efects are in the group of samples with the lowest weathe-ring indexes (i.e., Mine 10, of carbonatic samples, which
would be expected to present the highest indexes). Despite the diferent location of the proiles within the stratigraphic column of the Corumbataí Formation, appa-rently they underwent the same erosion/denudation proces-ses, which lead to a similar evolution in terms of decom-position and neoformation of clay minerals, in addition to leaching and concentration of particular elements, allowing the recognition of a weathering pattern between the pro-iles and mines.
In Mine 10, located in the upper portion of the Corumbataí Formation stratigraphic column, a downward displacement of rock strata prevented the carbonates to be weathered and lixiviated from these proile samples as it would be expected to happen since they are more prone to weather than silicates, therefore being preserved and resul-ting in the lowest weathering indexes.
TRACE ELEMENT GEOCHEMISTRY
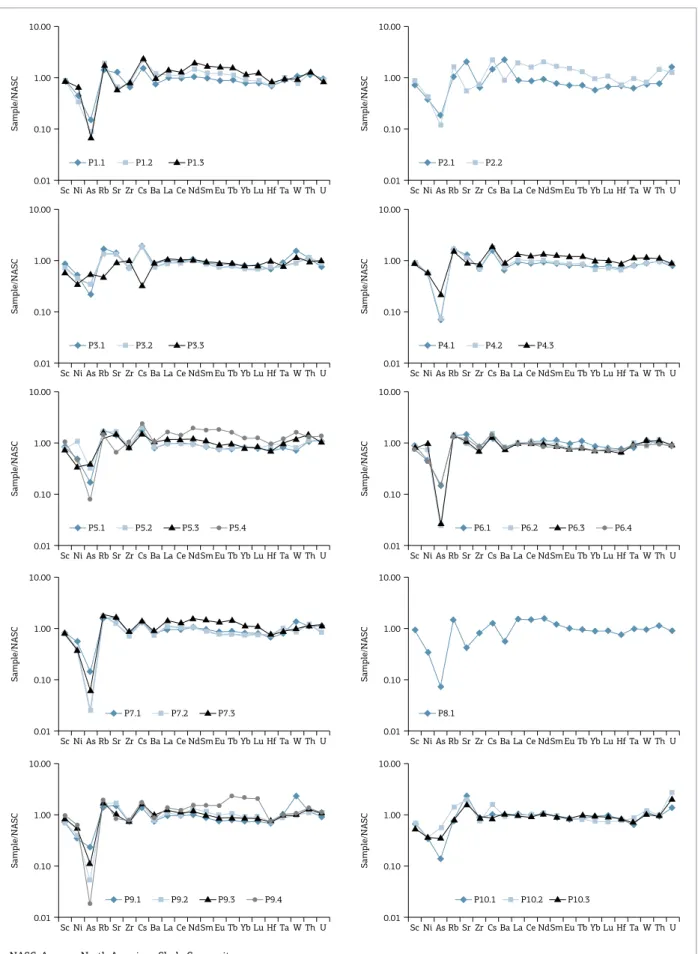
he trace elements composition of the samples, including REE, is listed in Table 1. he normalized data (by NASC from Gromet et al. 1984 and Taylor & McLennan 1985; and by C1 chondrites, Evensen et al. 1978) were plotted in
dis-tribution diagrams according to each proile (Figs. 6 and 7). he distribution of trace elements in one single proile does not show any signiicant changes from bottom to upper portions, usually with the concentrations of trace elements in the same order of magnitude. hus, in general, all sam-ples present similar distribution patterns (Fig. 6).
he upper sample from Mine 3 presents a negative ano-maly of Cs relative to NASC (Fig. 6), while the bottom and middle samples present a positive anomaly, probably because of its element’s mobile character (low charge and large ionic radius) during the weathering processes, being more easily carried out of the system by the weathering luids.
In Figure 6 one can notice that samples from mines 1, 2, 4, 5, 7 and 9 show an increment in REE elements from bottom to upper portions. he chemical indexes (Eu ano-maly and light/heavy rations) are listed in Table 2. he results can be diferentiated into two main groups in each proile: lower and upper portion samples (Fig. 7).
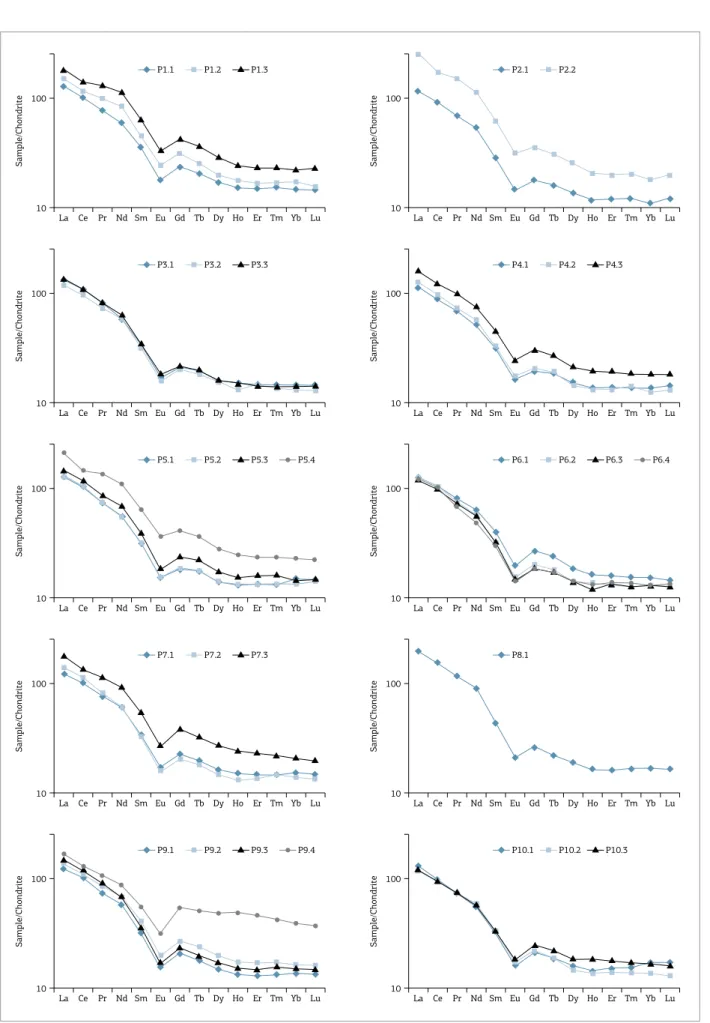
he samples from the lower portion of all mines present a fractionation pattern characterized by a continuous depletion in light REE from La to Sm (La/SmN = 3.77 ± 0.27), followed
by a negative anomaly in Eu (Eu/Eu* = 0.024 ± 0.003) and a
regular decreased distribution of heavy REE from Gd to Yb (Gd/YbN = 1.51 ± 0.14).
The upper portion samples present a similar dis-tribution pattern as described before and REE rations La/ SmN = 3.50 ± 0.58, Eu/Eu* = 0.014 ± 0.003, Gd/Yb
N =
1.72 ± 0.19. However, the concentration of REE in the
upper portion (ΣREE = 857 ppm ± 99) is higher than in
the lower portion (ΣREE = 539 ppm ± 53).
hree of the upper samples present the highest contents in REE (Tab. 1), due to the presence of kaolinite in Mine 9 (P9.4) and Mine 5 (P5.4) and to illite in Mine 2 (P2.2), which can be related to the more advanced weathering state of these samples.
After the analysis of each proile from lower to upper portions, six mining fronts (1, 2, 4, 5, 7 and 9) were iden-tiied featuring a REE concentration increase with progres-sive weathering, i.e., from lower to upper portions (Figs. 7
and 8), probably due to a rapid re-precipitation and loss of major elements that are easily remobilized. In this case, Na and Ca oxides usually present a prominent decrease, while other oxides have a slight decrease or maintain a practically constant amount, like Si, K and Mg, or an increased amount, like Al, Fe, Ti, Mn oxides (Moreno et al. 2014).
As the REE are concentrated in the more weathered strata, the sum of REE in each sample, as seen in Figure 8 (ΣREE vs. samples), shows the weathering degree in each
proile and how they correlate between the mines. In gene-ral, all the upper samples present the highest REE concen-trations, with the upper samples from P1, P2, P5 and P9 presenting the sum of REE in the same order of magnitude. he upper samples of P4, P7 and P8 have correlating values of REE sum. Also, P3, P6 and P10 present corresponding values of REE sum, thus indicating in each case their simi-larity in terms of weathering evolution.
In three mining fronts (3, 6 and 10), no signiicant enrichment in REE was noticed along the proiles (Figs. 7 and 8), so the fractionation patterns remain in the same order of magnitude, thus implying a higher resistance of these rocks to the weathering, due to the depth of the bench within the proile.
As for Mine 3, there are two benches (benches 1 and 2) underneath the bench where sample P3.1 (bench 3) was collected, which are discarded for being highly altered by hydrothermalism and for its high content in smectites. Above the bench in which sample P3.3 was collected (bench 5), on the top of the proile, there is another bench (bench 6), which was discarded because of its advanced weathering state. hus, the three benches of Mine 3 that are used as raw material (P3.1, P3.2 and P3.3) correspond to the middle portion of the mine proile, therefore not presenting signi-icative changes in REE composition.
Figure 6. Trace elements distribution for each mine proile. Data normalized by the Average North American Shale Composite (NASC; from Gromet et al., 1984 and Taylor and McLennan, 1985).
NASC: Average North American Shale Composite.
P1.1 P1.2 P1.3
Sample/NASC
10.00
1.00
0.10
0.01
Sc Ni As Rb Sr Zr Cs Ba La Ce NdSm Eu Tb Yb Lu Hf Ta W Th U
P3.1 P3.2 P3.3
Sample/NASC
10.00
1.00
0.10
0.01
Sc Ni As Rb Sr Zr Cs Ba La Ce NdSm Eu Tb Yb Lu Hf Ta W Th U
Sample/NASC
10.00
1.00
0.10
0.01
P7.1 P7.2 P7.3
Sc Ni As Rb Sr Zr Cs Ba La Ce NdSm Eu Tb Yb Lu Hf Ta W Th U
Sample/NASC
10.00
1.00
0.10
0.01
P5.1 P5.2 P5.3 P5.4
Sc Ni As Rb Sr Zr Cs Ba La Ce NdSm Eu Tb Yb Lu Hf Ta W Th U
Sample/NASC
10.00
1.00
0.10
0.01
P9.1 P9.2 P9.3 P9.4
Sc Ni As Rb Sr Zr Cs Ba La Ce NdSm Eu Tb Yb Lu Hf Ta W Th U
P2.1 P2.2
Sample/NASC
10.00
1.00
0.10
0.01
Sc Ni As Rb Sr Zr Cs Ba La Ce NdSm Eu Tb Yb Lu Hf Ta W Th U
P4.1 P4.2 P4.3
Sample/NASC
10.00
1.00
0.10
0.01
Sc Ni As Rb Sr Zr Cs Ba La Ce NdSm Eu Tb Yb Lu Hf Ta W Th U
Sample/NASC
10.00
1.00
0.10
0.01
P8.1
Sc Ni As Rb Sr Zr Cs Ba La Ce NdSm Eu Tb Yb Lu Hf Ta W Th U
Sample/NASC
10.00
1.00
0.10
0.01
P6.1 P6.2 P6.3 P6.4
Sc Ni As Rb Sr Zr Cs Ba La Ce NdSm Eu Tb Yb Lu Hf Ta W Th U
Sample/NASC
10.00
1.00
0.10
0.01
P10.1 P10.2 P10.3
Figure 7. REE patterns for each mine proile. Data normalized by the C1 Chondrite (Evensen et al., 1978).
Sample/Chondrite
100
10
La Ce Pr Nd Sm Eu Gd Tb Dy Ho Er Tm Yb Lu
P1.1 P1.2 P1.3
Sample/Chondrite
100
10
La Ce Pr Nd Sm Eu Gd Tb Dy Ho Er Tm Yb Lu P2.1 P2.2
Sample/Chondrite
100
10
La Ce Pr Nd Sm Eu Gd Tb Dy Ho Er Tm Yb Lu
P3.1 P3.2 P3.3
Sample/Chondrite
100
10
La Ce Pr Nd Sm Eu Gd Tb Dy Ho Er Tm Yb Lu
P4.1 P4.2 P4.3
Sample/Chondrite
100
10
La Ce Pr Nd Sm Eu Gd Tb Dy Ho Er Tm Yb Lu
P5.1 P5.2 P5.3 P5.4
Sample/Chondrite
100
10
La Ce Pr Nd Sm Eu Gd Tb Dy Ho Er Tm Yb Lu
P6.1 P6.2 P6.3 P6.4
Sample/Chondrite
100
10
La Ce Pr Nd Sm Eu Gd Tb Dy Ho Er Tm Yb Lu
P7.1 P7.2 P7.3
Sample/Chondrite
100
10
La Ce Pr Nd Sm Eu Gd Tb Dy Ho Er Tm Yb Lu P8.1
Sample/Chondrite
100
10
La Ce Pr Nd Sm Eu Gd Tb Dy Ho Er Tm Yb Lu
P9.1 P9.2 P9.3 P9.4
Sample/Chondrite
100
10
Figure 8. ΣREE vs. samples. The diagram shows the concentration increase in the upper portion of each proile, with the exception of Mines 3, 6 and 10 where no signiicant changes in REE composition occurs.
ΣREE: rare earth elements.
1,000.0
Σ REE 900.0
800.0
700.0
600.0
500.0
400.0
300.0
200.0
100.0
P1.1 P1.2 P1.3 P2.1 P2.2 P3.1 P3.2 P3.3 P4.1 P4.2 P4.3 P5.1 P5.2 P5.3 P5.4 P6.1 P6.2 P6.3 P6.4 P7.1 P7.2 P7.3 P8.1 P9.1 P9.2 P9.3 P9.4 P10.1 P10.2 P10.3 0.0
in heavy REE (Gd-Lu) when compared to the upper samples (P6.2, P6.3 and P6.4), whose fractionation patterns remain close together in the same order of magnitude. It indicates that in this front a loss of heavy REE occurs, probably due to a preferential transport of these elements because of its stability and low precipitation rates (Formoso et al. 1989).
PROVENANCE
According to the classiication diagram of terrigenous sands-tones and shales using log (Fe2O3/K2O) vs. log (SiO2/ Al2O3) (Herron 1988) and the discriminant function diagram for the provenance signatures of sandstone/mudstone suites using major elements (Roser & Korsch 1988), the bottom, there-fore less weathered, samples of each proile, can be classiied as wacke (Fig. 9A), mostly of quartzose sedimentary prove-nance, with the bottom sample of Mine 10 plotting in the intermediate igneous provenance ield (Fig. 9B).
However, the REE and high ield strength elements (HFSE) are the elements more suitable for provenance analy-sis due to the relative more immobile character during wea-thering, transport, diagenesis and metamorphism. Ratios of both incompatible and compatible elements, such as La/Sc, h/Sc, Co/h, Cr/h, and Eu/Eu*, in siliciclastic sediments, allow to place constraints on the average provenance compo-sition (Cullers et al. 1988, Cullers 1994a, 1995, Wronkiewicz
& Condie 1987, 1989, 1990, Cox et al. 1995). he geo-chemical diferences between elements such as h and La (indicative of a felsic source) and Sc and Cr (indicative of
Figure 9. (A) Classiication of terrigenous sandstones
and shales using log(Fe2O3/K2O) vs. log (SiO2/Al2O3)
(Herron, 1988). (B) Discriminant function diagram for
the provenance signatures of sandstone/mudstone
suites using major elements (Roser and Korsch, 1988). In both diagrams only the less weathered samples from the bottom portion of the proiles was used.
Fe-shale
Shale
Arkose
Fe-sand
Quartz arenite
Sublitharenite
Litharenite
Wacke Subarkose
A
B
log (F
e2
O3
/K
2
O
Discriminant function 2
Discriminant function 1 2
1
–1
0 0.5 1 1.5 2 2.5
0
log (SiO2/Al2O3)
Felsic igneous
provenance Intermediateigneous provenance
Mafic igneous provenance Quartzose
sedimentary provenance
–8 –9.2–8
0 5.6
8 –4 2
–2–0.60 3.1 8 9
P5.1 P4.1
P6.1 P7.1
P9.1 P1.1 P3.1
P2.1
P10.1
a maic source) have been exploited to distinguish between felsic and maic provenance by various authors (McLennan 1989, McLennan & Taylor 1991, McLennan et al. 1980,
Wronkiewicz & Condie 1990). In addition, the mineralogi-cal maturity of the sediments indicated by the proportion of compositionally mature alumina-rich minerals such as kao-linite has a felsic or reworked sedimentary source (Cullers
et al. 1975, 1987).
As REE patterns of the source rocks may be preserved in sedimentary rocks (Taylor & McLennan 1985, Wronkiewicz & Condie 1987, 1989, Condie et al. 1995, Compton et al.
2003), they were used to infer the source of the SGCP samples. he clayish sedimentary rocks of SGCP present light rare-earth elements (LREEs) enrichment with a high La/ SmN ratio, a negative Eu anomaly and an almost lat heavy rare earth elements (HREE) pattern with a low Gd/ YbN ratio. hese REE patterns are compatible with a more silicic rock source, since they present higher LREE/ HREE ratios and negative anomalies, instead of low LREE/HREE ratios and no Eu anomalies presented by basic rock sources (Cullers & Graf 1983). he negative Eu anomaly is regarded as evidence for a diferentiated source, similar to granite, as pointed out by McLennan (1989), McLennan et al. (1993) and Taylor and
McLennan (1985, 1995).
he La and h elements present an immobile character and are more abundant in felsic than basic rocks, whereas Sc and Co are more concentrated in basic rocks than in felsic rocks (Taylor & McLennan 1985, Wronkiewicz & Condie 1987, Condie et al. 1995). he h/Sc and La/h rations
of 1.12 ± 0.24 and 2.57 ± 0.50, respectively, were used to
evaluate the provenance of the samples (Fig. 10). In the h/ Sc and La/h diagrams the samples scatter next to the h/Sc = 1 and La/h = 2.8 lines, which correspond to the upper conti-nental crust (UC) values, plus all samples present Sc contents below 15 ppm indicate a more felsic component.
In the La-h-Sc diagram (Fig. 11) that discriminates fel-sic and bafel-sic provenance of ine grained sedimentary rocks (Cullers 1994a, 1994b), the majority of samples fall in a region that indicates a predominant felsic source, which does not discard an intermediate source or a mix of felsic and basic source materials.
Despite intense weathering, shown in Figures 4 and 5 and previously discussed, which afected the contents of most elements, the REE, h, and Sc apparently remai-ned immobile, allowing the recognition of the source
Figure 10. Incompatible elements plot for the studied samples. Th versus Sc, where Th/Sc = 1 ratio is that of the Upper Crust. La versus Th, where La/Th = 2.8 ratio is that of Upper Crust (data from Taylor and McLennan, 1985).
Th/Sc = 10
Sc (ppm) Th (ppm)
Th (ppm)
0 10
50
40
30
20
10
0
20 30 40 50 60 0 10
160
140 120 100
80 60 40
20
0
20 30 40 50
Th/Sc = 1
La/Th = 10 La/Th = 2.8
La/Th = 1
La (ppm)
Th/Sc = 0.6
Figure 11. Ternary plot of La-Th-Sc for the Corumbataí Formation samples ater Cullers (1994). The Upper Crust (UC; Taylor and McLennan, 1985), Average Post-Archean Australian Shale (PAAS; Taylor and McLennan, 1985) and Average North American Shale Composite (NASC; Gromet et al., 1984 and Taylor and McLennan, 1985) are plotted for comparisons.
PAAS: Average Post-Archean Australian Shale; NASC: Average North American Shale Composite; UC: Upper Crust.
La (100 ppm)
Th (100 ppm)
Sc (100 ppm) typical granitic
gneiss sources clay, silt, sand, and gravel from
mixed sources
metabasic sources
clay, silt, and sand from amphibolite source
amphibolite source Samples
area composition. Also, the slight diferences among the REE patterns probably do not relect changes in source area composition, but are likely due to variations in mineralogy and weathering (Nyakairu & Koeberl 2001, Mahjoor et al. 2009).
CONCLUSIONS
We analyzed 30 samples from 10 mining fronts of clayish rocks of the Corumbataí Formation, in the region of the SGCP (São Paulo, Brazil), in order to determine their mineralogical and chemical compositions, REE characte-ristics, weathering trends and provenance. XRD analysis shows that the sedimentary rocks are mainly composed by illite, quartz and albite, being diferentiated by the content of other clayish minerals as kaolinite and smectite, or by the presence of minor minerals such as calcite, microcline, hematite and/or chlorite.
he studied proiles from the Corumbataí Formation in the SGCP region show diagnostic geochemical signatures that can be correlated from mine to mine, i.e., the constant MgO/K2O ratio (consequence of smectite and illite neofor-mation) and the variation of other major and minor oxides concentrations, the recognition of three main groups of samples that follow the compositions of UC (G1), NASC and PAAS (G2) and one of an advanced weathering con-dition (G3), the similar groups of CIW and CIA and the immobile character of REE, h, and Sc.
he claystones of the SGCP region were intensely afec-ted by the weathering processes, which remobilized alkali and alkali earth elements towards the upper portion of each mine proile and re-precipitated and/or relatively concentra-ted REE in the uppermost samples of the studied proiles. he erosion/denudation processes were apparently the same among the studied proiles from the SGCP region, allowing the recognition of a similar weathering pattern among the mines, despite its location within the stratigra-phic column of the Corumbataí Formation. A downward displacement of rock strata was especially important, since it prevented the carbonates from Mine 10 to be weathered and lixiviated from it, leading to the lowest CIW and CIA indexes, the contrary of what would be expected, since they are more prone to be weathered than the silicate samples.
Mineralogical and geochemical data here reported suggest that the provenance of the sedimentary rocks was dominated by felsic sources, but intermediate or mixed sources cannot be discarded. he chemical and mineralogical aspects observed for the clayish samples of the SGCP are practically uniform along the studied proiles and mines, which allow them to be used as raw material by the industries of the SGCP region.
ACKNOWLEDGEMENTS
We are grateful to the anonymous colleagues for help-ful and constructive reviews, which led to improvements in the manuscript.
Azzi A.A., Osacký M., Uhlík P., Čaplovičová M., Zanardo A., Madejová J.
2016. Characterization of clays from the Corumbataí formation used as raw material for ceramic industry in the Santa Gertrudes district, São Paulo, Brazil. Applied Clay Science, 132-133:232-242.
Costa M.N.S. 2006. Diagênese e alteração hidrotermal em rochas sedimentares da Formação Corumbataí, Permiano Superior, Mina Granusso, Cordeirópolis/SP. PhD Thesis, Universidade Estadual Paulista, Rio Claro, São Paulo, 140 p.
Compton J.S., White R.A., Smith M. 2003. Rare earth element behavior in soils and salt pan sediments of a semi-arid granitic terrain in the Western Cape, South Africa. Chemical Geology, 201(3-4):239-255.
Condie K.C., Dengate J., Cullers R.L. 1995. Behavior of rare earth
elements in a paleoweathering proile on granodiorite in the
Front Range, Colorado, USA. Geochimica et Cosmochimica Acta,
59(2):279-294.
Cox R., Lowe D.R., Cullers R.L. 1995. The inluence of sediment
recycling and basement composition on evolution of mudrock chemistry in the southwestern United States. Geochimica et Cosmochimica Acta, 59(14):2919-2940.
Cullers R.L. 1994a. The controls on the major and trace element variation of shales, siltstones, and sandstones of
Pennsylvanian-Permian age from uplited continental blocks in Colorado to
REFERENCES
platform sediment in Kansas, USA. Geochimica et Cosmochimica Acta, 58(22):4955-4972.
Cullers R.L. 1994b. The chemical signature of source rocks in size fractions of Holocene stream sediment derived from metamorphic rocks in the Wet Mountains region, Colorado, USA. Chemical Geology,
113(3-4):327-343.
Cullers R.L. 1995. The controls on the major- and trace-element evolution of shales, siltstones and sandstones of Ordovician to tertiary age in the Wet Mountains region, Colorado, USA. Chemical Geology, 123(1-4):107-131.
Cullers R.L., Barrett T., Carlson R., Robinson B. 1987. Rare-earth element and mineralogic changes in Holocene soil and stream sediment: A case study in the Wet Mountains, Colorado, USA.
Chemical Geology, 63(3-4):275-297.
Cullers R.L., Basu A., Suttner L.J. 1988. Geochemical signature of provenance in sand-size material in soils and stream sediments near the Tobacco Root batholith, Montana, USA. Chemical Geology,
70(4):335-348.
Cullers R.L. & Graf J. 1983. Rare earth elements in igneous rocks of the continental crust: intermediate and silicic rocks, ore petrogenesis. In: Henderson P. (ed.) Rare-Earth Geochemistry. Amsterdam, Elsevier, p. 275-312.
Evensen N.M., Hamilton P.J., O’nions R.K. 1978. Rare-earth abundances in chondritic meteorites. Geochimica et Cosmochimica Acta, 42(8):1199-1212.
Formoso M.L.L., Meli A.J., Kronberg B.I. 1989. Comportamento dos
elementos terras raras no intemperismo tropical. In: Formoso M.L.L., Nardi L.V.S., Hartmann L.A. (eds.). Geoquímica dos elementos terras raras no Brasil. Porto Alegre, Companhia de Pesquisa de Recursos Minerais (CPRM) / Departamento Nacional de Produção Mineral (DNPM), p. 109-120.
Fúlfaro V.J. & Bjornberg A. 1983. Solos do Interior de São Paulo. São Paulo, Editora EDUSP, 1-39 p.
Gromet L.P., Dymek R.F., Haskin L.A., Korotev R.L. 1984. The “North American shale composite”: Its compilation, major and trace element characteristics. Geochimica et Cosmochimica Acta, 48:2469-2482.
Harnois L. 1988. The CIW index: A new chemical index of weathering. Sedimentary Geology, 55(3-4):322.
Herron M.M. 1988. Geochemical classiication of terrigenous sands
and shales from core or log data. Journal of Sedimentary Research,
58(5):820-829.
Mahjoor A.S., Karimi M., Rastegarlari A. 2009. Mineralogical and geochemical characteristics of clay deposits from South Abarkouh District of Clay Deposit (Central Iran) and their applications. Journal of Applied Sciences, 9(4):601-614.
McLennan S.M. 1989. Rare earth elements in sedimentary rocks;
inluence of provenance and sedimentary processes. Reviews in
Mineralogy, 21(1):169-200.
McLennan S.M., Hemming S., McDaniel D.K., Hanson G.N. 1993. Geochemical approaches to sedimentation, provenance, and tectonics. Geological Society of America Special Papers, Processes Controlling the Composition of Clastic Sediments, 284:21-40.
McLennan S.M., Nance W.B., Taylor S.R. 1980. Rare earth element-thorium correlations in sedimentary rocks, and the composition of the continental crust. Geochimica et Cosmochimica Acta, 44(11):1833-1839.
McLennan S.M. & Taylor S.R. 1991. Sedimentary rocks and crustal evolution: Tectonic setting and secular trends. The Journal of Geology, 99(1):1-21.
Milani E.J., França A.B., Schneider R.L. 1994. Bacia do Paraná. Boletim de Geociências da Petrobrás, 8:69-72.
Moreno M.M.T., Bartolomeu D., Lima R.H.C. 2009. Análise do comportamento de queima de argilas e formulações para revestimento cerâmico. Cerâmica, 55(335):286-295.
Moreno M.M.T., Da Rocha R.R., Godoy L.H. 2014. Major elements geochemistry of sedimentary rocks from Corumbataí Formation, Santa Gertrudes Ceramic Pole, São Paulo, Brazil. Geomaterials, 4(1):11–17.
Nesbitt H.W. & Young G.M. 1982. Early Proterozoic climates and plate motions inferred from major element chemistry of lutites.
Nature, 299:715-717.
Nesbitt H.W. & Young G.M. 1984. Prediction of some weathering trends of plutonic and volcanic rocks based on thermodynamic and kinetic considerations. Geochimica et Cosmochimica Acta,
48(7):1523-1534.
Nesbitt H.W. & Young G.M. 1989. Formation and diagenesis of
weathering proiles. The Journal of Geology, 97(2):129-147.
Nyakairu G.W.A. & Koeberl C. 2001. Mineralogical and chemical composition and distribution of rare earth elements in clay-rich sediments from central Uganda. Chemical Journal, 35(1):13-28.
Penteado M.M. 1976. Geomorfologia do Setor Centro-Ocidental da Depressão Periférica Paulista. PhD Thesis, Universidade de São Paulo, 86 p.
Roser B.P. & Korsch R.J. 1988. Provenance signatures of sandstone-mudstone suites determined using discriminant function analysis of major element data. Chemical Geology, 67(1-2):119-139.
Taylor S.R. & McLennan S.H. 1985. The Continental Crust: Its Composition and Evolution. Blackwell. Oxford, 312 p.
Taylor S.R. & McLennan S.M. 1995. The geochemical evolution of the continental crust. Reviews of Geophysics, 33(2):241-265.
Thiry M., Carrillo N., Franke C., Martineau N. 2013. Technique de
preparation des mineraux argileux en vue de l’analyse par difraction
des Rayons X et introduction a l’interprétation des diagrammes.
Geosciences, hal-00872214(1). Available at: https://hal-mines-paristech.archives-ouvertes.fr/hal-00872214 [cited at Aug. 2017].
White I.C. 1908. Relatório Final sobre as medidas de carvão e rochas associadas do Sul do Brasil. Rio de Janeiro, Relatório da Comissão das Minas de Carvão de Pedra do Brasil, 300 p.
Wronkiewicz D.J. & Condie K.C. 1987. Geochemistry of Archean shales from the Witwatersrand Supergroup, South Africa: Source-area weathering and provenance. Geochimica et Cosmochimica Acta,
51(9):2401-2416.
Wronkiewicz D.J. & Condie K.C. 1989. Geochemistry and provenance of sediments from the Pongola Supergroup, South Africa: Evidence for a 3.0-Ga-old continental craton. Geochimica et Cosmochimica Acta, 53(7):1537-1549.
Wronkiewicz D.J. & Condie K.C. 1990. Geochemistry and mineralogy of sediments from the Ventersdorp and Transvaal Supergroups, South Africa: Cratonic evolution during the early Proterozoic.
Geochimica et Cosmochimica Acta, 54(2):343-354.
Zalán P.V., Wolf S., Astoli M.A.M., Vieira I.S., Conceição J.C.J., Appi
V.T., Neto E.V.S., Cerqueira J.R., Marques A. 1990. The Paraná Basin, Brazil. In: Leighton M.W., Kolata D.R., Oltz D.F., Eidel J.J. Interior cratonic hasins. Tulsa, American Association of Petroleum Geologists Memoir, 51, p. 681-708.
Zanardo A., Montibeller C.C., Navarro G.R.B., Moreno M.M.T., Da Rocha
R.R., Del Roveri C., Azzi A.A. 2016. Formação Corumbataí na região de Rio Claro/SP: petrograia e implicações genéticas. Universidade Estadual Paulista, São Paulo, Geociências, 35:322-345.

![Table 2. Chemical indexes calculated for the samples. CIA = [Al 2 O 3 / (Al 2 O 3 + CaO + Na 2 O + K 2 O)] × 100 and CIW = [Al 2 O 3 / (Al 2 O 3 + CaO + Na 2 O)] × 100 in molecular proportions](https://thumb-eu.123doks.com/thumbv2/123dok_br/19003405.464512/10.892.85.788.425.1108/table-chemical-indexes-calculated-samples-cia-molecular-proportions.webp)
![Figure 5. Chemical Index of Weathering, CIW = [(Al 2 O 3 )/(Al 2 O 3 +CaO+Na 2 O)] * 100 and Chemical Index of Alteration, CIA = [(Al 2 O 3 )/(Al 2 O 3 + CaO + Na 2 O + K 2 O)] * 100 for the studied samples](https://thumb-eu.123doks.com/thumbv2/123dok_br/19003405.464512/11.892.104.812.686.1105/figure-chemical-index-weathering-chemical-alteration-studied-samples.webp)