Brazilian Journal of Physics, vol. 35, no. 3B, September, 2005 797
Evaluation of the Neutron Flux Distribution in an AmBe Irradiator using the
MCNP-4C code
Juan Yury Zevallos-Ch´avez and Cibele Bugno Zamboni
Instituto de Pesquisas Energ´eticas e Nucleares, Caixa Postal 11049, 05422-970, S ˜ao Paulo, SP, Brazil
Received on 1 August, 2005
The present work shows the evaluation of the flux and absorbed dose rate of neutrons in a241AmBe Irradiator at IPEN facilities using the MCNP-4C transport code. The geometry of the241AmBe source as well as the Irradiator design, constituted of 2 neutrons sources, were modeled. In addition, four and eight sources of
241AmBe were also considered for checking the viability to increase the Irradiator performance. The results
show an increase for both flux and absorbed dose rate, mainly for the fast configuration.
I. INTRODUCTION
The development of appropriate instrumentation to perform neutron activation analysis, NAA, can be of great help to in-vestigate quali-quantitatively materials in different research areas such as biological [1, 2] and geological; it can also be useful to test and calibrate neutron detectors and to check quality control parameters. In order to overcome limitations found in NAA when using usual neutron sources like nuclear reactors, a neutron irradiator have been designed and assem-bled at IPEN facilities. The main advantage of this irradia-tor is its very stable neutron flux, thus eliminating the need for standard material in the measurement of induced activity in samples. Also, to perform neutron dosimetry for radiation protection, stable fast neutron flux is necessary, so this appara-tus could be very suitable. However, as the irradiator neutron flux is many orders of magnitude lower than that of a nuclear reactor or of a particle accelerator, large samples must be ir-radiated in order to achieve good sensitivity. In this work the modeling of the neutron irradiator and evaluation of the neu-tron flux distribution and the absorbed dose were done using the MCNP-4C code [3]. Particularly for biological samples and for neutron dosymetry, the knowledge of neutron dose rate is essential and can be estimated using the Monte Carlo method. First calculations of the irradiator had already obtai-ned through Monte Carlo simulation of a certain distribution of two241AmBe neutron sources and geometry specifications [4]. The present work shows simulations for new distributions of neutron sources, and for each distribution both the neutron flux and absorbed dose were obtained. The new distributions are related with the increase in the number of neutron sources, up to eight. In this way we can check the viability to increase the Irradiator performance.
II. NEUTRON IRRADIATOR FACILITY
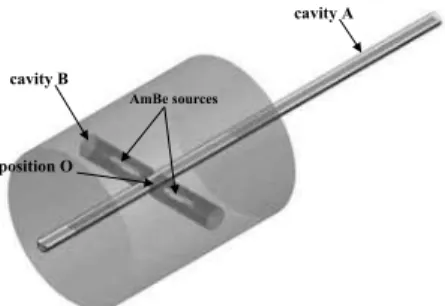
The Irradiator in operation at the IPEN facilities (Figure 1) consists of an Al cylinder of 5 mm thickness with 1200 mm length and 985 mm diameter, filled with paraffin where two perpendicular cylindrical cavities, with the same diame-ter, cross the irradiator geometric centre. In one of the cavities, say A, a lucite ruler passes through the longitudinal direction, where the material to be irradiated can be put in different
posi-FIG. 1: Neutron Irradiator at IPEN Facilities.
tions, and in the other cavity, say B, the two241AmBe sources
(600 GBq and neutron emission rate of 3.9×10
7n·s−1, each)
are positioned symmetrically, at the same distance from the geometric centre, face to face. Two different configurations, related with the neutron sources arrangements, were defined:
Thermal neutrons prevalence. In this situation, a polyethylene cylinder of around 50 mm length is placed between each neutron source and the outer wall of cavity B to thermalize the emitted neutrons;
Fast neutrons prevalence. In this situation, the neutron sources are positioned at 47 mm away from the irradiator ge-ometrical center (positionO).
III. MONTE CARLO CALCULATIONS
A. Modeling and sampling the neutron source
In this simulation the geometry of the source was mode-led as a cylinder shape of 94 mm lengh and 17 mm radius, made of a metallic alloy. The uniform particle position sam-pling was given by theEXTvariable and a power law built-in function p(x) =c|x|awas used for the source radius values
(RAD) witha=1. The energy spectrum of the source was of a241AmBe neutron emitter [5], with energies ranging from 0.025 eV to 12 MeV.
798 Juan Yury Zevallos-Ch´avez and Cibele Bugno Zamboni
−40 −20
0 20
40 −40 −20
0 20
40 −40
−30 −20 −10 0 10 20 30 40
y (cm) x(cm)
z (cm)
FIG. 2: Sampling of241AmBe neutron sources.
was performed for four sources, two positioned on the x axis and the other two on the z axis; finally a sampling for eight sources was done, four of them positioned along two diago-nals, which make 45o with the z and x axes, and the other four at the same positions considered in the second sampling. (See figure 2). With these positions of the sources, maximum values of the neutron flux in the positionOwill be obtained.
B. Neutron flux and absorved dose calculation
In the simulations cells were used to calculate both the neu-tron flux and the absorbed dose. The cell was an air sphere of 10 mm diameter. There were 41 spheres positioned over the lucite ruler with their centers separated by 20 mm.
The neutron flux was estimated using the tally F4(cm−2) withMODE N, which calculates the average flux over a cell (particles·cm−2). The intervals of energy considered were thermal below the Cadmium cutoff energy(0.5 eV), epither-mal (between 0.5 eV and 0.5 MeV) and fast neutrons (above 0.5 MeV).
The absorbed neutron dose rate was obtained through the tally F6(MeV·g−1)withMODE N, which considers the neu-tron energy deposition average over the cell. This tally gives already the energy deposited per unit mass of the material. In the simulations the importance of the overall geometry re-gions were selected as equal (=1), excluding of course the space outside the geometry (=0). These calculations were done for the two irradiator configurations, fast and thermal, respectively.
IV. RESULTS
The results correspond to five millions of neutron initial his-tories, taking times of 263, 379 and 829 minutes for two, four and eight sources considered, respectively. The relative er-ror estimated was less than 5 %, passing the statistical checks required. The evaluated neutron flux for two, four and eight sources in both configurations, thermal and fast are shown in the figures 3, 4, 5, 6, 7 and 8, respectively.
The neutron absorbed dose rate for eight sources in both configurations, thermal and fast are shown in the figures 9 and 10, respectively.
FIG. 3: Neutron flux distribution in the thermal configuration for two sources.
FIG. 4: Neutron flux distribution in the thermal configuration for four sources.
According to these figures the behaviour of the neutron flux distribution as well as the neutron absorbed dose rate for two, four (although no figures have been presented) and eight sour-ces are similar. In that way comparisons can be done for the overall simulations in order to elucidate the increasing of both the neutron flux (figure 11) and the absorbed dose (figure 12) with the increasing of the number of neutron sources. In order to make the comparisons the positionO(0, 0, 0.5 cm), center of the neutron irradiator and where the maximun values are
Brazilian Journal of Physics, vol. 35, no. 3B, September, 2005 799
FIG. 6: Neutron flux distribution in the fast configuration for two sources.
FIG. 7: Neutron flux distribution in the fast configuration for four sources.
obtained, was chosen.
V. CONCLUSIONS
The availability of a neutron irradiator apparatus gives an alternative to perform nuclear activation analysis outside a nu-clear reactor, at lower cost and with greater flux stability.
The simulation result shows that when neutron sources are
FIG. 8: Neutron flux distribution in the fast configuration for eight sources.
FIG. 9: Neutron absorbed dose rate in the thermal configuration for eight sources.
FIG. 10: Neutron absorbed dose rate in the fast configuration for eight sources.
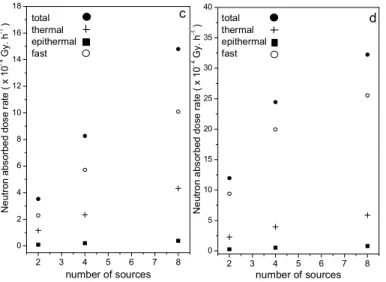
added a significant increase for the absorbed dose rate is ob-tained, mainly for the fast configuration (from 12.0×10
−4Gy·
h−1to 32
.3×10
−4Gy·h−1). On the other hand the total and
thermal neutron flux (1.7×10
5n·cm−2·s−1and 8
.2×10
4n·
cm−2·s−1, respectively, for eight sources in the thermal
confi-guration, for example) is still many orders of magnitude lower
800 Juan Yury Zevallos-Ch´avez and Cibele Bugno Zamboni
FIG. 12: Comparison of the neutron absorbed dose rate in the positionOas a function of the number of sources. The letterscanddmean for the thermal and fast configurations, respectively.
than of a nuclear reactor (1012−1013n·cm−2·s−1),
howe-ver the neutron irradiator becomes advantageous when large amounts of material (several grams) must be analyzed.
Acknowledgments
Financial support: CLAF/CNPq
[1] K. J. Ellis, R. J. Shypailo, J. of Radioanalytical and Nucl. Che-mistry, Articles,161, No.1 (1992).
[2] K. J. Ellis, R. J. Shypailo, A. C. Hergenroeder, M. D. Perez, S. A. Abrams, J. of Radioanalytical and Nucl. Chemistry,249, No.2 (2001).
[3] J. D. Briemster, MCNP - A general Monte Carlo N-particle transport code, version 4C(2000).
[4] K. Shtejer-Diaz, C. B. Zamboni, G. S. Zahn, J. Y. Zevallos-Ch´avez, Applied Radiation and Isotopes,59, 263 (2003). [5] E. Angioletto, Medidas e C´alculos de Espectro de Nˆeutrons