Paixão L et al. / MC derivation of W anode X-ray spectra for dose in DM
Radiol Bras. 2015 Nov/Dez;48(6):363–367 363
Original Article
Monte Carlo derivation of filtered tungsten anode X-ray spectra
for dose computation in digital mammography
*
Derivação Monte Carlo de espectros filtrados de raios X de ânodo de tungstênio para determinação de dose em mamografia digital
Paixão L, Oliveira BB, Viloria C, Oliveira MA, Teixeira MHA, Nogueira MS. Monte Carlo derivation of filtered tungsten anode X-ray spectra for dose computation in digital mammography. Radiol Bras. 2015 Nov/Dez;48(6):363–367.
Abstract
R e s u m o
Objective: Derive filtered tungsten X-ray spectra used in digital mammography systems by means of Monte Carlo simulations.
Materials and Methods: Filtered spectra for rhodium filter were obtained for tube potentials between 26 and 32 kV. The half-value layer (HVL) of simulated filtered spectra were compared with those obtained experimentally with a solid state detector Unfors model 8202031-H Xi R/F & MAM Detector Platinum and 8201023-C Xi Base unit Platinum Plus w mAs in a 8202031-Hologic Selenia Dimensions system using a direct radiography mode.
Results: Calculated HVL values showed good agreement as compared with those obtained experimentally. The greatest relative difference between the Monte Carlo calculated HVL values and experimental HVL values was 4%.
Conclusion: The results show that the filtered tungsten anode X-ray spectra and the EGSnrc Monte Carlo code can be used for mean glandular dose determination in mammography.
Keywords: Mammography; X-ray spectra; HVL; Monte Carlo.
Objetivo: Derivar espectros filtrados de raios X de tungstênio utilizados em sistemas de mamografia digital por meio de simulações Monte Carlo.
Materiais e Métodos: Espectros filtrados por filtro de ródio foram obtidos para potenciais do tubo entre 26 e 32 kV. Os valores de camada semirredutora (CSR) dos espectros filtrados simulados foram comparados aos valores obtidos experimentalmente com um detector de estado sólido Unfors modelo 8202031-H Xi R/F & MAM Detector Platinum e unidade base 8201023-C Xi Platinum Plus w mAs em um sistema Hologic Selenia Dimensions utilizado no modo radiografia direta.
Resultados: Os valores de CSR calculados mostraram boa concordância quando comparados com os valores obtidos experimental-mente. A maior diferença relativa entre os valores de CSR calculados com Monte Carlo e os valores de CSR experimentais foi 4%.
Conclusão: Os resultados demonstram que os espectros filtrados de raios X de ânodo de tungstênio e o código de Monte Carlo EGSnrc podem ser utilizados para determinar a dose glandular média em mamografia.
Unitermos: Mamografia; Espectros de raios X; CSR; Monte Carlo.
* Study developed at Centro de Desenvolvimento da Tecnologia Nuclear / Comissão Nacional de Energia Nuclear (CDTN/CNEN), Belo Horizonte, MG, Brazil.
1. M.Sc., Post-graduation in Science and Technology of Radiations, Minerals and Materials – Centro de Desenvolvimento da Tecnologia Nuclear / Comissão Nacional de Energia Nuclear (CDTN/CNEN), Belo Horizonte, MG, Brazil.
2. M.Sc., Post-graduation in Nuclear Sciences and Techniques – Departamento de Engenharia Nuclear da Universidade Federal de Minas Gerais (DEN-UFMG), Belo Horizonte, MG, Brazil.
3. M.Sc., Professor, Department of Anatomy and Imaging, Universidade Federal de Minas Gerais (UFMG), Belo Horizonte, MG, Brazil.
4. MD, Radiologist, Technical Director, Clínica Dra. Maria Helena Araújo Teixeira, Belo Horizonte, MG, Brazil.
5. D.Sc., Titular Researcher-Professor, Centro de Desenvolvimento da Tecnologia Nuclear / Comissão Nacional de Energia Nuclear (CDTN/CNEN), Departamento de Engenharia Nuclear da Universidade Federal de Minas Gerais (DEN-UFMG), Belo Horizonte, MG, Brazil.
imaging modality for breast cancer screening(1). Breast do-simetry is an important part of the quality assurance program, provides means to define and verify the standards of good practice, besides contributing in the optimization of radio-logical protection(2,3).
It is widely accepted that the mean glandular dose (DG)
for the breast glandular tissue is the most useful magnitude for characterizing breast cancer risk(2,4). Because of the dif-ficulty to measure it directly on the breast, the procedure to estimate the DG values consists in making use of conversion
factors that relate incident air kerma (Ki) at this dose value.
Generally, the conversion factors vary with the X-ray spectrum half-value layer (HVL) and the breast composition and thick-ness. By means of computer simulations, several authors have
Lucas Paixão1, Bruno Beraldo Oliveira1, Carolina Viloria2, Marcio Alves de Oliveira3, Maria Helena Araújo
Teixeira4, Maria do Socorro Nogueira5
INTRODUCTION
Radiographic breast imaging (mammography) is indi-cated for detection, diagnosis and clinical management of cancer. Moreover, mammography is the most widely used
Mailing Address: Lucas Paixão. Centro de Desenvolvimento da Tecnologia Nuclear. Avenida Presidente Antônio Carlos, 6627, Campus UFMG, Pampulha. Belo Horizonte, MG, Brazil, 31270-901. E-mail: [email protected].
calculated such factors with the Monte Carlo method(5–8). The Monte Carlo radiation transport simulations are recog-nized as an important tool in dose calculations in different fields related to medical physics(9). Monte Carlo codes can be used in mammography to simulate and characterize pho-ton beams produced; radiation dose absorbed by patient’s organs; and dosimetry involving phantoms(10).
Many X-ray spectral models for DG computer
simula-tions purposes are available in the diagnostic range(11,12). One of the models available(13) generates polyenergetic X-ray spectra for molybdenum, rhodium, and tungsten anodes. The spectra produced by this model do not include any added filtration except by the 0.5 mm beryllium window of the X-ray tube and any self-filtration by the anode itself.
The objective of the present study is to use Monte Carlo simulations to generate filtered X-ray spectra used in digital mammography systems from unfiltered spectra. Therefore, the Monte Carlo EGSnrc code package with the C++ class library (egspp) was employed to derive filtered tungsten X-ray spectra. Filtered spectra for rhodium filter were obtained for tube potentials between 26 and 32 kV. The HVLs of simu-lated filtered spectra were compared with those experimen-tally obtained with a solid state detector in a digital mam-mography system to validate the results. The results were also compared with the values recommended by the Techni-cal Reports Series no. 457 of the International Atomic En-ergy Agency(14).
MATERIALS AND METHODS Geometric model
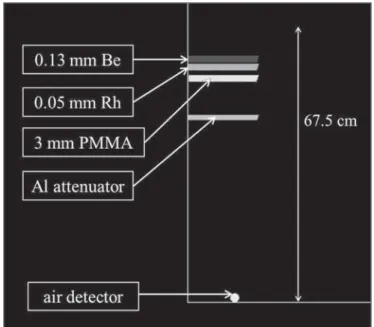
The geometric model adopted in the simulations was based on the Hologic Selenia Dimensions system (Hologic, Inc.; Bedford, MA) of a mammography clinic located in Belo Horizonte, MG, Brazil. A schematic drawing is shown on Figure 1.
Such a mammography system has a focal spot of 0.3 mm, a 0.63 mm beryllium window and 0.050 mm rhodium filter. The distance between the breast support and the focal spot is 67.5 cm.
Since the spectra have a 0.5 mm beryllium inherent fil-tration, to simulate the 0.63 mm beryllium window of clini-cal system, a 0.13 mm beryllium (ρ = 1.848 gcm–3
) win-dow was positioned at 5.0 cm from the focal spot in the simu-lations. The rhodium (ρ = 12.41 gcm–3
) filter was modelled at 7 cm. Since the HVL measurements are performed in the presence of the compression plate, a polymethylmethacrylate (PMMA) compression plate was modelled with 18.0 × 24.0 × 0.3 cm3
at 10 cm(14). The aluminium (ρ = 2.6989 gcm–3
) attenuators were positioned at 20 cm, with thicknesses rang-ing from 0.4 and 0.8 mm. All distances are relative to focal spot. An air (ρ = 0.00120479 gcm–3
) sphere of 6 cm3
was centred laterally at 66.37 cm from the tube focal spot and at 6 cm from the chest wall edge as a detector. The breast sup-port and X-ray scatter reduction grid were not modelled. The density and composition of materials utilized in the simula-tions were obtained in the material library of the EGSnrc code.
Monte Carlo simulations
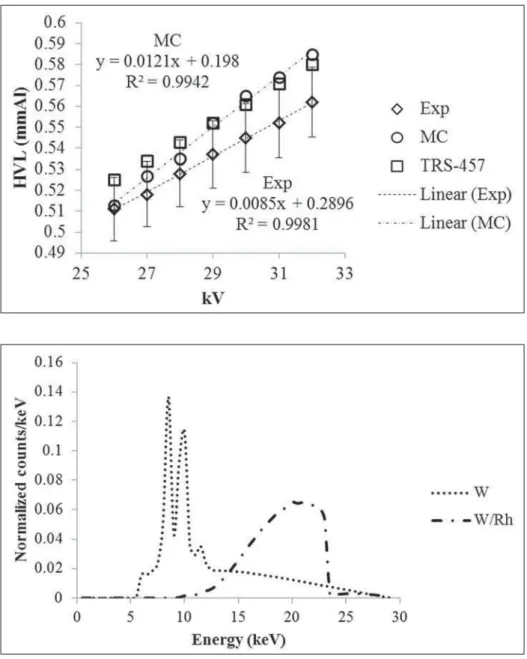
The Monte Carlo EGSnrc code package(15) with the C++ class library (egspp) was employed(16). The unfiltered tung-sten X-ray spectra for tube potentials between 26 and 32 kV (Figure 2) were simulated(13).
The radiation beam was collimated into a rectangular shape of 1.13 cm side. Thus the collimated beam impinges directly on the modelled detector. Electrons and photons are followed down to a threshold energy of 10 keV. Bound Compton scattering, Electron Impact Ionization, Rayleigh scattering and atomic relaxations are turned on. NIST tabu-lations of differential bremsstrahlung cross sections and photon cross sections from XCOM tabulations are used(17). Absorbed dose in air simulations were performed for HVL calculations with 5 × 10⁷
histories which represent a statis-tical error of about 3%. The simulations were performed in a personal computer with an Intel®
Xeon®
Quad CPU of 3.30 GHz with 4 GB RAM.
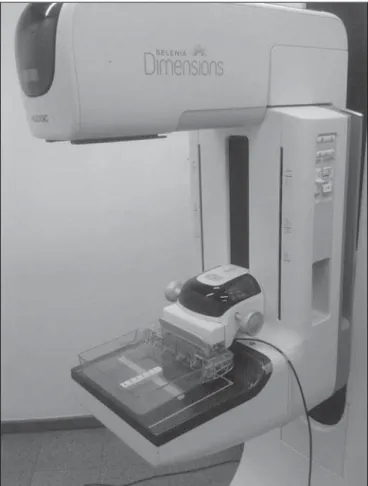
HVL measurements
obtained directly by averaging three measurements in mmAl. All irradiations were done with a tube loading of 50 mAs. It is important to observe that irradiations were performed with the compression plate in contact with the detector (Figure 3). This was necessary for future use of the HVL values in the determination of DG conversion factors(6,18).
Table 1—HVL values for each voltage and W/Rh target/filter combination.
HVL (mmAl)
kV
26 27 28 29 30 31 32
Experimental
0.511 ± 3%* 0.518 ± 3% 0.528 ± 3% 0.537 ± 3% 0.545 ± 3% 0.552 ± 3% 0.562 ± 3%*
Monte Carlo
0.513 ± 3% 0.527 ± 3% 0.535 ± 3% 0.552 ± 3% 0.565 ± 3% 0.574 ± 3% 0.585 ± 3%
* Estimated values.
Table 2—Experimental HVL values uncertainty calculation.
Uncertainty sources
Calibration Detector resolution Angular dependence Temperature and humidity Energy dependence Readings accuracy* Measurement position†
Combined standard uncertainty (k = 1)
*Standard deviation of the average of three measurements. † ± 2 mm for 700 mm. Uncertainty (%)
2.0 0.5 0.5 0.5 2.0 0.3 0.3 3.0 RESULTS
The W/Rh target/filter combination X-ray spectra HVL values obtained by Monte Carlo simulations and experimen-tally are shown on Table 1. The experimental values for 26 and 32 kV were estimated from linear fitting of the remain-ing values. The uncertainty of all results was estimated to be 3% (1 σ). The estimated values uncertainty was < 3% but this value was maintained in order to be conservative. The ex-perimental HVL values uncertainty calculation is shown on Table 2. The main sources of experimental values uncertainty Figure 2. Unfiltered tungsten X-ray
spectra used in the Monte Carlo simu-lations.
are calibration (2%) and energy dependence (2%) of the de-tector. The HVL values obtained in the present study are also shown on Figure 4, along with HVL values recommended by TRS-457(14). Linear fitting of the data along with its equa-tion and the R2
coefficient are also shown on Figure 4. For a better viewing, only experimental values uncertainty bars are shown.
DISCUSSION
Calculated HVL values showed good agreement as com-pared with those experimentally obtained. The highest rela-tive percentage difference between the Monte Carlo calcu-lated HVL values and experimental HVL values was 4%. Taking into account the values recommended by the TRS-457, the relative percentage difference for Monte Carlo cal-culated HVL values ranged between –2% and 1% and was – 3% for all experimental values. Such Monte Carlo calcu-lated HVL values are preliminary results. Great improvement has been achieved for both results and uncertainties by
us-ing Ki rather than absorbed dose in air. New results are
re-ported by Paixão et al.(19).
The results obtained in this study show that the EGSnrc Monte Carlo code generates the X-ray spectra with appro-priate filtration. As an example, a Monte Carlo obtained W/ Rh target/filter combination X-ray spectra for 29 kV is shown on Figure 5. The filtered tungsten anode X-ray spectra may be used for dosimetry studies in mammography. When us-ing the filtered spectrum instead of the unfiltered spectrum in dose simulations, one may gain in computational time.
Although Mo/Mo target/filter is the most widely used combination in clinical practice, new combinations have been introduced with the increasing use of digital mammography systems(8). Therefore, the results of the present study are important as they can be applied to state of the art equipment.
CONCLUSIONS
In the present study, the Monte Carlo code EGSnrc was employed for simulation of filtered X-ray spectra used in
Figure 4. HVL values for each voltage and W/Rh target/filter combination.
Figure 5. Tungsten target X-ray spectra(13) and
digital mammography. The differences in the HVL values were less than 4% for all tube voltages. Such results demon-strate that the EGSnrc code provides a filtration of the raw X-ray spectra in good agreement with those experimentally determined. The W/Rh target/filter combination X-ray spec-tra obtained in the simulations may be used in future Monte Carlo simulations studies in digital mammography.
Acknowledgments
The authors are thankful to Coordenação de Aperfeiçoa-mento de Pessoal de Nível Superior (Capes) and to Comissão Nacional de Energia Nuclear (CNEN) for the incentive with PhD fellowships and to Dra. Maria Helena Araújo Teixeira Clinic for providing the DBT system. The present study was financially supported by Fundação de Amparo à Pesquisa do Estado de Minas Gerais (Fapemig) and Ministry of Science and Technology (MCT), Brazil, through the Brazilian Insti-tute of Science and Technology (INCT) for Radiation Me-trology in Medicine.
REFERENCES
1. Chevalier M, Morán P, Ten JI, et al. Patient dose in digital mam-mography. Med Phys. 2004;31:2471–9.
2. International Commission on Radiation Units and Measurements. Mammography – assessment of image quality (ICRU Report 82). United Kingdom: ICRU; 2009.
3. Oliveira MA, Dantas MVA, Santana PC, et al. Assessment of glan-dular dose and image quality in mammography using computerised radiography employing a polymethylmetacrilate breast simulator. Radiat Meas. 2011;46:2081–5.
4. Dance DR, Skinner CL, Carlsson GA. Breast dosimetry. Appl Radiat Isot. 1999;50:185–203.
5. Wu X, Gingold EL, Barnes GT, et al. Normalized average glandu-lar dose in molybdenum rhodium filter and rhodium target-rhodium filter mammography. Radiology. 1994;193:83–9. 6. Dance DR, Skinner CL, Young KC, et al. Additional factors for the
estimation of mean glandular breast dose using the UK mammog-raphy dosimetry protocol. Phys Med Biol. 2000;45:3225–40.
7. Boone JM. Normalized glandular dose (DgN) coefficients for arbi-trary X-ray spectra in mammography: computer-fit values of Monte Carlo derived data. Med Phys. 2002;29:869–75.
8. Dance DR, Young KC, van Engen RE. Further factors for the es-timation of mean glandular dose using the United Kingdom, Euro-pean and IAEA breast dosimetry protocols. Phys Med Biol. 2009; 54:4361–72.
9. Rogers DWO. Fifty years of Monte Carlo simulations for medical physics. Phys Med Biol. 2006;51:R287–301.
10. Cassola VF, Hoff G. Comparative study of computational dosim-etry involving homogeneous phantoms and a voxel phantom in mammography: a discussion on applications in constancy tests and calculation of glandular dose in patients. Radiol Bras. 2010;43:395– 400.
11. Ay MR, Sarkar S, Shahriari M, et al. Assessment of different com-putational models for generation of x-ray spectra in diagnostic ra-diology and mammography. Med Phys. 2005;32:1660–75. 12. Cunha DM, Tomal A, Poletti ME. Monte Carlo simulation of
x-ray spectra in mammography and contrast-enhanced digital mam-mography using the code PENELOPE. IEEE Trans Nucl Sci. 2013;60:495–502.
13. Boone JM, Fewell TR, Jennings RJ. Molybdenum, rhodium, and tungsten anode spectral models using interpolation polynomials with application to mammography. Med Phys. 1997;24:1863–74. 14. International Atomic Energy Agency. Dosimetry in diagnostic
ra-diology: an international code of practice. Technical Reports Series no. 457. Vienna: IAEA; 2007.
15. Kawrakow I, Rogers D. The EGSnrc code system: Monte Carlo simulation of electron and photon transport. NRCC Report PIRS-701. Ottawa, Canada: National Research Council of Canada; 2010. 16. Kawrakow I, Mainegra-Hing E, Tessier F, et al. The EGSnrc C++ class library. National Research Council of Canada. Report PIRS-898 (Rev A); 2009.
17. Mainegra-Hing E, Kawrakow I. Efficient x-ray tube simulations. Med Phys. 2006;33:2683–90.
18. Dance DR. Monte Carlo calculation of conversion factors for the estimation of mean glandular breast dose. Phys Med Biol. 1990;35: 1211–9.