A Lempel-Ziv Like Approach for Signal Classification*
J. MONTALV ˜AO1** and J. CANUTO2
Received on December 26, 2011 / Accepted on July 4, 2014
ABSTRACT.In this paper, the seminal method proposed by Abraham Lempel and Jacob Ziv, aimed at the complexity analysis of sequences of symbols, was modified to compare similarities between two se-quences. This modification allowed the creation of a new criterion which can replace likelihood in some pattern recognition applications. Moreover, to allow for analysis and comparison of multivariate continu-ously valued patterns, we also present a simple adaptation of the Lempel-Ziv’s method to time-sampled signals. To illustrate the usefulness of these proposed tools, two sets of experimental results are presented, namely: one on speaker identity verification (biometrics) and another on healthcare signal detection. Both experiments yield promising performances. Moreover, as compared to a conventional pattern recognition method, the new approach provided better performances in terms of Equal Error Ratio in speaker verifica-tion experiments.
Keywords:signal analysis, noa priori, Lempel-Ziv complexity.
1 INTRODUCTION
In 1976, A. Lempel and J. Ziv [1] proposed an approach for complexity analysis of symbol se-quences. An important aspect of their approach is the lack ofa prioriwith regard to the source of symbols, which clearly contrasts with the measurement of (source) Shannon entropy [2]. Though they are conceptually different measures, it was shown that [3], under ergodicity conditions, Lempel-Ziv’s complexity of increasingly long symbol sequences converges almost surely to the Shannon entropy of the source from which symbols are drawn.
Lempel-Ziv’s (LZ) approach, latterly simplified for practical reasons, became widely known as the compression algorithm behind many computer programs for file compression – the “zip-like” programs. We should probably credit its success to its universality, in other words, to its lack of a priori. Nevertheless, it should be also highlighted that zip-like programs are just the “tip of the iceberg,” for compression is just a single offspring of the elegant theory presented in [1].
*This work was granted by theConselho Nacional de Desenvolvimento Cient´ıfico e Tecnol´ogico(CNPq). **Corresponding author: Jugurta Montalv˜ao.
1Departamento de Engenharia El´etrica, UFS – Universidade Federal de Sergipe, 49000-000 S˜ao Crist´ov˜ao, SE, Brazil. E-mail: [email protected]
Indeed, compression is a consequence of redundancy removal, and “zip-like” programs aim at finding redundancies in streams of symbols, regardless of what they represent (e.g. texts, audio, video). These redundancies may even be gathered in a so-called “dictionary”, whose content cor-responds to unique non-overlapping segments of the analyzed sequence of symbols. We highlight though that the idea of an explicit dictionary does not take part in the original analysis method proposed in [1]. Therefore, the dictionary definition in this paper is arbitrary.
The original method by Abraham Lempel and Jacob Ziv was aimed at symbolic sequence anal-ysis, but it may be adapted to work with sequences of numbers as well (e.g. sampled signals). For instance, this adaptation can be done rather straightforwardly through simple quantization of the signal, thus mapping it back into a sequence of labels (one label per quantization level). In all cases, redundancy analysis allows for: compression, segmentation, pattern recognition and/or prediction.
Signal comparison through LZ approach is not new, though not too current in the pattern recog-nition scenario. One rather isolated example (to the extent of the authors’ knowledge), published in 1995, is the work by P. Johansen [4], in which handwritten signature authenticity is verified (behavioural biometrics). Indeed, the asymmetric measure defined in Section 4 is closely related to the ideas presented in [4]. In [5], it was clearly shown, through numeric examples, that LZ complexity may replace the Lyapunov exponent as a more precise measure of order/disorder, in spatiotemporal pattern analysis. Besides, in [6] the Lempel-Ziv-Welch algorithm was success-fully applied to texture (image) classification.
In spite of the above mentioned examples, we also observe that LZ based signal analysis is more common in specific research domains, such as biomedical signals [8, 7, 9, 10], possibly due to the nice properties of the LZ-based entropy estimators, as compared to the plug-in method [11, 7]. Moreover, because LZ algorithms only process sequences of symbols, thresholding and labeling are frequently applied to real-valued signals prior to LZ analysis. Indeed, in most cases, a single threshold is used to generate two-symbol sequences. For instance, in [4] binary pixel attributes were used (black or white pixels), and in [5] binary sequences were obtained through the use of two thresholding methods: an adaptive single threshold for series from a pseudo-random-number-generator, and a fixed threshold, at 0.5, for series generated by logistic map difference equations. In [8], a study of the influence of the thresholding method on LZ com-plexity measure is presented, considering more than one threshold (more than two symbols in resulting sequences). Unfortunately, that work does not take into account multivariate signals, whose quantization is a more complex matter.
Similarly, in [12], nine groups of signals were analysed with a pool of complexity measures, including Lempel-Ziv’s one. Again, the simplest procedure to express multivariate time series of dynamical data as a symbolic sequence was used there. This procedure was the calculation of Euclidean distances between consecutive points, followed by the comparison of these distances to their median, thus yielding two-symbol sequences.
describe a new method which allows for LZ analysis of continuous multivariate sampled signals. In Section 4, a new similarity measure between signals is proposed, inspired by the complexity measure defined in [1]. Moreover, in Section 5, it is shown how to use this new measure as an alternative to likelihood based criteria. Also in that Section 5, we gather some experimental re-sults with and without vector quantization of signals from two public databases. These rere-sults are analysed and conclusions are presented in Section 6.
2 THE LEMPEL-ZIV’S METHOD
Lets1n be a sequence ofn symbols drawn from a finite alphabet,A, Lempel-Ziv’s complexity analysis is based on the parsing ofs1n into a minimum number of unique (with one possible exception) subsequences of symbols. Though the idea of a dictionary of subsequences is not presented in the seminal paper published in 1976 [1], we believe that it is a powerful point of view for pattern recognition. Therefore, we define a growing dictionary of subsequences sij, wheresij stands for a substring formed by symbols from positioni to position j (i ≤ j ≤ n). Thus, Lempel-Ziv’s algorithm can be summarized as follows:
1. Setk=1,L =1 and start with a single element in the dictionary, s11
. Set a pointer to the first symbol of the sequence, pk=1.
2. Increase Lby one,L ←L+1. If pk+L−1 equalsn, then take the new subsequence of
lengthL,spk+L−1
pk , as the last parsed segment and stop the algorithm, otherwise...
3. Comparespk+L−1
pk (a substring of lengthL) to every subsequence of the same length in the
past3,spk+L−2
1 .
4. If this search fails:
• The subsequencespk+L−1
pk is given as a new dictionary entry;
• pkis set to the position of the next symbol,pk ← pk+L;
• kis increased by one,k←k+1;
• Lis set to zero,L ←0, and;
• the algorithm flow moves back to step (2).
Otherwise, go to step 2.
The number of parsed substrings through this process, represented byC(s1n), was proposed by Lempel and Ziv as a complexity measure.
3An alternative method was proposed in 1978 [13] to alleviate the computational burden, in which new subsequences are
3 PARSING TIME-SAMPLED SIGNALS WITHOUT VECTOR QUANTIZATION
To allow for signal replacing sequences of non-numerical symbols, we stretch a little bit our notation and lets1nalso stand for a sequence ofnsignal samples, taken at regular time intervals. Thus,sij stands for a sequence of j−i +1 signal samples drawn from a possibly infinite set (e.g. the Real set). Note that regular time-sampling is assumed, but quantization of samples is not mandatory. Nevertheless, for the convenience of computational experiments in this paper, we use quantized signals instead of continuously valued samples.
Because the domain ofsi may be continuous, if we apply the Lempel-Ziv algorithm to it, we
may end up with an infinite dictionary of single samples (because every new sample may be unique!). A simple way to cope with this problem is to quantize samples. For instance, a ‘wav’ file, with 16 bits per sample (65536 quantization levels), can be partially compressed with the LZ algorithm, although with a poor performance, less than 60% (compressed size/original size
×100), on average. Roughly speaking, both the choice of the number of quantization levels and the quantization scheme (linear/nonlinear) clearly influence the compression result.
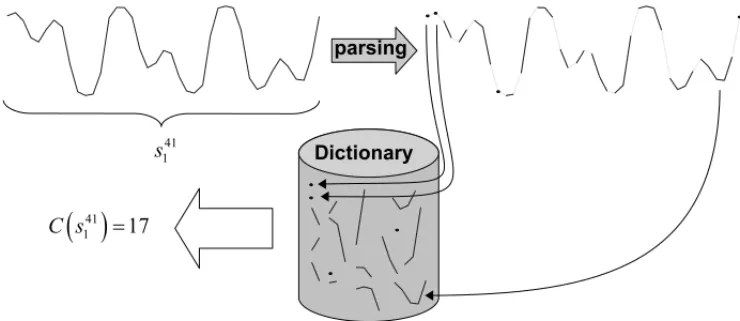
By contrast, we are not bound to quantization to allow for comparisons between signal segments. By regarding a sequence of samples,sii+L−1, as an instance of a discrete-time stochastic process [3] of length L, we may use pattern recognition methods[14] to decide whether an observed instance is “new” or if it already appeared in the signal past. If it is new, then it is given as a dictionary entry, thus forming a dictionary which is a set of signal segments, as illustrated in Figure 1.
Figure 1: An illustration of Lempel-Ziv’s complexity analysis applied to continuously valued (time sampled) signals.
A straightforward way to adapt the LZ algorithm to continuously valued signals is the replace-ment of step (3), in Section 2 with:
Modifiedstep (3): Comparespk+L−1
pk (now a signal segment of lengthL) to every signal segment
of the same length in the “past,” spk+L−2
be a pattern laying inRD, as far as the signal can be an instance of a multivariate random process of dimensionD.
In typical pattern recognition approaches, this comparison depends on a random vector model, i.e. multivariate probability density functions (pdf). In order to keep the pivotal idea in the LZ approach, we also should estimate this pdf explicitly or implicitly through a method withouta priori, which leads us to nonparametric methods, such as the Parzen or the K-Nearest Neigh-bours (KNN) [14]. Unfortunately, both methods involve a training step which may be too com-putationally demanding. Indeed, in this case, we should estimate one pdf per value ofL, to be re-estimated every new comparison because the training set – past signal – changes all the time.
As a strong simplification, we assume that both non-parametric methods, Parzen and KNN, ul-timately take decisions by comparing distances between a new signal segment and reference segments of the same length. These distances are then compared to a threshold. Thus, our simplified approach for signal comparison, inModified step(3), is:
• Arbitrarily set an Innovation Threshold,TI.
• Copyspk+L−1
pk to a matrixS
(0)
i,j, where 1≤ j ≤L and 1≤i ≤D.
• Copy thert h signal segments of lengthLfromspk+L−2
1 (1≤r ≤ pk+L−1) to matrix Si,j(r).
• Compute pk+L−1 mean squared deviation as:d(r) = D1+L iD=1 L
j=1(S (0) i,j −S
(r) i,j)2.
• If at least one d(r) is less thanTI, thensppkk+L−1is not new (for a noisy copy of it was
found in the past), and the searchsucceeds, otherwise itfails, and the signal segment is considered as an innovation.
4 A NEW SIMILARITY MEASURE FOR PATTERN RECOGNITION
Pattern classification is usually based on likelihood from probabilistic models, or distances be-tween patterns which can loosely be regarded as simplifications of likelihood based criteria. In this paper, we claim that compression rate may play a role similar to likelihood. Considering a lossless compression scheme, the higher the compression rate of a given signal, the greater is the number of long segments of samples that can be found more than once in the whole signal. In or-der to use compression rate to compare two signals, we modify the LZ algorithm to consior-der two series as inputs, where one of them just plays the role of “past signal”, and the other is parsed.
Letx1m and y1n be two sequences ofm andn symbols, both drawn from a finite alphabet,A. Alternatively, xm1 and y1n may be two sampled signals, both with samples lying in RD. The ModifiedLempel-Ziv (MLZ) parsing procedure starts by searching for yp1
1 (initially p1 = 1) insidexm1. If this search succeeds, p1is replaced withp1+1 and a new search is done, otherwise the pointerp1is registered, and a new pointer p2← p1+1 is created, and the search inx1mfor a subsequence equal/similar toyp2
p1+1is done; and so on. The algorithm stops when the end ofy
is reached. The number of segments into which y1nis parsed is denoted byCM L Z(y1n;x1m), thus indicating thatx1m plays the role of a parameter ofCM L Z.
Illustration: If x16 = abbaabandy19 =ababbaabb, the modified parsing process produces: aba·bbaabb. By denoting it as a function ofy, parametrized byx, we write:CM L Z(y;x)=2.
It is worth noting that measure CM L Z(y1n;x1m) depends on m, the length of “parameter” x1m. Parameterx1mcan be regarded as a memory of subsequences of symbols/samples, and the longer such memory is, the more likely we are to find longer segments of y in x, even if y and x are generated by statistically independent sources. To properly compensate for this dependency of the proposed measure, CM L Z on m, we make an appeal to an important statement in [1],
according to which the maximum complexity measure of a sequencex1m, produced by an ergodic α-symbol source (α is the cardinality of A), is m/logα(m). This upper bound gives a clue concerning the averaged length of dictionary items (sub-sequences of symbols) produced by LZ processing ofxm1. That is to say thatm/logα(m)estimates the number of segments into which
x1mis parsed, by assuming an averaged segment length of logα(m).
As a result, we claim that the averaged length of segments ofy1nfound inx1m, given by n
CM L Z(y1n;xm1) ,
is a measure of similarity between the two sequences, but it depends onm. In order to make this measure less sensitive to the length ofx1m, we divide it by log(m)(the logarithm base is not relevant, because its change corresponds to multiplying the measure by a constant scale factor). Accordingly, we propose a new similarity criterion between sequences of symbols, given by:
S(y1n;xm1)= n
CM L Z(y1n;x1m)log(m)
(4.1)
and because this measure is not symmetric, i.e. S(yn1;x1m) = S(x1m;y1n), we finally propose a symmetric criterion, given by:
J(yn1,x1m)=(1/2)S(y1n;x1m)+S(x1m;y1n); (4.2)
5 EXPERIMENTAL RESULTS
A straightforward approach to Lempel-Ziv analysis of sequences of numeric patterns is to vector quantize it and to perform analysis on the resulting sequence of labels (e.g. prototype labels). Though it is indeed a straightforward solution, it raises some nontrivial questions, such as the influence of number of prototypes and quantization strategy on the analysis result. By contrast, the new algorithm proposed in Section 3 allow for LZ analysis of multivariate signals without quantization. Nonetheless, it also raises difficult questions concerning the choice of the threshold TI. In this paper, we do not discuss such difficult matters, which are postponed to future works.
Instead, we empirically study the influence of both the number of prototypes,K(approach with quantization), and the threshold,TI (approach without signal quantization), on signal
Thus, in this Section, we present results from two sets of experiments. First in biometric speaker verification, and secondly in healthcare signal detection. Both experiments were done with pub-licly available databases, so that it can be easily reproduced by interested readers.
5.1 Experiment with speaker recognition (Biometrics)
The speaker verification experiment was done with a publicly available database (The BioChaves database, available at http://www.biochaves.com/). Speech samples in this database correspond to signals recorded during the uttering of a single set of four words in Portuguese —“chocolate, zebra, banana, t´axi.” — identically spelled in English, apart from the spelling of “t´axi”. The duration of each utterance is about 3sand each subject uttered this set of words 10 times, 5 (five) samples during a first session, and 5 more samples during a second session, about a month later, using a conventional headset (electret microphone plus headphone). Speech signals were thus digitalized and recorded with 16 bits per sample, at 22050 samples per second. All recordings were done under low background noise, though in an uncontrolled environment. Ten subjects took part in the experiment.
In terms of biometric verification, it is a small database. However, since our goal is to com-pare pattern recognition approaches based on the very same MFCC extracted from recorded utterances, this database provide us with a total of 1375 distinct pair-wise comparisons between utterances from different sessions (1125 from different speakers and 250 from the same one) which is enough to show a clear and consistent difference between approach performances.
By doing pair-wise comparisons we simulate a verification protocol with 1 utterance per enroll-ment, and 1 per interrogation. Thus, given the too short duration of each utterance for biometric purposes – only 3 s –, we should expect high error ratios, as compared to typical biometric exper-iments in literature. But it does not matter in this work, as we are interested in the comparative performance of the tested algorithms.
Therefore, in each experiment, every single utterance from one session (half database) is taken once as a prototype (enrollment) and then cross-compared to every other utterance from the other session. Whenever both compared utterances came from the same person, the resulting score is labeled with a ‘T’ (true claimed identity), otherwise, it is labeled with an ‘F’. As a result, each algorithm provides 250 scores labeled ‘T’, and 1125 labeled ‘F’. Then we adjust a decision threshold to minimize the Equal Error Rate (EER) — i.e. the operational point where false alarm rate (FAR) equals false rejection rate (FRR) — for each set of scores, for each algorithm.
All pattern recognition algorithms used here use 19 Mel-Frequency Cepstral Coefficients (MFCC) per time frame of 25 ms, with overlapping between frames of 82% (advance of 4.5 ms per frame). Given all overlapping short frames of signal, in order to discard silent frames (or frames with too low acoustic energy), we first estimate the signal power in each frame, and then we set an adaptive energy threshold between the the minimum and the averaged power per frame. All remaining short-signal frames are then frequency analysed, yielding a matrix,Xi,j, of
As for the vector quantization strategy, an important aspect of it is that matrices of patterns from two signals under comparison must share the same feature space, as well as the same set of prototypes. To induce it, beingX andY MFCC matrices extracted from two utterances (speech signals) to be compared, respectively, we first concatenate X andY in a single bigger matrix Z = [X Y], and then we find K prototypes in 19-Dimensional feature space (for simplicity, we use standard K-Means algorithm [14]). Finally, each column ofX andY is labelled with the closest prototype index, thus yielding two sequences of labels,xandy, respectively.
In our experiment with the BioChaves database, and 19-MFCC coefficients, we empirically found that the K (number of prototypes) that minimizes the EER is K = 30. By using the similarity measure defined in Eq. 4.2 to compare several instances of independently quantized-labelled utterances, we obtained an averaged E E R = 7.6%, with an 95% confidence interval of approximately±0.2%. Note that, due to the random initialization of the K-Means algorithm, scores from a given pair of signals can be regarded as instances of a random variable.
This result, still with quantization-labelling of patterns, was sensibly improved with the averag-ing of 3 instances of correspondaverag-ing values ofJ(x,y). More precisely, for each pair of utterances, we performed 3 independent clustering and quantization of patterns, yielding three instances of xandy, sayx(1),x(2),x(3),y(1),y(2)andy(3). Then three corresponding scores were computed, namely J(x(1),y(1)),J(x(2),y(2))andJ(x(3),y(3)). Finally, the mean of these three scores (for each pair of signals) was taken as final score.
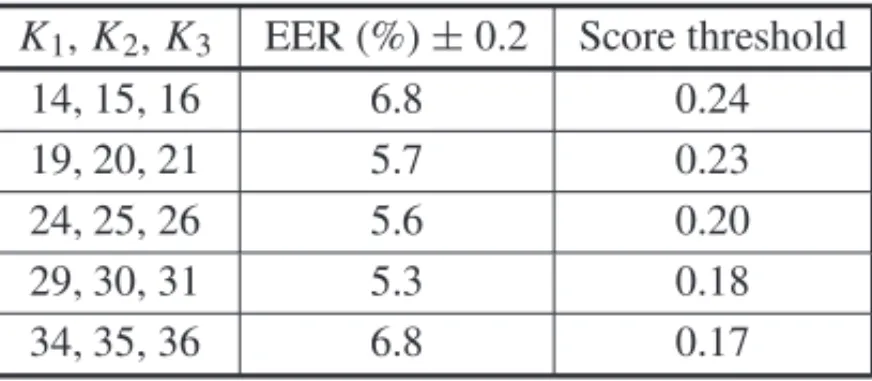
This idea is inspired by the clustering ensemble strategy [15], where the agreement/disagreement between independent clusterings is used to stabilize and improve cluster analysis. Still according to the theory of clustering ensembles, diversity of partitions is beneficial. Here, we induce diver-sity by using three different number of prototypes per final score,K1,K2andK3, as indicated in in Table 1, where thresholds were optimised to minimize the EER.
Table 1: EER found with the LZ analysis with quantization – speaker recognition experiment.
K1,K2,K3 EER (%)±0.2 Score threshold
14, 15, 16 6.8 0.24
19, 20, 21 5.7 0.23
24, 25, 26 5.6 0.20
29, 30, 31 5.3 0.18
34, 35, 36 6.8 0.17
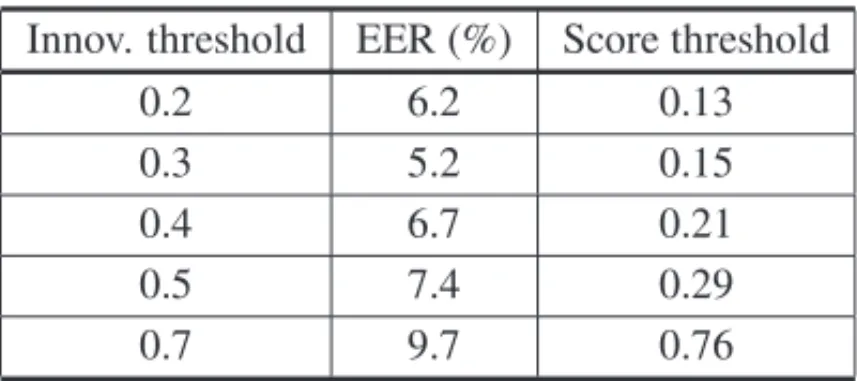
On the other hand, by applying the quantization-less algorithm described in Section 3 to the very same pairs of signals, and by comparing them with the same similarity measure defined in Eq. 4.2, we obtained the results presented in Table 2. Note that, in this case, we must care-fully tuneTI, the innovation threshold, instead of K. Moreover, unlike the quantization based
Though the best result in Table 2 was obtained withTI = 0.3, by finely tuningTI to 0.27, a
slightly better result was obtained: E E R = 5.1%. By contrast, in [16], with the very same database, set of features (conventional MFCC) and biometric protocol (one utterance from first Session per enrollment, versus one utterance from second Session per interrogation), the mini-mum EER obtained with a classic pattern recognition approach was≈7.5%.
Table 2: EER found with the LZ analysis without quantization – speaker recognition experiment.
Innov. threshold EER (%) Score threshold
0.2 6.2 0.13
0.3 5.2 0.15
0.4 6.7 0.21
0.5 7.4 0.29
0.7 9.7 0.76
Concerning the computational burden of both methods, any non-naive implementation of the MLZ Algorithm for comparing a reference stringx1m and a test string y1n, in the worst scenario wherex1mandy1ndon’t have any common element, only requiresnmcomparisons. By contrast, the K-NN algorithm needs the computation of all the distances between themreference points and thentest points, ind-dimensional space (in this cased =19). This computation requires the execution ofdmnsubtractions and power (multiplication) operations. The squared root operation is not necessary since it does not affect the sorting of such values. After the computation of the mndistances, it is necessary to sort then groups ofmdistances each. Since an efficient sorting algorithm formvalues (e.g. quicksort) has time complexity of O(mlog(m)), for then groups we haveO(mnlog(m)). Therefore, the LZM is for the worst case O(mn)(being usually much lower) whereas a classical approach with similar performance results needs two steps, the first one isO(dmn)and the second oneO(mnlog(m)).
5.2 Experiment with accelerometer signals (Healthcare)
The second set of experiments reported here is concerned with remote healthcare. More pre-cisely, we analyze signals from an accelerometer attached to a subject under surveillance. These accelerometer signals are publicly available at the UCI repository [17] and was used in [18]. In our experiments, we use only signals from the belt sensor, as if it was registered by a single smartphone carried by the subject under medical surveillance. Moreover, we only gather three subsets of signals, corresponding to the following classes: (i) ‘patient falling’: 5 signals; (ii) ‘patient lying’: 5 signals; (iii) ‘patient walking’: 5 signals.
Accordingly, the only signal processing technique applied to these multivariate signals is nor-malization of signal power for each channel (i.e. each orthogonal direction).
The experiment is carried out as follows: a single data file, out of 15, is taken as a reference. For instance, lets assume that a signal from ‘subject falling’ is arbitrarily taken as a single ref-erence for ‘falling’ event. Then a second signal is randomly taken, playing the role of an online recording during actual patient monitoring. These two signals are compared, providing a score.
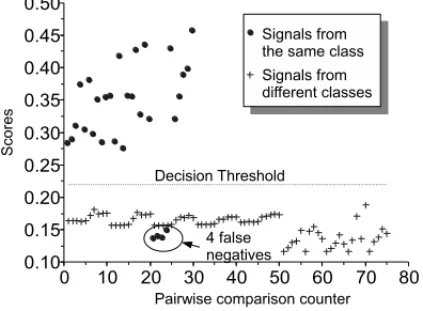
A detection threshold is adjusted to the point where false negative and false positive rates are the same (EER), and if a score from two signals from the same class is under this threshold, a ‘false negative’ event is computed. On the other hand, if a score from two signals from different classes lies above it, a ‘false positive’ is computed. In this case, both approaches (i.e. with and without quantization) yielded the same stable result: only 4 false negatives, all in class ‘walking’.
As a matter of fact, the very same 4 recordings from class ‘walking’ were scored below thresh-old in both approaches, as illustrated in Figure 2, from one single but representative run of the method with quantization. Moreover, we consider this result as a stable one, because it remains unchanged for a wide range of parameter values, namely: (i) Quantization with a single K-means run: 4 false negatives withKfrom 8 to 23, and (ii) Without quantization: same 4 false negatives withTI ranging from 0.08 to 1.2.
Figure 2: Comparison scores and classification of accelerometer signals – 30 cross-comparisons of signals from the same class, 75 cross-comparisons of signals from different classes, only 4 false negative results.
6 CONCLUSION
the new similarity measure uses the number of parsed segments instead of usual likelihood based measures used in pattern recognition.
Another contribution of this work was a method for continuously valued signal analysis through LZ algorithm. Thus, two strategies were studied, one based on signal space discretization inK prototypes, through the K-Means algorithm, and another based on direct comparison between segments of multivariate signals in a continuous space.
To illustrate the usefulness of the proposed tools, two sets of experimental results were presented, namely: one on speaker identity verification (behavioural biometrics) and another on healthcare signal detection. All experiments yielded promising performances. As for experiments on bio-metrics with a single K-Means run, the EER of approximately 7.6% coincides with the one obtained through a classic pattern recognition method [16], for the same database and set of features. Besides, by using a strategy inspired in clustering ensembles, MLZ with and with-out quantization yielded almost the same result (E E R ≈5.2%). For the experiments with ac-celerometer signals (Healthcare) consistent detection results were obtained, with errors in only 4 out of 105 cross-comparisons for a wide range of algorithm parameters.
In both approaches, with and without quantization, either the number of prototypes,K, or the innovation threshold, TI, were empirically tuned. Finding an optimum value for both K and
TI, and studying the relationship between signal statistics and optimization is a matter for future
research.
RESUMO.O conhecido m´etodo proposto por Abraham Lempel and Jacob Ziv para a an´alise de complexidade de sequˆencias de s´ımbolos foi modificado, neste trabalho, para comparar semelhanc¸as entre suas sequˆencias. Essa modificac¸˜ao permitiu a criac¸˜ao de um novo crit´erio
que pode substituir medidas de verossimilhanc¸a em algumas aplicac¸˜oes no campo do reco-nhecimento de padr˜oes. Adicionalmente, no sentido de permitir a comparac¸˜ao de padr˜oes multivariados em espac¸os cont´ınuos, n´os tamb´em apresentamos uma adaptac¸˜ao simples do m´etodo de Lempel-Ziv a sinais regularmente amostrados no tempo. Para ilustrar a utilidade
das ferramentas propostas, dois conjuntos de resultados experimentais s˜ao apresentados e discutidos, a saber: um em verificac¸˜ao de locutor (biometria) e outro em detecc¸˜ao de sinais no monitoramento m´edico. Os dois experimentos produziram resultados promissores. Al´em disso, quando comparados a m´etodos tradicionais de reconhecimento de padr˜oes, as novas
abordagens produziram desempenhos superiores, em termos de taxas de erros iguais nos ex-perimentos de identificac¸˜ao de orador.
Palavras-chave:an´alise de sinais, complexidade de Lempel-Ziv, modelagem sem a prioris.
REFERENCES
[1] A. Lempel & J. Ziv. On the complexity of an individual sequences.IEEE Trans. on Inform. Theory,
[2] C.E. Shannon. A mathematical theory of communication.Bell System Technical Journal,27(1948), 379–423 and 623–656.
[3] T.M. Cover & J.A. Thomas. Elements of Information Theory, John Wiley & Sons, Inc. (2006).
[4] P. Johansen. Pattern recognition by data compression, inProceedings of the 9th Scandinavian Con-ference on Image Analysis, (1995), 1131–1137.
[5] F. Kaspar & H.G. Schuster. Easily calculable measure for the complexity of spatiotemporal patterns.
Physical Review A,36(2) (1987), 842–848.
[6] L.V. Batista & M.M. Meira. Texture Classification Using the Lempel-Ziv-Welch Algorithm. InC Science Advances in Artificial Intelligence – SBIA 2004, Lecture Notes in Computer Science, 3171, (2004), 444–453.
[7] J.M. Amig´o, J. Szczepanski, E. Wajnryb & M.V. Sanchez-Vives. Estimating the Entropy Rate of Spike Trains via Lempel-Ziv Compplexity.Neural Computation,16(2004), 717–736.
[8] L. Sarlabous, A. Torres, J.A. Fiz, J. Gea, J.B. Galdiz & R. Jane. Multistate Lempel-Ziv (MLZ) index interpretation as a measure of amplitude and complexity changes. InConf Proc IEEE Eng Med Biol Soc., (2009), 4375–4378.
[9] M. Aboy, R. Hornero, D. Ab´asolo & D. Alvarez. Interpretation of the lempel-ziv complexity measure in the context of biomedical signal analysis.IEEE Trans. Biomed. Eng.,53(11) (2006), 2282–2288.
[10] M. Aboy, D. Cuesta-Frau, D. Austin & P. Mic ´o-Tormos. Characterization of Sample Entropy in the Context of Biomedical Signal Analysis. In Proceedings of the 29thConf. Proc. IEEE Eng. Med. Biol. Soc., (2007), 5942–5945.
[11] Y. Gao, I. Kontoyiannis & E. Bienenstock. Estimating the Entropy of Binary Time Series: Methodol-ogy, Some Theory and a Simulation Study.Entropy,10(2008), 71–99.
[12] P.E. Rapp, T.A.A. Watanabe, P. Faure & C.J. Cellucci. Nonlinear Signal Classification.International Journal of Bifurcation and Chaos,12(6) (2002), 1273–1293.
[13] J. Ziv & A. Lempel. Compression of Individual Sequences via Variable-Rate Coding.IEEE Trans. on Inform. Theory,IT-24(1978), 530–536.
[14] S. Theodoridis & K. Koutroumbas. Pattern Recognition (2nd Ed.), Elsevier Academic Press (2003).
[15] A. Strehl & J. Ghosh. Cluster Ensembles – A Knowledge Reuse Framework for Combining Multiple Partitions.Journal of Machine Learning Research,3(2002), 583–617.
[16] J. Montalv˜ao & M.R.R. Araujo. Is masking a relevant aspect lacking in MFCC? A speaker verification perspective.Pattern Recognition Letters,33(16) (2012), 2156–2165.
[17] Blake, C.J. Merz. UCI repository of machine learning databases.
[18] B. Kaluza, V. Mirchevska, E. Dovgan, M. Lustrek & M. Gams. An Agent-based Approach to Care in Independent Living, In Proceedings of the First international joint conference on Ambient