Article
J. Braz. Chem. Soc., Vol. 25, No. 2, 264-270, 2014. Printed in Brazil - ©2014 Sociedade Brasileira de Química 0103 - 5053 $6.00+0.00
A
*e-mail: [email protected]
Determination of Metal Associated with Proteins of Wheat Seed Samples After
Sequential Extraction Procedure
Leila M. Bittencourt,a Diogo A. P. D. Lana,a Adriano M. de C. Pimenta,b Agenor V. dos Santos,b Ana Paula F. Gonçalves,b Rodinei Augustic and Letícia M. Costa*,a
aDepartamento de Química, ICEx, bLaboratório de Venenos e Toxinas Animais,
Departamento de Bioquímica e Imunologia and cLaboratório de Espectrometria de Massas,
Departamento de Química, ICEx, Universidade Federal de Minas Gerais, Av. Antônio Carlos 6627, Pampulha, 31270-901 Belo Horizonte-MG, Brazil
Este trabalho foi conduzido para estudar a distribuição de Cu, Fe, Mn e Zn nas frações proteicas de amostras de trigo submetidas a um procedimento de extração sequencial. Maiores concentrações dos elementos foram determinadas na fração extraída com tampão Tris-HCl contendo 1% de dodecil sulfato de sódio (SDS). As frações da amostra de trigo obtidas após o procedimento de extração foram analisadas por eletroforese em gel de poliacrilamida unidimensional (1D SDS-PAGE) e as bandas de proteínas foram tratadas para quantificar os metais por espectrometria de absorção atômica em forno de grafite (GF AAS). Desta forma, foi possível associar os metais Cu, Fe, Mn e Zn às bandas proteicas de peso molecular específico. As frações proteicas da amostra de trigo foram analisadas por espectrometria de massas por tempo de vôo acoplada à ionização dessortiva de matriz por laser (MALDI-TOF-MS), após procedimento de digestão proteica, identificando-se as proteínas lipid transfer e grain softness, sendo esta última possivelmente associada ao metal manganês.
This work was initially conducted to study the distribution of Cu, Fe, Mn and Zn in the protein fractions of wheat sample subjected to sequential extraction procedure. The highest metal concentrations were determined in the fraction extracted with Tris-HCl buffer containing 1% sodium dodecyl sulfate (SDS). The fractions of wheat sample obtained after the extraction procedure were analyzed by one-dimensional polyacrylamide gel electrophoresis (1D SDS-PAGE) and protein bands were treated to quantify Cu, Fe, Mn, and Zn by graphite furnace atomic absorption spectrometry (GF AAS). Metals were associated to protein bands of specific molecular weight, determined using a standard protein. The protein fractions were also analyzed by matrix-assisted laser desorption ionization time-of-flight mass spectrometry (MALDI-TOF-MS) after a typical protein digestion protocol, identifying lipid transfer protein and grain softness, the latter being possibly associated to Mn.
Keywords: metalloprotein, wheat, GF AAS, MALDI-TOF-MS/MS, 1D SDS-PAGE
Introduction
Wheat seed (Triticum aestivum L.) has been used as a source of energy due to its high level of proteins, which awakes interest to relate the quantity, composition or structure of the protein for total quality of the cereal.1,2
Wheat seed contains around 60-70% carbohydrate, 12% protein (gluten), 2% lipids, ascorbic acid, vitamin E, and others. It is worth to emphasize that wheat is rich in essential nutrients as iron, manganese and zinc.3
Trace elements, as metal ions, play an important role in biological activity. Most metal ions are bonded to specific proteins or enzymes and exert their effects as an inherent part of the active or structural center of the proteins,4 responsible for many metabolic processes, such
as energy conversion in photosynthesis and respiration, gene regulation and expression and catalytic processes.5
It is estimated that approximately one-third of all proteins and enzymes contain metals.6 Although metals can
atomic radius, electromagnetic interaction and electrostatic forces) are associated to metalloproteins.7
Copper can be found into several proteins, such as superoxide dismutase and cytochrome oxidase. It is also needed for iron transportation and it is involved in the connective tissue synthesis, lipid metabolism and antioxidant protection.8
Iron has a vital catalytic and structural role in numerous metalloproteins. Under physiological conditions (pH 6.7-7.2), iron can be oxidized, catalyzing the formation of highly damaging oxygen radicals.9 Manganese is a
cofactor of the enzyme pyruvate carboxylase and it seems to act also as a non-specific activator for several enzymes, such as superoxide dismutase, glycosyl transferases, arginase and others. Moreover, manganese is required for protein and fat metabolism, healthy nerves and immune system as well as for sugar regulation.10 Metals, such as zinc, are
generally non-covalently complexed by proteins,11 but plays
a vital role in the function of more than 300 enzyme classes, in stabilizing the DNA double helix and in the control of gene expression.12 Moreover, the majority of hydrolytic
enzymes contain non-exchanging zinc.13
For metalloproteins studies, it should be applied an efficient extraction procedure for metals and proteins. The solid-liquid sequential extraction has been used by some authors.14-17 The sample is treated with different extraction
solutions, increasing the scope and ability to interact with the organic matrix.
A solid-liquid sequential extraction procedure was used to quantify selenium in proteins from Brazil nuts (Bertholletia excelsa) using five different extraction conditions: (1) 0.05 mol L–1 NaOH, (2) 0.05 mol L–1 HCl, (3) 0.05 mol L–1
Tris-HCl buffer, pH 8.0, (4) 1% sodium dodecyl sulfate (SDS) in Tris-HCl, pH 8.0 and (5) hot water at 60 ºC. Size exclusion chromatography (SEC) with UV and inductively coupled plasma mass spectrometry (ICP-MS) detection has been used. In the application of capillary electrophoresis coupled to ICP-MS, selenomethionine was confirmed as the primary species incorporated to nut proteins. The results obtained with SEC-UV-ICP-MS and CE-ICP-MS were able to confirm the association of selenium to proteins in nut extracts.15
The determination of elements in each fraction obtained by sequential extraction procedure can be executed by absorption spectrometry and/or emission18-19
and the separation of proteins in these fractions are usually performed by electrophoresis20 and/or reversed phase
high-performance liquid chromatography (RP-HPLC).21
The proteins can be identified by matrix-assisted laser desorption ionization time-of-flight mass spectrometry (MALDI-TOF-MS/MS)22 and electrospray ionization
tandem mass spectrometry (ESI-MS/MS).23 Thus,
metalloprotein studies allowed the integration of traditional analytical chemistry with inorganic and biochemistry.7
Here we report the determination of Cu, Fe, Mn and Zn in each protein fraction obtained for wheat seed samples after a sequential extraction procedure. The metals were determined by graphite furnace atomic absorption spectrometry (GF AAS). In addition, we performed the separation of protein by one-dimensional polyacrylamide gel electrophoresis (1D SDS-PAGE) in each fraction, resulting in the identification of metals and proteins using GF AAS and MALDI-TOF-MS, respectively.
Experimental
Instrumentation
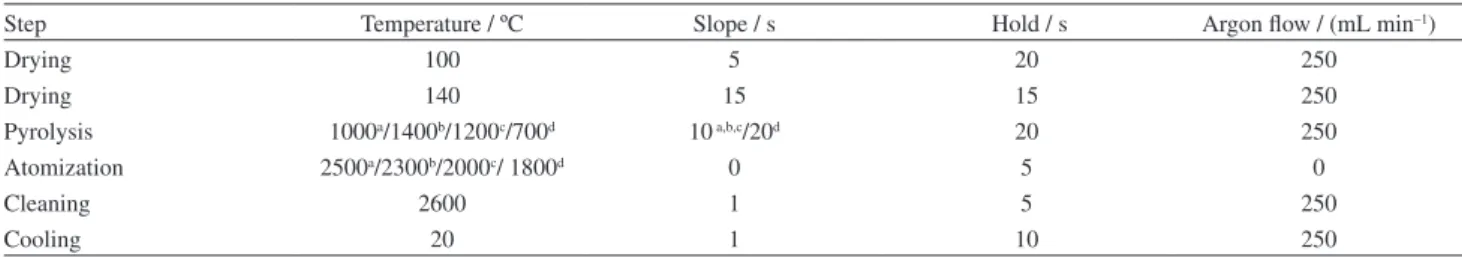
Quantification of Cu, Fe, Mn and Zn were made by Perkin-Elmer AAnalyst 400 atomic absorption spectrometer (Norwalk, USA), equipped with graphite furnace and a deuterium lamp for background correction. Hollow cathode lamps (Perkin-Elmer) of Cu (λ = 324.75 nm, slit = 2.7/0.8 nm), Fe (λ = 248.33 nm, slit = 1.8/1.35 nm), Mn (λ = 279.48 nm, slit = 1.8/0.6 nm) and Zn (λ = 213.86 nm, slit = 2.7/1.8 nm) were used. All measurements were based on integrated absorbance values and the operating conditions were those recommended by the manufacturer. The instrumental conditions for the spectrometer and the heating programs for the graphite tube atomizer are presented in Table 1. Argon 99.996% (White Martins, Belo Horizonte, MG, Brazil) was used as purge gas.
Table 1. GF AAS heating program for the determination of Cu, Fe, Mn and Zn in wheat seed samples
Step Temperature / ºC Slope / s Hold / s Argon flow / (mL min–1)
Drying 100 5 20 250
Drying 140 15 15 250
Pyrolysis 1000a/1400b/1200c/700d 10a,b,c/20d 20 250
Atomization 2500a/2300b/2000c/ 1800d 0 5 0
Cleaning 2600 1 5 250
Cooling 20 1 10 250
The electrophoresis system was composed of a reservoir and an electrophoresis power supply (both from GE Healthcare, USA). Electrophoresis was performed at 120 V and 30 mA. The identification of proteins by MALDI-TOF-MS was performed with a Autoflex III (Bruker Daltonics, Germany) mass spectrometer controlled by the software FlexControl 3.0. The pulsed nitrogen laser was operated at 337 nm, and ions were directly desorbed from the sample surface into the time-of-flight mass analyzer.
Sample
The wheat seed samples were purchased at a local market. The samples were ground in a blender and passed through a plastic sieve (1mm). The sample was stored in decontaminated plastic bottles.
Sequential extraction procedure
The sample pretreatment protocol is a sequential denaturating extraction procedure and it was carried out based on previous data from the literature. This procedure can increase the availability of metals into the fractions, as the metal-protein bonding is probably broken.15 Around
2.0 g of the ground sample was used to the solid-liquid sequential extraction. First, a volume of 10 mL of a mixture of methanol and chloroform (1:2 v/v) (Merck, Darmstadt, Germany), was added to the sample to remove lipids. Then, 10 mL of each extraction solution, in five successive steps, in the following order, was added: (1) 0.05 mol L–1 NaOH,
(2) 0.05 mol L–1 HCl, (3) 0.05 mol L–1 Tris-HCl buffer,
pH 8.0, (4) 1% SDS in Tris-HCl, pH 8.0 and (5) hot water at 60 ºC. The tubes containing the sample and the extract solutions (1)-(4) were shaken (Gil, Brazil) for 60 min and centrifuged for 10 min at 3500 rpm. For hot water extraction (5), 10 mL of deionized water was added to the sample residue and the mixture was kept at 60 ºC for 30 min. For extracts purification (1)-(4), proteins were precipitated with 80% acetone (– 14 °C, 30 min). After centrifugation (10 min, 3500 rpm), the supernatant was eliminated and the residue dissolved in 2 mL of 0.05 mol L–1 Tris-HCl buffer,
pH 8.0. The fractions obtained after sequential extraction procedure were stored at –20 °C until analysis.
Determination of the total metals concentration
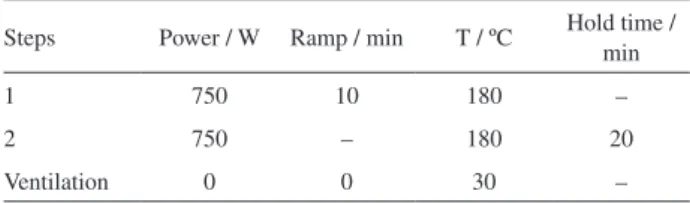
The acid digestion of wheat seed sample was performed in a cavity microwave oven system equipped with perfluoroalcoxi (PFA) vessels and pressure and temperature sensors (Ethos, Milestone, Sorisole, Italy). The heating program is presented in Table 2.
A microwave-assisted acid digestion was performed using 6.0 mL of concentrated HNO3 (Merck, Darmstadt,
Germany) and 1.0 mL of 30% m/m H2O2 (Merck,
Darmstadt, Germany) added over 200 mg of each sample, which were accurately and directly weighted in the microwave vessels. The colorless digestates were filled up to 20.0 mL using deionized water.
This procedure was applied to the raw wheat seed samples (total digestion) and to the residues obtained after sequential extraction procedure.
Determination of total protein concentration
Total protein concentration in all fractions of the extraction procedure was determined according to the Bradford method,24,25 using bovine serum albumin (Merck,
Darmstadt, Germany) as standard.
Analytical calibration curves were built up in the range of 1-100 µg µL–1, after adequate dilution of the standard
stock solution containing 500 µg µL–1 of bovine serum
albumin. The samples were diluted using deionized water. For each dosage, it was used 160 µL of sample containing the protein extract and 40 µL of the Bradford reagents (BioAgency, São Paulo, Brazil). After 20 min, absorbance measurements were made at 595 nm using a Hach DR4000 spectrophotometer.
Gel electrophoresis
The fractions obtained after the sequential extraction procedure (solutions of NaOH, HCl, Tris-HCl, Tris-HCl buffer containing SDS and hot water) were analyzed using gel electrophoresis to separate the proteins of each fraction. For this, sodium dodecyl sulphate-polyacrilamide gel electrophoresis (SDS-PAGE) was carried out using a separation gel composed by acrylamide (12.5% m/v) and N,N ’-methylene bisacrylamide (0.4% m/v) at pH 8.8, containing 10% (m/v) SDS, N,N’,N,N’-tetramethylethylenediamine (TEMED) and 10% (m/v) ammonium persulfate. Tris-HCl buffer solution (1.0 mol L–1) was used to adjust the pH
in the separation gel. The gel plate dimensions were: 10 cm (height) × 10.5 cm (width). The samples were diluted Table 2. Microwave heating program for raw and residual wheat seed samples
Steps Power / W Ramp / min T / ºC Hold time / min
1 750 10 180 –
2 750 – 180 20
in a solution containing 0.05 mol L–1 Tris–HCl (pH 6.8),
13.6% (m/v) glycerol, 2.7% (m/v) SDS and 5.4% (v/v)
β-mercaptoethanol. Protein marker was applied in a separate line of the gel, in order to allow the estimation of the molar masses of the separated proteins. It was used a standard with 12 proteins in a range of 3.5-200 kDa (Invitrogen, USA). As soon as the electrophoretic run finished, the gel was stained with 1% (m/v) of Coomassie Brilliant Blue (CBB) G-250 for 1 h. The excess of CBB G-250 was removed using a destaining solution, prepared with deionized water, methanol and acetic acid (Merck, Darmstadt, Germany) in a 6:3:1 (v/v/v) ratio, respectively.
Determination of Cu, Fe, Mn and Zn associated to proteins
The protein bands (6.0 to 100 kDa) were cut from the gel with a scalpel and subjected to acid digestion. For this, the gel containing the bands of interest was weighted directly into the reagent vessels. It was added 500 µL of concentrated HNO3 and the mixture was heated on hot plate
until total solubilization. In sequence, it was added 1.5 mL of ultrapure water and the samples were stored in a freezer until GF AAS analysis. Blank solutions were also prepared using pieces of the gel without protein bands. Samples and blank solution were prepared in triplicate.
Identification of proteins using MALDI-TOF-MS
For protein identification by MALDI-TOF-MS, the proteins must be broken into smaller peptides. Thus, protein extracts obtained after the sequential extraction were digested following a typical protocol.26 For this purpose,
100 µg of protein was dissolved into 20 µL of solution containing 0.4 mol L–1 NH
4HCO3, 8 mol L
–1 urea and
2 mol L–1 thiourea. Then, 5 µL of 45 mmol L–1 DTT solution
was added and kept incubated at 50 °C for 15 minutes. After cooling to room temperature, 5 µL of 100 mmol L–1
iodoacetamide was added and kept for 15 minutes at room temperature. Then 130 µL of deionized water was added. Finally, trypsin diluted solution (20 ng µL–1) was added
and incubated at 37 °C for 24 hours. Trifluoroacetic acid was then added to a final concentration of 0.046% to stop reaction.
For the identification of proteins by MALDI-TOF-MS, a solution of α-cyano-4-hydroxycinnamic acid in acetonitrile (0.1% TFA) in water (2:1 v/v) was used as matrix. 0.5 µL matrix solution and 0.5 µL of sample solution were mixed on the stainless-steel MALDI sample target and allowed to dry. Calibration was performed with a standard peptide mixture with the m/z range of approximately 3000 (BioRad, Marnes-la-Coquette, France). All spectra obtained by the
fragmentation of peptides with their respective m/z protein values were correlated with the MASCOT database.
Search parameters are shown as follows: type of search, peptide mass fingerprint; enzyme, trypsin; fixed modification, carbamidomethylation (Cys); variable modifications, oxidation (Met); mass values, monoisotopic; peptide charge state, 1+; maximum missed cleavages, 1 and peptide mass tolerance of 0.05% Da (50 ppm). A p-value of less than 0.05 was considered significant and used to generate the results.
Results and Discussion
Determination of total metal concentration
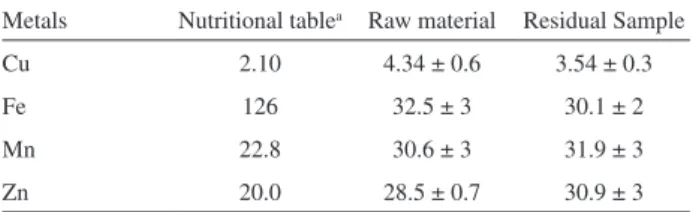
Total concentration of metals was determined by GF AAS in the raw wheat seed samples and in the residue obtained after the sequential extraction procedures. Results are presented in Table 3.
From Table 3 it is possible to observe that the sample is rich in micronutrients Fe, Mn and Zn and has a lower concentration of Cu. The results are in agreement with the data presented at the Brazilian Table of Food Composition (TACO)3. It should be pointed out that the TACO results
were obtained from wheat flour samples while the results presented in this work were obtained from wheat seed samples.3 It is possible to note that the concentration of
some elements (Mn and Zn) is higher in the residue than in the original sample, suggesting contamination during the extraction procedure.
Cu, Fe, Mn and Zn determination in each fraction
The concentrations of Cu, Fe, Mn and Zn were determined in each fraction after the sequential extraction procedure, as shown in Table 4.
The sequential extraction used in this work is suitable to the wheat sample because it is rich in proteins from the glutelin group, preferably extracted with alkaline solutions. Table 3. Cu, Fe, Mn and Zn concentration, in µg g-1, in the raw wheat
material and in the residual fraction after sequential extraction procedure (n = 3)
Metals Nutritional tablea Raw material Residual Sample
Cu 2.10 4.34 ± 0.6 3.54 ± 0.3
Fe 126 32.5 ± 3 30.1 ± 2
Mn 22.8 30.6 ± 3 31.9 ± 3
Zn 20.0 28.5 ± 0.7 30.9 ± 3
In addition, besides making use of solutions that increase the efficiency of protein extraction, the sequential procedure extracts distinct groups of proteins according to their different solubilities in water and molecular weights 14,27
For wheat sample, the highest concentrations of Cu, Fe, Mn and Zn were predominantly observed in the solution containing 1% SDS in Tris-HCl buffer, pH 8.0. This is a denaturizing solution and the chemical bond between metals and proteins were possibly broken, increasing the availability of the metals for measurements. It is not possible to say precisely in which protein a given metal is connected, but its concentration can be measured in this medium, indicating its presence. According to Sussulini et al.,28 the addition of surfactants as SDS in buffer
solutions, can cause rupture of membranes, lipid solubility and solubilization of membrane proteins, increasing the extraction of metals.
It is noteworthy that only Mn was found in high concentration in the hot water fraction, which suggests the presence of this element connected to proteins soluble in water, possibly with lower molecular weights.29
The concentrations of the elements in all fractions (including the residual) were compared with the total concentrations obtained after microwave-assisted acid digestion (Table 3 and 4). In the sequential extraction of samples, the recovery of Cu, Fe, Mn and Zn was approximately 96, 100, 115 and 116 %. The element concentration in the residue is high, when compared to the other fractions. However, despite to the low levels of metals in the fractions, it was possible to quantify and to associate them with the proteins.
Determination of total protein concentration
The results for total protein concentration in each fraction of the extraction procedure are shown in Table 5, after Bradford method.
According to Table 5, high levels of total protein were found in the fraction extracted with hot water at 60 °C and subsequently in the fraction extracted with Tris-HCl buffer.
It can be observed that despite the higher levels of total protein found in the fraction extracted with water, it was not observed the presence of Fe and Zn in this fraction, which may indicate that water did not extract proteins bonded to these metals. Similar results were also observed by Magalhães and Arruda.25
Determination of Cu, Fe, Mn and Zn associated proteins
The quantitative determination of Cu, Fe, Mn and Zn in protein bands from wheat seed sample (Figure 1) was performed using GF AAS after acid digestion, as previuosly described.
According to Figure 1, it is found that the extraction performed with NaOH solution caused the degradation of proteins. So, it was not possible to subject this fraction to protein digestion procedure. Hence, it was concluded that the fractions extracted with Tris-HCl buffer, 1% SDS in Tris-HCl and water contained the highest number of protein bands.
The proteins in NaOH solution were degraded during the extraction procedure and their visualization in Figure 1 is not possible. But, it should be pointed out that the total protein measurements by the Bradford method were realized. Total protein can be detected since in this methodology, Coomassie Brilliant Blue G-250 dye binds in arginine, histidine, phenylalanine, tryptophan and tyrosine present in proteins or peptides.30
Table 6 shows the results for Cu, Mn and Zn determination in protein bands of wheat seed samples. Table 4. Cu, Fe, Mn and Zn concentrations, in µg g–1, in each fraction resulting from the application of the sequential extraction procedure on the wheat
sample (n = 3)
Fraction Cu Fe Mn Zn
NaOH 0.21 ± 0.01 0.54 ± 0.03 0.081 ± 0.01 0.26 ± 0.01
HCl < LOQa 0.54 ± 0.03 0.79 ± 0.09 0.37 ± 0.05
Tris-HCl buffer 0.11 ± 0.00 0.68 ± 0.00 0.36 ± 0.04 0.33 ± 0.01
1% SDS in Tris-HCl 0.25 ± 0.01 0.75 ± 0.05 1.1 ± 0.1 0.78 ± 0.1
H2O 0.050 ± 0.01 < LOQa 1.2 ± 0.06 < LOQa
a LOQ: limit of quantification for Cu, Fe, Mn and Zn were 0.05; 0.09; 0.06 and 0.04 µg g–1, respectively.
Table 5. Total protein concentration, in mg g–1, in fractions of wheat seed
sample submitted to sequencial extraction procedure (n = 3)
Fractions Concentration
NaOH 1.79 ± 0.3
HCl 1.79 ± 0.4
Tris-HCl 4.54 ± 1
1% SDS in Tris-HCl 2.32 ± 0.1
As shown in Table 6, it can be noted a remarkable presence of Cu, Mn and Zn in the protein bands. Thus, it is possible to say, for example, that the protein with molecular weight of about 21.5 kDa extracted with HCl solution is probably associated with Cu, Mn and Zn. These metals could be part of the protein structure enabling its function. This association can also be made for other protein bands.
Protein identification by MALDI-TOF-MS/MS
The protein fractions obtained after the sequential extraction procedure were digested following the protocol
for protein digestion.26 Two proteins were identified in
the fraction extracted with Tris-HCl buffer; lipid transfer protein and grain softness protein.
The lipid transfer protein (LTP) identified has a nominal mass of 10057 Da and an isoelectric point (PI) value of 8.20. According to Guerbette et al.,31 the LTPs are all soluble
and relatively small, containing from 91 to 95 amino acid residues and their isoelectric point is basic. They all possess eight cysteine residues located at conserved positions which form four disulfide bonds.31-33
LTP was shown to increase the activity of the acetyl-CoA oxidase enzyme in in vitro tests, suggesting involvement in β-oxidation, possibly in the regulation of the catabolism of lipid storage and facilitate the transfer of lipids between membranes. LTPs have a potential role in plant growth and development, including embryogenesis, germination and pollen-pistil interaction.34,35
The grain softness protein identified has a nominal mass of 15608 Da and PI of 8.07. According to Massa and Morris,36 grain softness protein-1 (GSP-1) is a member of
the 2S family of basic and cysteine-rich protein. They are mainly present in the seeds of a variety of plants and play an important role in the natural defenses of plants.
The proteins identified are rich in cysteine and have high affinity for metal ions such as Cd2+, Zn2+ and Cu2+. So, it is
plausible to assume that lipid transfer and grain softness proteins have metals connected to their structures.37,38
According to the results presented in Table 6, it is possible to observe the presence of manganese in the protein band of approximately 14.4 kDa. This indicates that this element may be associated or even strongly bonded to the grain softness protein whose molecular weight corresponds to 15.6 kDa.
The fraction extracted with Tris-HCl buffer showed high concentrations of iron (Table 4) which may indicate the association of this element to both proteins identified.
Conclusions
The wheat seed sample is rich in essential micronutrients, which arouse the interest in studying metalloproteins. Cu, Fe, Mn and Zn were found in the protein fraction extracted from wheat seed samples using Tris-HCl buffer with 1% SDS. Therefore, it is reasonable to conclude that some protein bands from wheat samples, with specific molecular weights, are associated with Cu, Fe, Mn, and Zn. It was also possible to identify the lipid transfer and grain softness proteins in the fraction extracted with Tris-HCl buffer solution. Finally, the results indicated the possibility of the association of Mn with the grain softness protein.
Figure 1. Electrophoretic gels of the fractions of wheat sample obtained after sequential extraction procedure with: (b) NaOH; (c) HCl; (d) Tris-HCl; (e) 1% SDS in Tris-HCl and (f) H2O. Standard proteins with their respective molecular masses are presented in the first column (a).
Table 6. Determination of Cu, Mn and Zn by GF AAS, in each protein band associated with the wheat sample (Figure 1)
Molecular mass of proteins / kDa
Fractions
HCl Tris-HCl buffer
1% SDS in Tris-HCl H2O
14.4 – Mn – –
21.5 Cu, Mn, Zn – – –
32.5 Mn, Zn – – –
40.0 – Mn – –
50.0 – Mn Mn Mn
55.4 – Mn Cu –
66.3 Cu,Mn, Zn Cu, Mn, Zn Mn –
97.4 – – – Cu, Mn
Acknowledgements
The authors gratefully acknowledge the Department of Biochemistry and Immunology the availability for analysis of proteins and Conselho Nacional de Desenvolvimento Científico e Tecnológico (CNPq) for their financial support (process number 478076-09).
References
1. Guo, X.; Yao, H.; Food Chem. 2006, 98, 90.
2. Bean, S. R.; Lookhart, G. L.; J. Chromatogr. A2000, 881, 23. 3. Núcleo de Estudos e Pesquisas em Alimentação (NEPA) and
Universidade Estadual de Campinas (UNICAMP); Tabela Brasileira de Composição de Alimentos (TACO), version 2, 2nd
ed., ed. da UNICAMP: Campinas, SP, Brasil, 2006.
4. Gao, Y.; Chen, C.; Zhang, P.; Chai, Z.; He, W.; Huang, Y.; Anal. Chim. Acta2003, 485, 131.
5. Garcia, J. S.; de Magalhães, C. S.; Arruda, M. A. Z.; Talanta
2006,69, 1.
6. Gao, Y.; Chen, C.; Chai, Z.; J. Anal. At. Spectrom. 2007, 22, 856.
7. Lima, P. M.; Neves, R. C. F.; Santos, F. A.; Perez, C. A.; Silva, M. O. A.; Arruda, M. A. Z.; Castro, G. R.; Padilha, P. M.; Talanta
2010, 82, 1052.
8. Gomez-Ariza, J. L.; Arias-Borrego, A.; Garcia-Barrera, T.;
J. Chromatogr. A 2006, 1121, 191.
9. Brewer, T. M.; Marcus, R. K.; J. Anal. At. Spectrom.2007, 22, 1067.
10. Michalke, B.; Schramel, P.; J. Anal. At. Spectrom. 2004, 19, 121.
11. Raad, A.; Ploselli, B.; Munro, C.; Thomas-Oates, J.; Feldmann, J.; Electrophoresis2009, 30, 303.
12. Shi, W. X.; Chance, M. R.; Curr. Opin. Chem. Biol.2011, 15, 1.
13. Williams, R. J. P.; da Silva, J. J. R. F.; Coord. Chem. Rev. 2000,
200, 247.
14. Naozuka, J.; Oliveira, P. V.; J. Braz. Chem. Soc. 2007, 18, 1547. 15. Kannamkumarath, S. S.; Wrobel, K.; Wuilloud, R. G.; Talanta
2005, 66, 153.
16. Klose, C.; Schehl, B. D.; Arendt, E. K.; J. Cereal Sci.2009, 49, 83.
17. Gonçalves, A. M.; Fernandes, K. G.; Ramos, L. A.; Cavalheiro, E. T. G.; Nóbrega, J. A.; J. Braz. Chem. Soc. 2009, 20, 760.
18. Verbi, F. M.; Arruda, S. C. C.; Rodriguez, A. P. M.; Arruda, M. A. Z.; J. Biochem. Biophys. Meth. 2005, 62, 97.
19. Mounicou, S.; Meija, J.; Caruso, J.; Analyst2004, 129, 116. 20. Chassaigne, H.; Brohee, M.; Norgaard, J. V.; van Hengel, A. J.;
Food Chem. 2007, 105, 1671.
21. Lopez, M. C. G.; Garcia-Canas, V.; Alegre, M. L. M.;
J. Chromatogr. A 2009, 1216, 7222.
22. Natarajan, S. S.; Krishnan, H. B.; Lakshman, S.; Garrett, W. M.;
Anal. Biochem. 2009, 394, 259.
23. Tastet, L.; Schaumloffel, D.; Bouyssiere, B.; Lobinski, R.;
Talanta 2008, 75, 1140.
24. Bradford, M. M.; Anal. Biochem.1976, 72, 248.
25. de Magalhães, C. S.; Arruda, M. A. Z.; Talanta2007, 71, 1958. 26. Kinter, M.; Sherman, N. E. In Protein Sequencing and
Identification Using Tandem Mass Spectrometry; United States
of America, Wiley-Interscience, 2000, ch. 6.
27. Agboola, S.; Ng, D.; Mills, D.; J. Cereal Sci.2005, 41, 283. 28. Sussulini, A.; Garcia, J. S.; Mesko, M. F.; Moraes, D. P.; Flores,
E. M. M.; Perez, C. A.; Arruda, M. A. Z.; Microchim. Acta2007,
158, 173.
29. Kannamkumarath, S. S.; Wuilloud, R. G.; Caruso, J.; J. Agr. Food Chem. 2004, 52, 5773.
30. Noble, J. E.; Bailey, M. J.; Methods Enzymol. 2009, 463, 73. 31. Guerbette, F.; Grosbois, M.; Jolliot-Croquin, A.; Kader, J. C.;
Zachowski, A.; Biochem.1999, 38, 14131.
32. Boutrot, F.; Guirao, A.; Alary, R.; Joudrier, P.; Gautier, M. F.;
Biochim. Biophys. Acta2005, 1730, 114.
33. Kader, J. C.; Annu. Rev. Plant Physiol. Plant Mol. Biol.1996,
47, 627.
34. Kuppannan, K.; Albers, D. R.; Schafer, B. W.; Dielman, D.; Young, S. A.; Anal. Chem.2011, 83, 516.
35. Han, G. W.; Lee, J. Y.; Song, H. K.; Chang, C. S.; Min, K.; Moon, J.; Shin, D. H.; Kopka, M. L.; Sawaya, M. R.; Yuan, H. S.; Kim, T. D.; Choe, J.; Lim, D.; Moon, H. J.; Suh, S. W.;
J. Mol. Biol.2001, 308, 263.
36. Massa, A. N.; Morris, C. F.; J. Mol. Evol.2006, 63, 526. 37. Kindness, A.; Sekaran, C. N.; Feldmann, J.; Clin. Chem. 2003,
49, 1916.
38. Maltez, H. F.; Tagle, M. V.; de la Campa, M. D. F.; Sanz-Medel, A.; Anal. Chim. Acta 2009, 650, 234.
Submitted: July 7, 2013