Article
J. Braz. Chem. Soc., Vol. 26, No. 8, 1718-1724, 2015. Printed in Brazil - ©2015 Sociedade Brasileira de Química 0103 - 5053 $6.00+0.00
A
*e-mail: [email protected]
Influence of the Lipid Phase Removal on the Quantification of Cu, Fe and Zn Bound
to Proteins from Golden Flaxseed (
Linum usitatissimum L.
)
Deyse de Brito Marthe, Rodinei Augusti and Letícia Malta Costa*
Departamento de Química, ICEx, Universidade Federal de Minas Gerais, 31270-901 Belo Horizonte-MG, Brazil
The analysis of metals bound to proteins requires careful sample preparation. Experimental procedures involved in this area should be developed aiming to retain the metal species bound to the protein structure. Some pre-fractionation steps are commonly used and in many cases it is necessary to disrupt the lipid-protein interaction by performing lipid removal before protein extraction. This paper presents a systematic investigation on the influence of using hexane, chloroform and methanol neat or in sequence to remove the lipid fraction in golden flaxseed
(Linum usitatissimum L.), before extracting the protein phase using Tris-HCl buffer solution
for analysis of Cu, Fe and Zn bound to proteins. The results showed that the organic solvent used has a strong influence on the determination of these metals. With hexane, the total protein content and Cu, Fe and Zn concentrations in Tris-HCl phase were higher than those found using methanol:chloroform (1:2 v/v).
Keywords: metal, protein, sample preparation, lipid phase removal, organic solvent
Introduction
Metallic elements are found in living organisms, often at trace and ultra-trace levels, playing a vital role in biological functions.1 If a metal is bound to proteins, its function strongly depends on the interaction between them.2 All metalloproteins and their enzymatic metabolites can be identified from the complete sequencing of several genomes. This fact allows the comprehensive examination of the role of essential and toxic metals to human health.3
The challenges to determine the metals bound to proteins are related to the nature of the chemical interaction between them and the low level at which trace elements are usually present in biological matrices.4 The integrity of the metal-protein bond can be kept with an effective sample preparation protocol, followed by a suitable characterization procedure.5
Identification and quantification of metals and proteins in biological systems can be successfully performed when using an efficient separation technique, a highly sensitive detector for the element quantification and a molecule-specific detector based on mass spectrometry, using tandem mass spectrometry (MS/MS) for more accurate characterization.6 In general, metals are bound to proteins
covalently and their preservation is essential to establish reliable information in the metalloproteomics area, with no denaturizing sample preparation procedures.7 The success of this approach critically depends on the stability of the metal-protein complex, which cannot be broken. The sample preparation procedures should be carefully applied to avoid protein denaturing.8
Special attention should be given when fat-rich matrices are used in studies involving metals bound to proteins. There is a need for simpler methods that are able to directly identify and quantify metals and proteins in lipophilic and non-lipophilic extracts.
present high nutritional value, associated to the soluble fibers and protein content, besides lignine and α-linolenic
acid.10-13 Seeds are the primary basis for human sustenance and they are the repository of the genetic potential of crop species and their varieties resulting from the continuous improvement and selection over time.14
Experimental
Instrumentation
Acid digestion was performed in a cavity microwave oven with pressure and temperature control sensors (Ethos 1, Milestone, Sorisole, Italy) with maximum nominal pressure and power of 100 bar and 1000 W, respectively.
The determination of Cu, Fe, and Zn in the digested solutions from solid residues was performed on a fast sequential (FS) flame atomic absorption spectrometer (FAAS) (Varian AS 240FS, Mulgrave, Australia), equipped with a deuterium lamp for background correction. Measurements were obtained by hollow cathode lamps (HCL) in wavelengths and slits of 324.7 nm and 2.7/0.8 nm (Cu), 248.3 nm and 1.8/1.35 nm (Fe), and 213.8 nm and 2.7/1.8 nm (Zn), respectively.
Copper, Fe, and Zn measurements in Tris-HCl protein extracts and in the lipid phase solutions were performed on a Perkin-Elmer graphite furnace atomic absorption spectrometer (AAnalyst 600, Norwalk, USA), equipped with Zeeman correction. The measurements were based on peak areas and a sample volume of 20 µL was injected into the graphite tube with a L’vov platform by the AS 800 autosampler. Argon was used as the purge gas at 250 mL min-1. Copper, Fe and Zn hollow cathode lamps were used at the same wavelengths described for FS FAAS.
UV measurements (Bradford method)15 were conducted using an UV-Vis spectrophotometer (Carry100, Varian, Mulgrave, Australia). The measurements were performed at 595 nm.
Gel electrophoresis was performed on a mini tank (GE Healthcare Bio-Sciences, Uppsala, Sweden) under constant running conditions of 100 V for 3 h. The gels were staining in Multifunction Shaker TS-2000A VDRL (Norwalk, USA) with the Coomassie Blue dye. Then, the gels were scanned on an ImageScanner III apparatus (GE Healthcare Bio-Sciences, Uppsala, Sweden).
Sample, reagents and solutions
Golden flaxseed was purchased at a local market in Belo Horizonte, Minas Gerais State, Brazil. The samples were ground and dried at 40 oC for 12 h and kept in a desiccator.
Hexane, chloroform and methanol (Synth, São Paulo, Brazil) were used in the lipid phase removal step. A Tris-HCl buffer solution, used for protein extraction, was prepared with hydrochloric acid (Merck, Darmstadt, Germany) and tris-hydroxymethylaminomethane (Synth, São Paulo, Brazil).
The protein content in the extract was determined by the Bradford approach, which makes use of the Brilhant Coomassie Blue G-250 dye (Bio Agency, São Paulo, Brazil) and bovine serum albumin (67 kDa) (Sigma-Aldrich, Saint Louis, USA) as protein standard.
Analytical-grade nitric acid and hydrogen peroxide (Merck, Darmstadt, Germany) were used to digest the samples in a cavity microwave oven.
Permanent chemical modification was performed with 1000 mg L-1 of Ir, Ru and Rh (Fluka, Buchs, Switzerland) for graphite tubes. Standards for the calibration curves were prepared from 1000 mg L−1 of Cu, Fe and Zn stock solutions (Titrisol® Merck, Darmstadt, Germany).
Polyacrylamide gel electrophoresis (PAGE) was carried out using Bromophenol Blue dye, sodium dodecyl sulfate (SDS), glycine and a standard solution containing a mixture of the following proteins: phosphorylase b (97 kDa), albumin (66 kDa), ovalbumin (45 kDa), carbonic anhydrase (30 kDa), trypsin inhibitor (20.1 kDa) and α-lactalbumin
(14.4 kDa) (Sigma Aldrich, St. Louis, USA). The drying and staining steps were performed by adding phosphoric acid, ethanol and ammonium sulfate (Synth, São Paulo, Brazil), followed by Brilhant Coomassie Blue G-250 dye (Sigma Aldrich, Saint Louis, USA), respectively.
All solutions were prepared using distilled deionized water (Milli-Q, 18.2 MΩ cm-1, Millipore, Billerica, USA).
Extraction procedures
Lipid extraction
Protein extraction with Tris-HCl
The lipid-free sample and the lipid-phase extract (item “lipid extraction”) were submitted to the Tris-HCl buffer solution protein extractor. To both parts, 15.0 mL of 0.50 mol L-1 of Tris-HCl buffer at pH 7.2 was added. The mixture was kept under stirring at 200 rpm for 1 h at 25 ºC. Next, the mixture was centrifuged for 10 min at 3500 rpm. For the lipid-free sample, the supernatant was collected and the solid residue submitted to microwave-assisted-acid digestion. For the lipid phase extract, the aqueous phase was collected. The organic phase was evaporated (oil fraction) for further microwave-assisted-acid digestion and also the final solid residue. Copper, Fe and Zn were analyzed in all fractions generated.
Sequential protein extraction procedure
A sequential solid-liquid extraction method, adapted from the literature,16 was evaluated. After lipid extraction, described in the “lipid extraction” item, around 2.0 g of the lipid-free samples were sequentially treated with four extraction solutions: deionized water, 0.50 mol L-1 of NaCl solution, ethanol:water (70:30 v/v) and 0.50 mol L-1 ofNaOH solution. In each step, 10.0 mL of the extraction solution was added and the mixture was kept under stirring for 1 h at 200 rpm. Then, the samples were centrifuged for 10 min at 1800 rpm and the supernatants recovered from each fraction were filled up to 15.0 mL and stored in a freezer until analysis.
Microwave-assisted-acid digestion
Approximately 200 mg of the lipid-free sample, final solid residue and oil fraction (item “protein extraction with Tris-HCl”) were digested in a cavity microwave oven using 7.0 mL of nitric acid solution (50% v/v) plus 1.0 mL of hydrogen peroxide. After that, the solutions were filled up to 25.0 mL with distilled-deionized water. The microwave heating program was performed in three steps: 10 min to reach 180 ºC; 20 min at 180 ºC; and ventilation until room temperature.
Determination of the protein content by the Bradford methodology
To obtain analytical curves, six standard solutions were prepared using a bovine serum albumin stock solution (0-0.2 µg µL-1). Then 5.0 mL of the Bradford reagent was added to 100 µL of standard solutions and Tris-HCl protein extracts. The solutions were mixed by vortex and analyzed with the UV-Vis spectrophotometer at 595 nm.
Dodecyl sulfate polyacrylamide gel electrophoresis (1D SDS-PAGE)
The 1D SDS-PAGE was performed according to Laemmli.17 For this, it was used 12% separating gel containing 12% m/v ofacrylamide and 0.4% m/v of
N,N’-methylenebisacrylamide at pH 8.8, plus 0.1% m/v SDS, N,N,N’,N’-tetramethylethylenediamine (TEMED) and ammonium 10% m/v persulfate. A 1 mol L-1 Tris-HCl buffer solution was used for pH adjustment. Gel dimensions were 10.0 cm (height) × 10.5 cm (width).
The protein extract obtained from the lipid-free sample in Tris-HCl buffer solution was diluted in a buffer solution containing 125 mmol L-1 Tris-HCl at pH 6.8, 0.002% m/v Bromophenol Blue dye, 4% m/v SDS and 20% v/v of glycerol. The mixture was heated at 95 °C for 5 min. Electrophoresis was performed using 25 mmol L-1 Tris-HCl buffer solution with 192 mmol L-1 glycine and 0.1% m/v SDS at pH 8.3 in the mini tank. The current and voltage were 20 mA and 110 V, respectively. After a run of approximately 3 h, the protein bands were revealed following the procedure described by Wray et al.18
Results and Discussion
Protein content in flaxseed sample
lipid-free sample and the lipid-phase extract were put in contact with Tris-HCl buffer for protein extraction.
Aliquots of 100 µL of the protein extracts from Tris-HCl and sequential procedure were used to measure the protein content by the Bradford method.15 The total protein content was determined and the results are shown in Figure 1 and Table 1.
Figure 1 shows that the protein concentrations in the lipid-free sample extracts were 2.9 ± 0.1, 1.30 ± 0.07, and 0.73 ± 0.06 mg g-1 for hexane, methanol:chloroform (1:2 v/v) and hexane followed by methanol:chloroform (1:2 v/v), respectively. In turn, the protein concentrations in the lipid phase extracts were 0.85 ± 0.01, 2.2 ± 0.1 and 2.3 ± 0.1 mg g-1 for hexane, methanol:chloroform (1:2 v/v) and hexane followed by methanol:chloroform (1:2 v/v), respectively. In the extracts from lipid-free samples, the highest protein content was obtained using hexane, whereas in the lipid-phase extracts the lowest value was obtained with hexane. For hexane, the total protein content (the sum of lipid phase extract and lipid-free sample) accounted almost 4 mg g-1, the highest value observed.
Since the organic solvents can be used to protect or to denaturate proteins, it is advisable to choose a solution able to preserve the interaction between proteins and metals during lipid extraction. According to Asakura et al.21 and Dennison,22 the extension of protein denaturation is strongly affected by organic solvents. For one group of solvents,
including alcohols and ketones, the denaturation extension is directly proportional to the protein concentration. For solvents such as toluene and chloroform, only a destabilizing effect was observed, while for solvents such as formamide and pentane, there was no denaturation effect noted for any protein concentration. Thus, according to the authors, due to its nonpolar characteristic, hexane is classified as an organic solvent suitable to preserve the protein-metal bond without protein denaturizing effects.
With protein denaturation, hydrophobic regions are exposed, increasing protein concentration in the organic fractions. Protein extraction using methanol and chloroform was lower when compared to hexane in the lipid-free sample, because both are denaturing solvents. On the other hand, hexane is a non-denaturing solvent, which promotes high protein content in the Tris-HCl aqueous solution.
After lipid removal using hexane, it is also possible to see in Figure 1 that golden flaxseed has a total protein content of about 4 mg g-1, obtained after a mild extraction procedure. This result confirms that flaxseed is a food with high nutritional value based on its protein content.19
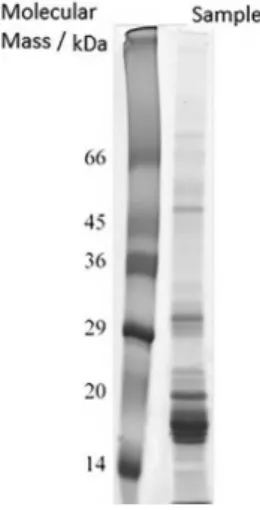
The profile of the lipid-free sample extract in Tris-HCl buffer solution was analyzed by 1D SDS PAGE. Figure 2 shows the electrophoretic profile.
In Figure 2 it is possible to see that bands were predominant in the range of 14 to 29 kDa. Other bands are visualized between 29 and 36 kDa, and up to 45 kDa. Less intense bands are distinguished below 14 kDa and above 66 kDa.
Oomah and Mazza23 observed the presence of four predominant polypeptides in flaxseed products between 14, 24, 25, and 34 kDa, as well as, a number of other minor bands. Marcone et al.24 reported five bands with molecular weight of 14.4, 24.6, 30.0, 35.2 and 50.9 kDa related to globulins. Peptides of 24.6 kDa were reported to be basic sub-units, while others of 30.0 and 35.2 kDa were identified as acid sub-units.25
Some classes of proteins in golden flaxseed were separated after the successive extraction procedure. The results are presented in Table 1.
Table 1. Protein contents in each fraction from sequential extraction after lipid extraction with hexane, methanol:chloroform (1:2 v/v) and hexane and methanol:chloroform (1:2 v/v), sequentially (n = 3)
Lipid-phase extraction Fraction
Water ± sd / (mg kg-1) NaCl ± sd / (mg kg-1) Ethanol ± sd / (mg kg-1) NaOH ± sd / (mg kg-1)
Hexane 2.9 ± 0.1 2.9 ± 0.1 0.18 ± 0.01 2.4 ± 0.1
Methanol:chloroform 0.55 ± 0.02 1.7 ± 0.1 0.25 ± 0.01 2.5 ± 0.1
Hexane plus methanol:chloroform 0.91 ± 0.02 1.3 ± 0.1 0.28 ± 0.01 2.5 ± 0.1
sd: standard deviation.
0 1 2 3 4
Hexane Hexane/Methanol:Chloroform Methanol:Chloroform
Protein Content / (mg g )-1
Organic Solvent
Lipid Phase Extract Lipid-free Sample
In Table 1 it can be seen that the protein content in water and NaCl fractions was approximately 3 mg g-1 when only hexane was used for lipid phase extraction, whereas using methanol and chloroform the values varied from 0.5 to 1.7 mg g-1. The values obtained in the sequential addition (hexane/methanol:chloroform) were quite similar to those obtained with methanol:chloroform alone, demonstrating the influence of these polar organic solvents on the denaturizing process of the protein and, as described before, promoting low protein content in the aqueous solution.
When using ethanol and NaOH the results obtained were similar among the three procedures. Ethanol and NaOH are also denaturant reagents, and it does not matter if hexane, methanol or chloroform is previously applied for oil phase removal; all the proteins become inactive in those solutions and they will be equally solubilized in the extract.
When hexane was used for lipid fraction extraction, albumins, globulins and glutelins were the predominant proteins detected in the water, NaCl and NaOH fraction, respectively, accounting for 34, 34 and 29% of the protein content extracted by the sequential procedure, while prolamin accounted for 2%.
This prevalence was also reported by Oomah and Mazza19 for flaxseed samples. The authors determined 25% albumin, 30% glutelin and 42% of globulin as the major fractions. For prolamin, only 4% was soluble in the ethanol fraction, due a higher lipophilic interaction with the matrix.23
Comparing the results obtained in water and NaCl fraction with those obtained after Tris-HCl extraction (Figure 1), it is possible to see similar results for hexane lipid-phase extraction, showing the non-denaturing characteristic of this solvent.
Cu, Fe and Zn determination in golden flaxseed samples
The metal distribution was evaluated in the lipid-free sample, in the supernatant obtained after Tris-HCl extraction and in the lipid-phase extract (after solvent evaporation). As previously described, microwave-assisted-acid digestion was performed on the solid residue from the lipid-free sample and in the lipid-phase extract. Limit of detection (LOD) was calculated from independent blank solutions using the mean concentration and the value resulting from the multiplication of the standard deviation and t-test at 95% confidence level.26 The minimum detectable amounts were 0.0081, 0.041 and 0.056 mg kg-1 for Cu, Fe and Zn, respectively. Similar to the LOD, the limit of quantification (LOQ) was calculated by the sum of the average concentration and ten times the standard deviation.26 For Cu, Fe and Zn the values were 0.032, 0.11 and 0.096 mg kg-1, respectively. Afterward, Cu, Fe and Zn were quantified by AAS, and for graphite furnace atomic absorption spectrometry (GFAAS) measurements, after establishment of the best permanent chemical modifier for each element. The results are shown in Table 2.
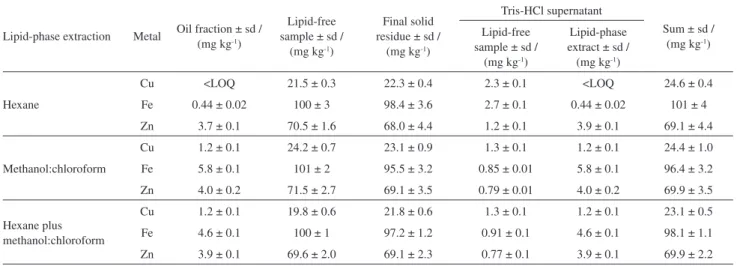
The results in Table 2 show that the concentrations of Cu, Fe and Zn in the solid residue were approximately 23, 98, and 69 mg kg-1, respectively, independently on the solvent used for the lipid-phase extraction procedure. In the supernatant, obtained after Tris-HCl buffer solution extraction, the metals concentrations were higher for solutions obtained after hexane lipid extraction, indicating the benefits of using a non-denaturing organic solvent. On the other hand, for the oil fraction the concentrations were higher for Cu and Zn for extracts obtained after lipid extractions using denaturing organic solvents. In this case, the metal-protein interaction is disrupted and the metal’s affinity for polar solvent increases, thus, remaining at this fraction. It is also possible to see in Table 2 that the Tris-HCl buffer solution has a limited influence on the metal extraction, since the concentration is not very high and the extraction procedure was performed at room temperature to preserve metal-protein bonds. Under this experimental condition it is possible to estimate the metal bound to proteins in flaxseed samples.
The oil fraction, lipid-free sample and the final solid residue, as previously stated, were submitted to microwave acid digestion. As the protein extraction was performed in lipid-free sample, the concentration of Cu, Fe and Zn was compared to the sum of the values obtained from the solid residue and Tris-HCl supernatants (Table 2).
The values are not statistically different at 95% confidence level, applying the t-test, showing good accuracy of the proposed methods for metal extraction. Figure 2. 1D SDS-PAGE electrophoretic profile of the lipid-free sample
The lipid extraction with hexane produced the lowest concentration of the metals in solid residue and Tris-HCl buffer supernatant after protein extraction. This solvent preserved the metal-protein interaction and it was possible to relate the presence of albumins and globulins in the Tris-HCl buffer fraction with Cu, Fe and Zn.
Copper, Fe and Zn were also quantified by AAS in the solutions obtained after successive extraction using water, NaCl solution, ethanol and NaOH. The results are shown in Figure 3.
In Figure 3 it can be seen that all the values obtained in water and NaCl were similar. In water, the results were 0.037, 0.063, 0.13 mg kg-1 for Cu, Fe and Zn, respectively, while in NaCl the values were 0.071, 0.041, 0.17 mg kg-1 for Cu, Fe and Zn, respectively.
The fraction of globulins, extracted with NaOH, contained the highest levels of metals: 0.16, 0.19, 0.13 mg kg-1 for Cu, Fe and Zn, respectively, while for prolamin, extracted with ethanol, contained lower levels
compared to NaOH: 0.082, 0.092, 0.090 mg kg-1 for Cu, Fe and Zn, respectively. Since hexane preserves the metal-protein interaction, it was possible to relate the presence of Cu, Fe and Zn with the proteins in golden flaxseed separated after the successive extraction procedure.
Conclusions
Lipid-phase removal procedure was evaluated using different organic solvents and it was observed that with hexane the protein levels in the lipid-free samples were higher than when using methanol and chloroform. In the lipid-phase extract, protein levels were higher when methanol and chloroform were used instead of hexane. In this case, methanol and chloroform caused protein denaturation and proteins became more soluble in this medium. For metal quantification, the metal-protein interaction can be disrupted by a denaturing solvent. So, higher levels of Cu and Fe in the Tris-HCl solution were obtained in the lipid-phase removal procedures using hexane. For Zn, this situation was reversed, and the highest values were obtained in the lipid-phase extract. In the Tris-HCl extracts, it was possible to relate the presence of albumins and globulins with the metals Cu, Fe and Zn in the lipid-free sample after hexane extraction. In the sequential procedure, the quantification of Cu, Fe and Zn was possible in all fractions, with ethanol presenting the lowest values.
Acknowledgements
We thank The Brazilian National Council for Technological and Scientific Development (CNPq), Table 2. Copper, Fe and Zn in oil fraction, lipid-free sample and in the final solid residue after microwave-acid digestion. Metals in Tris-HCl protein extracts and sum of the final solid residue and the Tris-HCl supernatant after protein extraction (n = 3). All the results were determined after lipid extraction with hexane, chloroform:methanol (2:1 v/v) and hexane followed by chloroform:methanol (2:1 v/v)
Lipid-phase extraction Metal Oil fraction ± sd / (mg kg-1)
Lipid-free sample ± sd /
(mg kg-1)
Final solid residue ± sd /
(mg kg-1)
Tris-HCl supernatant
Sum ± sd / (mg kg-1)
Lipid-free sample ± sd /
(mg kg-1)
Lipid-phase extract ± sd /
(mg kg-1)
Hexane
Cu <LOQ 21.5 ± 0.3 22.3 ± 0.4 2.3 ± 0.1 <LOQ 24.6 ± 0.4
Fe 0.44 ± 0.02 100 ± 3 98.4 ± 3.6 2.7 ± 0.1 0.44 ± 0.02 101 ± 4
Zn 3.7 ± 0.1 70.5 ± 1.6 68.0 ± 4.4 1.2 ± 0.1 3.9 ± 0.1 69.1 ± 4.4
Methanol:chloroform
Cu 1.2 ± 0.1 24.2 ± 0.7 23.1 ± 0.9 1.3 ± 0.1 1.2 ± 0.1 24.4 ± 1.0
Fe 5.8 ± 0.1 101 ± 2 95.5 ± 3.2 0.85 ± 0.01 5.8 ± 0.1 96.4 ± 3.2
Zn 4.0 ± 0.2 71.5 ± 2.7 69.1 ± 3.5 0.79 ± 0.01 4.0 ± 0.2 69.9 ± 3.5
Hexane plus methanol:chloroform
Cu 1.2 ± 0.1 19.8 ± 0.6 21.8 ± 0.6 1.3 ± 0.1 1.2 ± 0.1 23.1 ± 0.5
Fe 4.6 ± 0.1 100 ± 1 97.2 ± 1.2 0.91 ± 0.1 4.6 ± 0.1 98.1 ± 1.1
Zn 3.9 ± 0.1 69.6 ± 2.0 69.1 ± 2.3 0.77 ± 0.1 3.9 ± 0.1 69.9 ± 2.2
sd: standard deviation; LOQ: limit of quantification.
0.00 0.05 0.10 0.15 0.20 0.25
Water NaCl Ethanol NaOH
Metal Concentration / (mg kg
)
-1
Fraction
Cu Fe Zn
Figure 3. Metal concentrations (mg kg-1) in each fraction collected from
Brazilian Federal Agency for Support and Evaluation of Graduate Education (CAPES) for research funds and grants. We are also grateful to Laboratório de Contaminantes Inorgânicos from Laboratório Nacional Agropecuário (LANAGRO/MG, Ministério da Agricultura Pecuária e Abastecimento, Minas Gerais, Brazil) for the experimental support.
References
1. Davidson, T.; Ke, Q.; Costa, M. In Handbook on the Toxicology of Metals,3rd ed.; Nordberg, G. F.; Fowler, B. A., eds.; Academic
Press: Burlington, 2007, p. 79.
2. Tainer, J. A.; Roberts, V. A.; Getzoff, E. D.; Curr. Opin. Chem. Biol.1991, 2, 582.
3. Szpunar, J.; Anal. Bioanal. Chem.2004, 378, 54.
4. Pioselli, B.; Munro, C.; Raab, A.; Deitrich, C. L.; Songsrirote, K.; Feldmann, J.; Thomas-Oates, J.; Metallomics2009, 1, 501. 5. Garcia, J. S.; Magalhães, C. S. D.; Arruda, M. A. Z.; Talanta
2006, 69, 1.
6. Gómez-Ariza, J. L.; García-Barrera, T.; Lorenzo, F.; Bernal, V.; Villegas, M. J.; Oliveira, V.; Anal. Chim. Acta2004, 524, 15. 7. Mounicou, S.; Szpunar, J.; Lobinski, R.; Chem. Soc. Rev.2009,
38, 1119.
8. Nelson, D. L.; Cox, M. M.; Lehninger: Princípios de Bioquímica, 4th ed.; Editora Sarvier: São Paulo, 2006, p. 1636.
9. Sussulini, A.; Garcia, J. S.; Mesko, M. F.; Moraes, D. P.; Flores, E. M. M.; Pérez, C. A.; Arruda, M. A. Z.; Microchim. Acta2007,
158, 173.
10. Rabetafika, H. N.; Remoortel, V. V.; Danthine, S.; Paquot, M.; Blecker, C.; Int. J. Food Sci. Technol.2011, 46, 221.
11. Osborne, T. B.; Mendel, L. B.; J. Biol. Chem.1914, 18, 1. 12. Singh, K. K.; Mridula, D.; Rehal, J.; Barnwal, P.; Crit. Rev.
Food Sci. Nutr. 2011, 51, 210.
13. Lane, K.; Derbyshire E.; Li, W.; Brennan, C.; Crit. Rev. Food Sci. Nutr.2014, 54, 572.
14. http://www.fao.org/investment-in-agriculture/en/ accessed in May 2015.
15. Bradford, M. M.; Anal. Biochem.1976, 72, 248.
16. Naozuka, J.; Oliveira, P. V.; J. Braz. Chem. Soc.2007, 18, 1547. 17. Laemmli, U. K.; Nature1970, 227, 680.
18. Wray, W.; Boulikas T.; Wray, V. P.; Hancock, R.; Anal. Biochem. 1981, 118, 197.
19. Oomah, B. D.; Mazza, G.; Food Chem.1993, 48, 109. 20. Bittencourt, L. M.; Lana, D. A. P. D.; Augusti, R.; Costa, L. M.;
Pimenta, A. M. C.; Santos, A. V.; Gonçalves, A. P. F.; Quim. Nova2012, 35, 1922.
21. Asakura, T.; Adachi, K.; Schwartz, E.; J. Biol. Chem.1978,
253, 6423.
22. Dennison, C. A.; Guide to Protein Isolation, 2nd ed.; Kluwer
Academic Publishers: Dordrecht, 2003.
23. Oomah, B. D.; Mazza, G.; Ind. Crop. Prod.1998, 9, 29. 24. Marcone, M. F.; Kakuda, Y.; Yada, R. Y.; Food Chemistry1998,
63, 265.
25. Marcone, M. F.; Kakuda, Y.; Yada, R. Y.; Food Chemistry1998,
62, 27.
26. Instituto de Nacional de Metrologia, Normatização e Qualidade Industrial (INMETRO); Orientações sobre Validação de Métodos de Ensaios Químicos, DOQ-CGCRE-008, 2011.
Submitted: March 3, 2015