TeleconnecTion mechanisms of norTheasT Brazil droughTs: modeling and
empirical evidence.
FRed KuchaRsKi
1, dieRK Polzin
2, steFan hastenRath
21
Physics of Weather and climate Group,
international centre for theoretical Physics, trieste, italy
2
department of atmospheric and oceanic sciences,
university of Wisconsin, Madison, Wisconsin
email: [email protected]
Received March 2007 - accepted october 2007
aBsTracT
targeted numerical modelling experimaents are conducted to complement the previous empirical diagnostics of circulation mechanisms leading from sea surface temperature (sst) departures in the equatorial Paciic in January to anomalies in the March-April rainy season of Brazil’s Nordeste. A weak interhemispheric northward directed sst gradient in the atlantic favors a more southerly position of the hydrostatically controlled low pressure trough, embedded in which is the intertropical convergence zone (itcz), which is the main rainbearing system for the nordeste. in addition, anomalously warm waters in the equatorial Paciic in January tend to be followed by Nordeste drought. The underlying chain of causalities has been explored by empirical diagnostics and numerical modelling. during El Nino years, an upper-tropospheric wave train extends from the equatorial eastern Paciic to the tropical north atlantic, affecting the patterns of upper-tropospheric topography and divergence, and hence of vertical motion over the Atlantic. This leads to a weaker meridional pressure gradient on the equatorward lank of the North Atlantic subtropical high, weaker North Atlantic tradewinds, an anomalously far northerly itcz position and thus nordeste drought. the previous empirical diagnostics are overall supported by the modelling experiments.
Keywords: circulation mechanisms, teleconnection, numerical modeling,equatorial Paciic, tropical atlantic, nordeste rainfall
resumo: MecanisMos de teleconeXÕes do noRdeste do BRasil : ModelaGeM nuMÉRica e eVidÊncia ePiRica.
Experimentos especíicos de modelagem numérica foram conduzidos para complementar diagnósticos empíricos realizados anteriormente dos mecanismos da circulação que relacionam anomalias na temperatura das águas supericiais do Pacíico equatorial em janeiro com as chuvas subsequentes em março-abril no Nordeste. Um gradiente térmico fraco (no sentido norte) no Atlântico favorece a uma posição mais meridional do cavado de baixa pressão, controlado hidrostaticamente, dentro do qual se encontra a Zona de Convergência Inter-Tropical (ITCZ), que é a principal fonte de chuvas para o norte do Nordeste. Além disso, águas anomalamente mais quentes no Pacíico equatorial em janeiro tendem a ser seguidas por secas no Nordeste. Pesquisas de caracter diagnóstico e de modelagem tem buscado estabelecer a causalidade nesta cadeia de eventos que interligam anomalias de temperatura nas águas supericiais do mar e precipitação. Durante anos de El Niño, aparece um trem de ondas na alta atmosfera que se estende do Pacíico equatorial oriental até o Atlântico norte tropical, afetando assim os campos de geopotencial e divergência na alta troposfera e, consequentemente, os movimentos ascendentes sobre o Atlântico. Tudo isto conduz a um fraco gradiente meridional de pressão no lado equatorial da célula de alta pressão do Atlântico norte, a alísios mais fracos no Atlântico norte e a um posicionamento da ITCZ mais ao norte, que são associados à seca no Nordeste. Os diagnósticos empíricos concordam com os experimentos de modelagem numérica.
1. inTroducTion
The Northern Nordeste of Brazil (Fig. 1d) has its short rainy season narrowly concentrated around March-april, when the interhemispheric southward gradient of sea surface temperature (SST) is weakest and the Intertropical convergence zone (itcz), which is the main rainbearing system for the nordeste, reaches its southernmost position in the course of the year (hastenrath and lamb, 1977; hastenrath, 1985, p.363-365). In drought years (Secas), the pre-season (October-January) rainfall is scarce, the interhemispheric SST gradient weakened and the basinwide southerly (northerly) wind component enhanced (reduced), all manifestations of an anomalously far northward itcz position (hastenrath and heller, 1977; hastenrath et al., 1984; hastenrath, 1985, p. 293-300; 1995, p. 302-309; Hastenrath and Greischar, 1993a, b; Greischar and hastenrath, 2000). apart from this ensemble of atlantic characteristics, the secas also tend to be preceded by anomalously warm equatorial Paciic waters in January (covey and hastenrath, 1978; curtis and hastenrath, 1995). The equatorial Paciic SST, through circulation processes in the upper troposphere, affect the tropical atlantic sector (Hastenrath, 2000). These empirical indings from a sequence of studies at the university of Wisconsin have been presented in a recent synthesis (Hastenrath, 2006). The objective of the present study is to complement these empirical diagnostics with targeted numerical modeling experiments. section 2 introduces the computer model, section 3 summarizes the empirical background, section 4 presents the numerical modelling experiments, and a synthesis is offered in the closing section 5.
2. The compuTer model
numerical experiments were performed with the international center for theoretical Physics aGcM (sPeedY for Simpliied Parametrizations, primitivE Equation DYnamics) described in detail elsewhere (Molteni, 2003; Kucharski et al., 2006; Herceg Bulic and Brankovic, 2007). The model is based on a hydrostatic spectral dynamical core (Held and Suarez, 1994), and it uses the vorticity-divergence form described by Bourke (1974). The parameterized processes include short- and long-wave radiation, large-scale condensation, convection, surface luxes of momentum, heat and moisture, and vertical diffusion. Convection is represented by a mass-lux scheme that is activated where conditional instability is present, and boundary layer luxes are obtained by stability-dependent bulk formulae. In this study, the AGCM is conigured with eight sigma levels in the vertical and with a spectral truncation at total wavenumber 30. Furthermore, land and ice temperature
anomalies are determined by a simple one-layer thermodynamic model. sPeedY has a model climatology of 1952-92.
In a irst phase, experiments were conducted on the chain of causalities leading from sst anomalies in the eastern equatorial Paciic to the lower-tropospheric pressure distribution over the tropical Atlantic in January. In a second phase, it is desirable to explore the causality chain leading from lower-tropospheric pressure and wind departures in January to the evolution of anomalous pressure and wind ields in April. as sPeedY is an atmospheric general circulation model, it is not designed to handle the atmosphere to ocean forcing. accordingly, we must here be content to explore the forcing of observed sst on the overlying atmosphere in the tropical atlantic sector, in particular the lower-tropospheric pressure and wind ields.
3. empirical BacKground
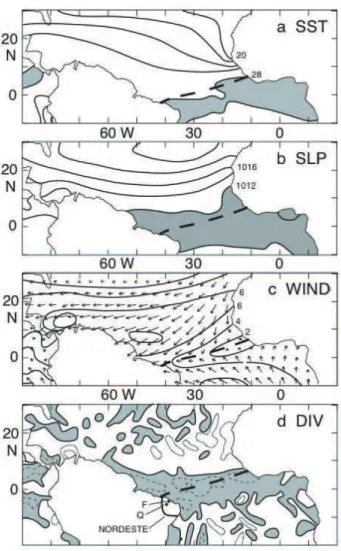
the annual cycle of circulation in the tropical atlantic sector has been comprehensively documented in an atlas based on long-term ship observations (hastenrath and lamb, 1977). Fig. 1 presents a selection of maps for March, based on the comprehensive ocean-atmosphere data set, coads (Woodruff et al., 1987). the map Fig. 1a shows a band of warmest surface waters (>28°c) across the equatorial atlantic. a trough of lowest pressure (Fig. 1b) sits broadly over the warmest surface waters. embedded in the low pressure trough is the conluence between the Northeast trades and the cross-equatorial airstream from the southern hemisphere (Fig. 1c). Also embedded in the low pressure trough is the zone of largest convergence (Fig. 1d), the intertropical convergence zone (itcz). From september onward, the interhemispheric sst contrast decreases, and the complex of sst maximum, low pressure trough, and itcz, shift southward, reaching a southernmost position around March-april. the itcz is the major rainbearing system for the Nordeste and thus determines the timing and narrow concentration of the rainy season. after april, the waters of the tropical north atlantic warm, the interhemispheric sst gradient steepens, and the complex of sst maximum, low pressure trough and itcz migrate northward, away from the nordeste.
figure 1 - surface circulation over the equatorial atlantic and eastern
Paciic, March 1958-97.
(a) sea surface temperature , with isotherm spacing of 2 °c and with area above 28°c shaded;
(b) sea level pressure, with isobar spacing of 2 mb, and with area below 1012 mb shaded;
(c) resultant wind direction and speed, with isotach spacing of 2 ms-1;
(d) divergence with isoline spacing of 5 x l0-6 s-1, and convergence
shaded. Bold solid line encloses Northeast Brazil (Nordeste), and F and Q denote the stations Fortaleza and Quixeramobim.
in addition to such ensemble of characteristics in the tropical atlantic sector, the dRY events also tend to be preceded by anomalously warm waters in the eastern equatorial Paciic in January (Covey and Hastenrath, 1978; Curtis and Hastenrath, 1995). an exploration of the underlying mechanisms (curtis and hastenrath, 1995) showed that in the evolution towards a DRY event, the Atlantic tradewinds weaken anomalously from January to March, and that due to the concomitantly weakened wind forcing the surface waters of the tropical north atlantic warm anomalously through april. this sets the scene for an anomalously steep interhemispheric northward sst gradient,
stronger southerly (weaker northerly) wind component, and thus anomalously far northward ITCZ position and deicient nordeste rainfall.
this exploration (curtis and hastenrath, 1995) raises the question: what causes the weakened North Atlantic tradewinds during Paciic warm events? Early theoretical and modeling studies (egger, 1977; opstegh and Van den dool, 1980; Webster, 1981; Hoskins and Karoly, 1981; Horel and Wallace, 1981; nobre and Moura, 1984; reviews in hastenrath, 1985, p. 266-283; 1995, p. 282-288) suggested a role of the upper troposphere in large-scale linkages. These studies stimulated the notion of “atmospheric bridge” (lau and nath, 1996; Klein et al., 1999; alexander et al., 2002). the issue of the nceP-ncaR 40-year Reanalysis (Kalnay et al., 1996) opened the prospect of an empirical evaluation. an evaluation for WaRM as compared to COLD Paciic waters in January (Hastenrath, 2000) revealed in the upper-tropospheric topographies a wave train from the equatorial Paciic to the tropical North Atlantic; the associated pattern of departures in upper-tropospheric low and divergence entails diminished subsidence on the equatorward lank of the surface north atlantic subtropical high. this serves to decrease the pressure there, which weakens the meridional pressure gradient and thus the north atlantic tradewinds. the further consequences of weak North Atlantic tradewinds following Paciic WARM January are known from the earlier study. Our indings (Curtis and Hastenrath 1995; Hastenrath 2000) are supported by later papers (Nobre and Shukla 1996; Enield and Mayer 1997; Klein et al. 1999: alexander et al. 2002; Giannini et al. 2004).
Figs. 2, 3, and 4 place the chain of causality recognized in the three studies (covey and hastenrath, 1978; curtis and hastenrath, 1995; hastenrath, 2000) into context. For the analysis presented in Fig. 2 the WaRM ensemble consists of the years 1958, 1966, 1969, 1970, 1973, 1983, 1987, 1988, 1992, 1995; and the COLD ensemble of the years 1963, 1965, 1967, 1968, 1971, 1974, 1975, 1976, 1985, 1989. For the analysis presented in Fig. 3 the WARM ensemble consists of the years 1958, 1966, 1969, 1970, 1973, 1980, 1983, 1987, 1988, 1992; and the cold ensemble of the years 1950, 1955, 1956, 1957, 1968, 1971, 1974, 1976, 1985, 1989. For details reference is made to the recent review (hastenrath, 2006).
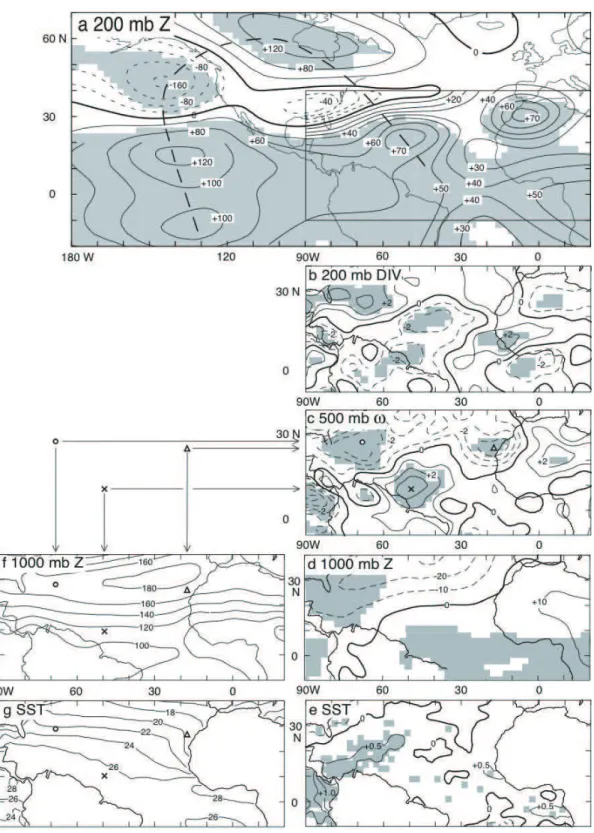
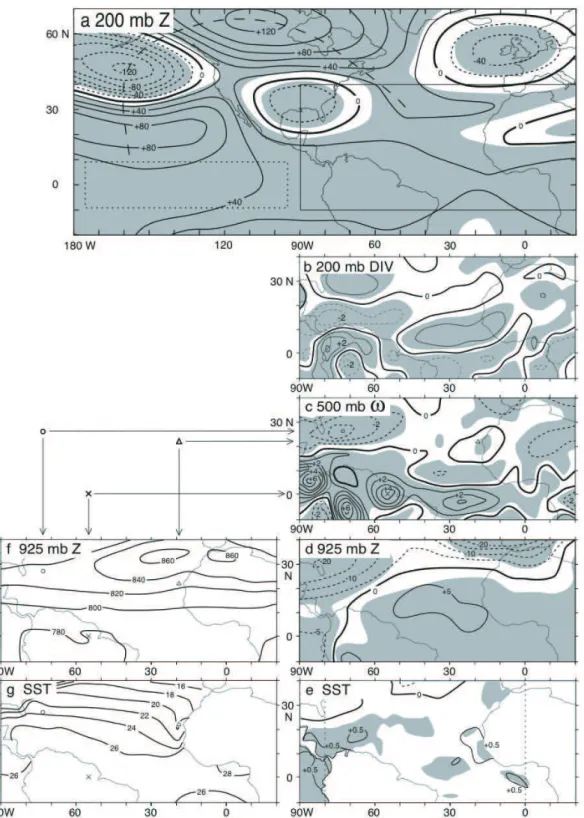
figure 2 - Empirical analyses of January ields of differences between ten-year ensembles of Paciic WARM minus COLD (a, b, c, d, e), and of 1958-97 mean conditions (f, g). the difference maps shown are of (a) 200 mb topography, with isoline spacing of 40 gpm (geopotential meters) poleward of 20°n, 20 gpm equatorward of 20°n, and 10 gpm for domain inside rectangle and thin dashed lines indicating negative values; heavy
dashed line highlights wave train from equatorial Paciic to tropical North Atlantic; rectangle encloses domain shown in the maps (b) to (g); (b)
200 mb divergence with isoline spacing of 1 x 10⁻⁶ s-1 and dashed lines indicating negative values; (c) 500 mb omega vertical motion, with isoline spacing of 10-4 mb s-1 and dashed lines indicating negative values or upward motion; (d) 1000 mb topography with isoline spacing of 20 gpm and
dashed lines indicating negative values. the atlantic 1958-97 mean maps are of (f) 1000 mb topography with isoline spacing of 20 gpm; and (g) sst with isoline spacing of 2°c. open circle, triangle, cross, and accompanying arrows serve to identify extrema in the difference map (c) and to
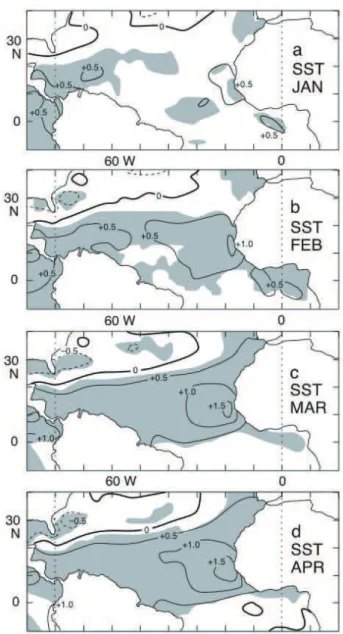
figure 3 - empirical analyses of the patterns of atlantic sst differences
between ten-year ensembles of Paciic January WARM minus COLD, for (a) January, (b) February, (c) March, and (d) April. Thick solid line denotes zero, isoline spacing is 0.5°C, and thin dashed lines denote
negative values. shading indicates areas for which the difference is
signiicant at the 5% level according to t-test. Straight dotted lines
enclose domain covered in Figs. 4 and 6. concordant with the upper-tropospheric divergence
(Fig. 2b) is the mid-tropospheric vertical motion (Fig. 2c). comparison with the map of long-term mean 1000 mb topography (Fig. 2f) shows that subsidence is reduced on the equatorward side of the north atlantic subtropical high, and ascending motion weakenend in the realm of the near-equatorial trough. this serves to decrease the 1000 mb topography in the North and to raise it in the South, during the Paciic WARM as compared to COLD years (Fig. 2d), resulting in greatly weakened meridional pressure gradient. Fig. 2e should be compared to Fig. 2g: the largest warm differences are located to the north of the band of warmest surface waters in the long-term mean. the seasonal evolution of atlantic patterns for WaRM as compared to COLD Paciic January is presented in Figs. 3 and 4 based on NCEP-NCAR. The SST maps Figs 3a to d bear out positive temperature differences in the tropical north Atlantic increasing from January through April, which implies a steepening of the interhemispheric southward thermal gradient. the causes and the consequences of these anomalous sst patterns should be considered with reference to the maps in Fig. 4. thus, the anomalous warming of the tropical north atlantic is in large part due to reduced latent heat lux, wind stirring and Ekman pumping (Curtis and Hastenrath, 1995) resulting from the weakened North Atlantic tradewinds (Figs. 4e to h and 4i to l). In turn, the SST anomalies (Figs. 3a to d) hydrostatically affect the pressure ield (Figs. 4a to d).
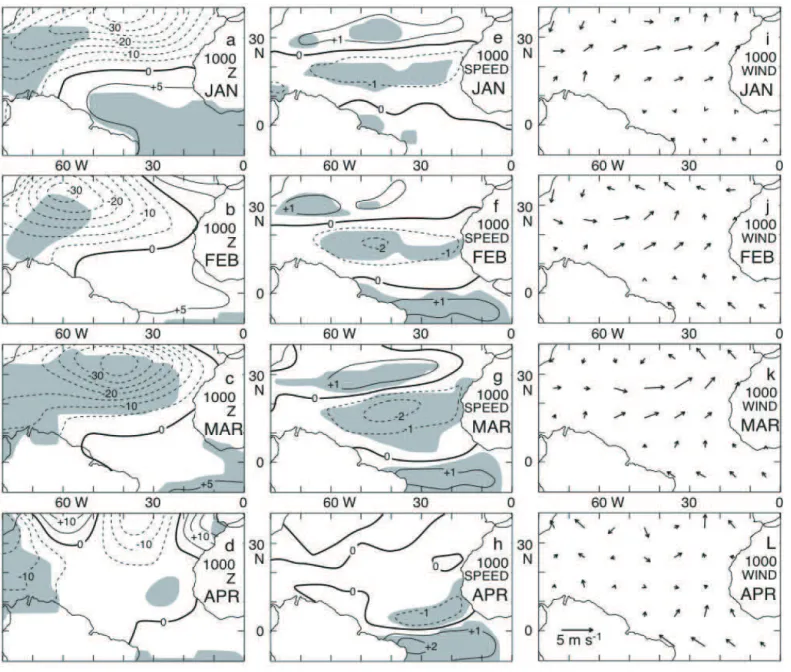
The maps 4a to d show for Paciic January WARM minus COLD ever larger deicits of surface pressure over the tropical North Atlantic from January to March. Such evolution of the surface pressure ield entails a progressive weakening of the meridional pressure gradient in the realm of the north atlantic tradewinds. consistent with this, the total wind speed in the realm of the North Atlantic tradewinds weakens from January to March (Figs. 4e to h). Complementing the maps of total wind speed (Figs. 4e to h) are the maps of differences in resultant wind vector (Figs. 4i to l), illustrating further the progressive weakening of the North Atlantic tradewinds from January to March. The positive differences in the equatorial belt in April (Figs. 4h and l) relect the enhanced cross-equatorial low from the southern hemisphere in response to the steepened meridional pressure gradient (Figs. 4a to d), which in turn is consistent with the steepened temperature gradient (Fig. 3a to d).
In synthesis from Figs. 2, 3 and 4, the weakened lower-tropospheric meridional pressure gradient over the atlantic in January (Figs. 2d and 4a), due to the upper-tropospheric teleconnection from the Paciic, entails weakened North Atlantic tradewinds in January (Figs. 4e and i). As a consequence the tropical north atlantic surface waters warm anomalously (Figs. 3 a to d), which causes a further slackening of the meridional pressure gradient (Figs. 4a to d), which is conducive to further
figure - 4 Empirical analyses of the patterns of differences between ten-year ensembles of Paciic January WARM minus COLD, for January (a, e,
i), February (b, f, j), March (c, g, k), and April (d, h, l). The Atlantic maps shown are of 1000 mb topography (a, b, c, d) with isoline spacing of 1
m; surface resultant wind speed (e, f, g, h) with isoline spacing of 1 ms-1; and resultant wind vector (i, j, k, l) with indicated scaling of 10 degrees latitude/longitude for 5 ms-1. Thick solid lines denote zero, and thin dashed lines negative values. Shading indicates areas for which the difference
is signiicant at the 5% level according to t-test.
A reviewer kindly called our attention to a recent article (Souza et al., 2005) with complementary indings: unfavorable for Nordeste rainfall the joint occurrence of anomalously warm waters in the equatorial Paciic and steep northward SST gradient in the atlantic; favorable for the nordeste rainfall the combination of cold equatorial Paciic waters with weak
4. TargeTed experimenTs
The empirical diagnostics summarized in the preceding section 3 indicate a chain of causality leading from SST anomalies in the equatorial Paciic to circulation and climate departures in the tropical atlantic sector. to complement these empirical diagnostics, targeted numerical experiments were conducted. From an index series of January SST in a key region of the eastern equatorial Paciic, documented in previous work (curtis and hastenrath, 1995; hastenrath, 2000), ensembles of contrasting extreme years were identiied, within the 1952-92 time span of the sPeedY archive. the ensemble of the ten most extreme WARM years (1958, 66, 69, 70, 73, 80, 83, 87, 88, 92) has an average departure of +1,27°c, and the ensemble of the ten most extreme COLD years (1963, 65, 67, 68, 71, 74, 75, 76, 85, 89) a departure of -0.82 °c from a long-term reference mean (26.18°c for 1949-68).
in the sPeedY model, as sole forcing the aforementioned departures of +1.27°c for WaRM and -0.82°c for cold January were prescribed in the rectangle 176.25 - 93.75°W, 9.278°s – 9.278°n (see Fig 5a), with otherwise global climatological 1952-92 sst, for 100 runs of WaRM and 100 runs of cold through the annual cycle. Results are presented in the January maps in Fig. 5. These should be appreciated in context with the empirical analyses in Fig. 2. thus, the map of differences in 200 mb topography in Fig. 5a shows a wave train from the equatorial Paciic to the tropical North Atlantic, similar to Fig. 2a. the wave train in 200 mb topography in Figs. 2a and 5a is also captured in another recent sPeedY modeling experiment (Herceg Bulic and Brankovic, 2007). Associated with the pattern in Fig. 5a is the difference pattern of 200 mb divergence, Fig. 5b, which resembles Fig. 2b in major features. concordant with the upper-tropospheric divergence (Figs. 5b and 2b) is the mid-tropospheric vertical motion (Figs. 5c and 2c). Broadly compatible with the comparison of Figs. 2c and f is the relationship between Figs. 5c and f, in that subsidence appears reduced on the equatorward side of the north atlantic subtropical high, and ascending motion weakened in the realm of the near-equatorial trough. this favors the reduction of the 925 mb topography in the North and rise in the South, during Paciic WaRM as compared to cold years (Fig. 5d). comparing Fig. 5e to g, the largest differences are found to the north of the band of warmest surface waters in the long-term mean, similar to the comparison of Figs. 2e to g.
Following up on the Paciic to Atlantic teleconnections borne out by the January maps of Figs. 2 and 5, the further evolution to april in the tropical atlantic sector is of interest. the sPeedY model does not adequately handle the atmospheric forcing on the upper ocean, as identiied by the empirical
research reported in section 3. Thus the modelling is here conined to the hydrostatic forcing of SST (Fig. 3) on the lower troposphere, and the wind ield resulting from the lower-tropospheric pressure.
figure - 5 Numerical modelling of January ields of differences between Paciic WARM minus COLD (a, b, c, d, e) and of 1952-92 mean conditions from sPeedY archive (f, g). the difference maps shown are of (a) 200 mb topography, with isoline spacing of 20 gpm (geopotential meters), and
thin dashed lines indicating negative values; heavy dashed line highlights wave train from equatorial Paciic to tropical North Atlantic; dotted-line
rectangle encloses domain for which sst anomalies were prescribed in the computer experiment; solid-line rectangle indicates the domain shown in the maps (b) to (g); (b) 200 mb divergence with isoline spacing of 1 x 10⁻⁶ s-1 and dashed lines indicating negative values; (c) 500 mb omega
vertical motion, with isoline spacing of 10-4 mb s-1 and dashed lines indicating negative values or upward motion; (d) 925 mb topography with
isoline spacing of 5 m and dashed lines indicating negative values; (e) sst with isoline spacing of 0.5°c. the atlantic 1952-92 mean maps
figure - 6 Numerical modeling of ields of differences between Paciic January WARM minus COLD, for January (a, e, i), February (b, f, j), March
(e, g, k), and April (d, h, l). The Atlantic maps shown are of 925 mb topography (a, b, c, d) with isoline spacing of 5 m; 925 mb resultant wind
speed (e, f, g, h) with isoline spacing of 5 ms-1; and 925 mb resultant wind vector (i, j, k, l) with indicated scaling of 10 degrees latitude/longitude
for 5 ms-1. Thick solid lines denote zero, and thin dashed lines negative values. Shading indicates areas for which the difference is signiicant at
the 5% level according to t-test.
5. conclusions
Work over the past three decades (Hastenrath and Heller, 1977; hastenrath and lamb, 1978; curtis and hastenrath, 1995; hastenrath, 2000, 2006) has successively elucidated the circulation mechanisms operative in annual cycle and interannual variability of Northeast Brazil rainfall. The ITCZ is the main rainbearing system for the nordeste rainy season centered around March-april. the itcz is embedded in the
the atlantic, all causally related to the latitude position of the itcz over the atlantic.
in addition to these indicators in the tropical atlantic sector, SST departures in the distant equatorial Paciic show an albeit weaker association with Nordeste rain: El Nino tends to be followed by warming in the tropical atlantic (covey and hastenrath, 1978) and by nordeste drought. the causality chain operative in such teleconnection has been explored in a sequence of empirical investigations. available numerical models invited a complementary investigation with targeted modelling experiments. Broadly consistent with the previous empirical diagnostics, the experiments bear out, for Paciic WARM as compared to cold events, an upper-tropospheric wave train extending from the equatorial eastern Paciic to the tropical north atlantic. this affects the patterns of upper-tropospheric topography and divergence, and hence of vertical motion over the atlantic. due to the altered vertical motion, the meridional pressure gradient on the equatorward side of the north atlantic subtropical high becomes less steep, and consequently the north Atlantic tradewinds weaken. Although the SPEEDY model is not suited to handle the resulting reduction of latent heat lux, wind stirring and Ekman pumping, leading to warmer surface waters in the tropical north atlantic, it does meaningfully simulate the hydrostatic forcing of observed sst on the lower-tropospheric pressure pattern. Weakened meridional pressure gradient over the tropical North Atlantic in January results in weaker tradewinds, leading to warmer surface waters, which further hydrostatically lower the surface pressure, leading to meridional SST and pressure gradients steepening from January to april. this is then conducive to an anomalously far northerly itcz position and nordeste drought. such combination of targeted numerical modeling experiments with empirical diagnostics appears desirable in the study of circulation and teleconnection mechanisms operative in other tropical climate anomalies.
6. acKnowledgemenTs:
this study was supported by the Variability of tropical climate Fund of the university of Wisconsin Foundation. We thank the reviewers for helpful comments.
7. references
aleXandeR, M. a.; Blade, i.; neWMan, M.; lanzate, J. R.; LAU, N.-C. The atmospheric bridge: the inluence of enso teleconnections on air-sea interaction over the global oceans. Journal of Climate, v.15, p.2205-2231, 2002. BouRKe, W. a multi-level spectral model. 1. Formulation
and hemispheric integrations.
Monthly Weather Review, v.102, p.687-701, 1974. COVEY, D. L.; HASTENRATH S. The Paciic El Niño
phenomenon and the atlantic circulation. Monthly Weather Review, v.108, p.1280-1287, 1978.
cuRtis, s.; hastenRath, s. Forcing of anomalous sea surface temperature evolution in the tropical atlantic during Paciic warm events. Journal of Geophysical Research-Oceans, v.100, C8, p.15835-15847, 1995.
EGGER, J. On the linear theory of the atmospheric response to sea surface temperature anomalies. Journal of Atmospheric Science, v.34, p.603-614, 1977.
enField, d.; MaYeR, d. a. tropical atlantic sea surface temperature variability and its relation to el nino - southern Oscillation. Journal of Geophysical ResearchOceans, v.102, c1, p.929-945, 1997.
Giannini, a.; saRaVanan, R.; chanG, P. the preconditioning role of the tropical atlantic variability in the development of the enso teleconnection: implications for the prediction of nordeste rainfall. climate dynamics, v.22, p.839-855, 2004.
GReischaR, l.; hastenRath, s. the rainy season of the 1990s in Northeast Brazil: real-time forecasts and verification. Journal of Climate, v.13, p.3821-3826, 2000.
hastenRath, s. climate and circulation of the tropics. Reidel, Dordrecht, Boston, Lancaster, Tokyo, 1985. 455p. HASTENRATH, S. Prediction of Northeast Brazil rainfall
anomalies. Journal of Climate, v.3, p.893-904, 1990. hastenRath, s. climate dynamics of the tropics. Kluwer,
dordrecht, Boston, london, 1995. 488p.
hastenRath, s. upper-air mechanisms of the southern Oscillation in the tropical Atlantic sector. Journal of Geophysical Research-atmospheres, v.115, d11, p.14997-15009, 2000.
hastenRath, s. circulation and teleconnection mechanisms of Northeast Brazil droughts.
Progress in oceanography, v.70, p.407-415, 2006. hastenRath, s.; GReischaR, l. circulation mechanisms
related to Northeast Brazil rainfall anomalies. Journal of Geophysical Research-Atmospheres, v.98, D5, p.5093-5102. 1993a.
HASTENRATH, S.; GREISCHAR, L Further work on the prediction of Northeast Brazil rainfall anomalies. Journal of Climate, v.6, p.743-758, 1993b.
hastenRath, s.; helleR, l. dynamics of climatic hazards in Northeast Brazil. Quarterly Journal of the Royal Meteorological Society, v.103, p.77-92, 1977.
hastenRath, s.; Wu, M. c.; chu, P. s. towards the monitoring and prediction of Northeast Brazil droughts. Quarterly Journal of the Royal Meteorological Society. v.110, p.411-425, 1984.
HELD, I. M.; SUAREZ. M. J. A proposal for the intercomparison of the dynamical cores of atmospheric general circulation models. Bulletin of the american Meteorological society. v.75, p.1825-1830, 1994.
heRceG Bulic, i.; BRanKoVic, c. enso forcing of the northern hemisphere climate in a large ensemble of model simulations based on a very long sst record.
Climate Dynamics, v.28, p.231-254, 2007.
HOREL, J. D.; WALLACE, J. M. Planetary scale atmospheric phenomena associated to thermal and orographic forcing. Monthly Weather Review, v.109, p.813-823, 1981. HOSKINS, B. J.; KAROLY, D. The steady linear response of
a spherical atmosphere to thermal and orographic forcing. Journal of Atmospheric Science, v.38, p.1179-1198, 1981.
KalnaY, e.; KanaMitsu, M.; KistleR, R.; collins, W.; deaVen, d.; Gandin, l.; iRedell, M.; saha, S.; WHITE, G.; WOOLLEN, J.; ZHU, Y.; CHELLIAH, M.; EBISUZAKI, W.; HIGGINS, W.; JANOWIAK, J.; MO, K. C.; ROPELEWSKI, C.; WANG, J.; LEETMAA, A.; REYNOLDS, R.; JENNE, R.; JOSEPH, D. The NCEP/ NCAR 40-Year Reanalysis Project. Bulletin of the American Meteorological Society, v.77, p.437-471, 1996.
KLEIN, S. A.; SODEN, B. J.; LAU, N.-C. Remote sea surface temperature variations during enso: evidence for a tropical atmospheric bridge. Journal of Climate, v.12, p.917-932, 1999.
KuchaRsKi, F.; Molteni, F.; BRacco, a. decadal interactions between the western tropical Paciic and the north atlantic oscillation. climate dynamics, v.26, p.79-91, 2006.
LAU, N.-C.; NATH, M. J. The role of the atmospheric bridge in linking tropical Paciic ENSO events to extratropical SST anomalies. Journal of Climate, v.9, p.2036-2057, 1996. Molteni, F. atmospheric simulations using a GcM with
ampliied physical parameterizations. 1. Model climatology and variability in multi-decadal experiments.
Climate Dynamics, v.20, p.175-191, 2003.
noBRe, P.; MouRa, a. d. large-scale tropical heat sources and global atmosphere energy propagation associated with droughts in Northeast Brazil. In: SECOND WMO sYMPosiuM on MeteoRoloGical asPects oF tRoPical dRouGhts. september 1984, World Meteorological Organization, TMP Report Series No. 15, Geneva, Switzerland, 1984. p.83-86.
NOBRE, P.; SHUKLA, J. Variations of sea surface temperature, wind stress, and rainfall over the tropical atlantic and south America. Journal of Climate, v.9, p.2464-2479, 1996. OPSTEEGH, J. D.; VAN DEN DOOL, H. M. Seasonal
differences in the stationary response of a linearized primitive equation model: prospects for long-range forecasting. Journal of Atmospheric Science, v.37,
p.2169-2185, 1980.
souza, e. B. de; KaYano, M. t.; aMBRizzi, t. intraseasonal and submonthly variability over the eastern Amazon and Northeast Brazil during the autumn rainy season. theoretical and applied climatology, v.81, p.177-191, 2005.
WEBSTER, P. J. Mechanisms determining the atmospheric response to sea surface temperature anomalies. Journal of Atmospheric Science, v.38, p.554-571, 1981.