Article
Printed in Brazil - ©2011 Sociedade Brasileira de Química0103 - 5053 $6.00+0.00A
*e-mail: lmmelgarejom@unal.edu.co
Principal Component Analysis of Changes due to Water Stress for Some Osmolytes,
Pigments and Antioxidant Enzymes in Gmelina arborea Robx. Leaves from Trees
Planted in Northern Colombia
Sandra C. Crespo, Andres L. Moreno-Chacón, Andrea Rojas and Luz M. Melgarejo*
Plant Physiology and Biochemistry Research Laboratory, Biology Department, Universidad Nacional de Colombia, Ciudad Universitaria, Bogotá, Colombia
Gmelina arborea é uma espécie de alto impacto econômico devido a vantagens como
árvore madeireira de rápido crescimento. A G. arborea é plantada na costa norte da Colômbia,
especialmente nas planícies secas do Caribe. No entanto, condições de déficit hídrico a que estão periodicamente submetidos, gera perdas nas plantações. Neste estudo mediram se a atividade da catalase, peroxidase e ascorbato peroxidase, assim como o conteúdo de açúcares totais, açúcares redutores, proline, carotenóides, clorofila A, B em folhas coletadas em três estações climáticas diferentes. Um estudo de análises de componentes principais mostrou que o comportamento das variáveis medidas depende tanto da idade quanto do tempo de amostragem, além de uma correlação inversa entre as variáveis de clorofila A, B e total e as outras variáveis medidas.
Gmelina arborea is a tree having great economic impact due to its advantages as a fast-growing
timber tree. G. arborea is currently being planted on the North Coast of Colombia, especially on
the dry plains near the Caribbean. However, the stress conditions produced by drought to which they are periodically subjected lead to plantation loss. This study was thus aimed at measuring catalase, peroxidase and ascorbate peroxidase activities as well as total sugar, reducing sugar, proline, carotenoids, chlorophyll A, B and total chlorophyll content in G. arborea leaves sampled
during three seasons of the year. Principal component analysis showed that the measured variables had patterns depending on age and season, in addition to an inverse correlation between chlorophyll A, B and total chlorophyll and the other measured variables.
Keywords: principal component analysis, water stress, oxidative stress, antioxidant system
Introduction
Plants are continuously exposed to unfavorable environmental conditions such as extreme temperatures and low water availability. Water deficit is most common as it results from reduced soil water availability and hot/dry weather conditions, causing continuous loss of water through transpiration and evaporation and thereby resulting in profound effects on plant growth, yield and productivity. Some physiological changes can be made to counteract such harmful effects arising from this event, such as increasing abscisic acid levels, stomatal closure, changes in cell osmolarity and increased enzymatic and non-enzymatic antioxidant concentration.1
Water deficit also results in important effects on photosynthesis due to minimizing carbon dioxide supply
by the closure of stomata. However, when there is a gradual increase in deficit, acclimation may occur to minimize these effects due to osmotic adjustment, thereby enabling the chloroplasts to maintain volume by accumulating certain constituents in the stroma, as in the case of proline and some sugars.2,3 However, severe or long periods of low water
availability can damage the photosynthetic machinery. Irradiance plays a vital role in changes taking place within a plant during water stress since the photosynthetic rate decreases and high irradiance produce excess energy resulting in the production of reactive oxygen species (ROS).1
ROS are molecules having high reactivity and occur during normal cell operation as part of the redox balance to activate and deactivate some protein activities.4 Its
the case of singlet oxygen.5 ROS also act as an alarm for
imbalances in the plant, activating signaling cascades triggering short-term physiological responses or long-term transcriptional ones.6 Furthermore, when ROS are produced
in large quantities they can be responsible for different types of cell damage, such as lipid peroxidation, proteins oxidation and even DNA damage.5,7
Increased ROS levels are caused by several types of environmental stress, creating what is known as oxidative stress during which ROS produce an imbalance in the redox state of the cell because they react with a large number of structural molecules and so produce significant damage to cell function.8 Two types of mechanism respond to such
altered redox states: a non-enzymatic system (consisting of ascorbic acid, polyphenols, chalcones, tocopherols, anthocyanins, carotenoids and glutathione) and enzyme systems. Such enzymes can be classified into two broad groups: (i) enzymes using H2O2 as substrate or cofactor
which are able to remove/neutralize H2O2 directly (i.e.
catalase (CAT),9 ascorbate peroxidase (APX),10 glutathione
peroxidase (GPOD),11 peroxyredoxin (PRX),12 type 3
peroxidase (POD)13 and (ii) enzymes using different ROS
as substrate or cofactor (i.e. superoxide dismutase (SOD)14
and glutathione reductase (GR)).
Catalase (CAT) (EC. 1.11.1.6) is located in peroxisomes and is responsible for controlling the flow of H2O2 by catalyzing its disproportion to water and oxygen. It is usually a tetramer wherein each subunit contains a heme group.15 Peroxidases (POD) (EC. 1.11.1.7) are
oxydoreductase metalloenzyme series reducing organic and inorganic peroxides into their corresponding alcohols by using a cysteine active site.16 They are located in the
cytoplasm in soluble form and are bound through ionic or covalent bonds on the cell wall.17 Ascorbate peroxidase
(APX) (EC. 1.11.1.11) is one of the most important enzymes in hydrogen peroxide and nitrogen detoxification in chloroplasts; it participates in the glutathione-ascorbate cycle. This enzyme uses H2O2 as substrate together with ascorbate anion to generate monodehydroascorbate (MDA) and dehydroascorbate (DHA).18,19
G. arborea is a native South-eastern Asia specie and has
been introduced into South America. It belongs to the family Verbenaceae and is characterized by rapid growth and it reaches up to 30 m in height and 100 cm in diameter. This species is recognized for its potential in ecosystem recovery and that of the environment.20,21G. arborea has
been planted on the Northern Coast of Colombia, especially on the dry plains near the Caribbean. However, the water deficit conditions to which they are periodically subjected cause plantation loss, increased costs due to re-seeding and the need for greater use of irrigation water.
This study was aimed at determining total sugar, reducing sugars, proline, carotenoids, chlorophyll A, B and total chlorophyll and total protein content as well as catalase, peroxidase and ascorbate peroxidase activities during three climatic seasons in the leaves of G. arborea
Robx trees planted in northern Colombia.
Experimental
Apparatus
A SmartSpec Plus spectrophotometer (Bio-Rad) was used for taking spectrophotometric measurements for determining chlorophyll A, B, total chlorophyll, carotenoids and proline content and determining catalase, peroxidase and ascorbate peroxidase activities. An ImarkMicroplate Absorbance Reader was used for taking total and reducing sugars and total protein spectrophotometric measurements.
Reagents and solutions
All chemicals were analytical-reagent grade or better. All solutions and dilutions were prepared with ultrapure water (Thermo Scientific Barnstead RO, Reverse Osmosis System).
Samples
The leaf tissue samples were taken from G. arborea
Robx clone 79 from Pizano SA Monterrey Forestal Ltda plantation in Zambrano (Bolívar), northern Colombia; they were collected during the three study periods: rainy season (September-October), transition to dry season (December) and dry season (February-April). Three-hour sampling (8, 10 and 12 h) and three ages (seedling, juvenile and adult) were used. The seedlings were sown in the field on August 6th 2008, the samplings (juvenile trees) on
October 10th 2007 and adult trees on May 25th 2004.
The leaves were collected from the mid-section of three trees per age and stored at −10 ºC; they were then macerated with liquid N2 to a fine powder which was kept
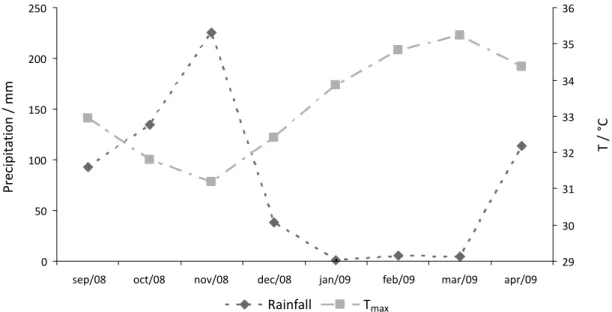
at −10 °C until final processing. Climatic data: maximum temperature and rainfall were obtained from the IDEAM weather station in Monterrey Forestall (Figure S1).
Analytical determination
Material was macerated in triplicate using the following determination: catalase (CAT) activity (µg mol H2O2 min-1 mg-1 protein) according to Aebi,22
peroxidase (POD) activity (∆A436nm min
according to Kireyko et al.,23 ascorbate peroxidase (APX)
activity (nmol oxidized ascorbate min-1 mg-1 protein)
according to Nakano and Asada,24 protein content according
to Bradford (mg g-1 plant material),25 carotenoids and
chlorophylls A, B and total chlorophyll (mg g-1 plant
material) according to Lichtenthaler,26 total sugar content
(mg g-1 plant material) according to DuBois et al.,27
reducing sugar content (mg g-1 plant material) according to
Nelson and Somogyi,28,29 and proline content (µg g-1 plant
material) according to Bates et al.30
All methods were standardized in the Plant Physiology and Biochemistry Research Laboratory of the Universidad Nacional de Colombia and details can be found in the Plant Physiology Experiments manual.31
Data analysis
A data matrix containing 27 rows (samples) and 13 columns (variables) was built. The pattern recognition technique used in this work was principal component analysis (PCA): this is a procedure that allows exploring the data structure, the relationship between objects, the relationship between objects and variables and overall correlation of the variables.32 MATLAB 7.9.0529 (R2009b)
for Windows (MathWorks) was used for PCA.
Results
Table S1 shows the results for determining total and reducing sugars, proline, chlorophyll A, B, total chlorophyll, carotenoids, total protein and catalase, peroxidase and ascorbate peroxidase activity.
Total sugar, reducing sugar, proline, carotenoids, chlorophyll content and CAT, POD and APX activity were used as descriptors for principal component analysis; this analysis was carried out with auto-scaling data.
It was found that the first component accounted for 64.21% of variance and the second one to 14.11% of variance. The loading plot (Figure 1) showed that principal component PC1 gave chlorophyll A, chlorophyll B and total chlorophyll as dominant variable, appearing to be negative PC1 values. Proline, catalase, carotenoids, season, peroxidase and reducing sugars appeared to be positive values for PC1, so there was an inverse correlation between chlorophyll A, B and total chlorophyll compared to the other variables. Dominant variables for the second component (PC2) were chlorophylls A and B, total chlorophyll and total protein; they displayed positive PC2 values. It is worth noting that time was not a relevant variable for either component (PC1 and PC2), however, time appeared to have negative values for the third component (not shown) which
explained 7.73% of variance, having an inverse correlation with protein.
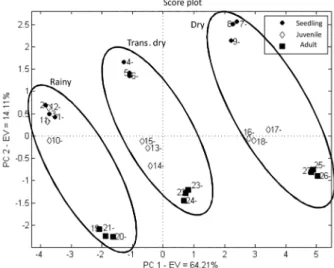
The score plot (Figure 2) clearly shows the presence of three different groups on the PC1 axis corresponding to sampling time. PC2 shows three different age groups. These results showed that the measured variables had a pattern dependent on both season and age.
Simultaneous analysis of the two charts showed that adult specimens had a direct correlation with sugar content; seedlings were correlated with protein, carotenoids, chlorophyll A, B and total chlorophyll content; while juveniles occupied an intermediate position.
Discussion
Water stress leads to reduced cell water content, in turn leading to loss of lipid bilayer integrity ending in loss of function, selectivity, disruption and affects the activity of Figure 1. Loading plot for principal component analysis.
some enzymes. Moreover, in the event of stress-related drought, there are three types of signals or response which are designed to compensate for water loss. First, conditions are maintained which produce efficient osmosis water use (ABA production) and maintain homeostasis under stress by an increase in molecules consistent with sugar, polyol, proline cell structures. Secondly, ROS are controlled by enzymatic and molecular systems and, thirdly, cell division is coordinated to meet the requirements of plants under stress.33
The present study provided evidence that G. arborea
increased sugar and proline content during the dry season compared to rainy periods and transition to dry season (Table S1) as an osmoregulatory response to prevent cell dehydration. This behavior has been reported in other studies of plants subjected to water stress in controlled conditions34,35
or in field conditions36 (as our case study). This response
occurs because plants tend to compensate for cellular drought stress through osmoregulatory production of proline, glutamate, glycine betaine, carnitine, mannitol, sorbitol, fructans, polyols, trehalose, sucrose, some hexoses and oligosaccharides. These molecules help maintain a hydrated state and promote resistance to dehydration by maintaining leaf turgor.37-39 It is assumed that sugars also play a role in
stabilizing some macromolecules and cellular structures39
are involved in controlling ROS during water stress40 and
assist in maintaining certain physiological functions, such as partial stomatal opening, photosynthesis and cell expansion.41 Moreover, it has been proposed that proline
affects some effectors involved in the expression of genes related to plant tolerance to different types of stress.2,42
It also has a stabilizing effect on protein and membrane structure, is an inducer of osmotic stress-related genes43 and
is a source of readily-available carbon and nitrogen in cell re-hydration.44 This study (like many others) has shown that
there is an increase in total soluble sugars and proline during water stress conditions1,2,45,46 as a strategy for preventing
drying out and damage from oxidative stress.
Increased carotenoid content is another response to energy dissipation level and carbon and nitrogen content regulation to increase the excess energy of the receptor molecules and use chlorophyll as a source of carbon and nitrogen.47 There is perfect coordination between
light-induced electron transfer in thylakoid membrane and carbon dioxide fixation by the Calvin cycle in the stroma in natural conditions; however, stress results in an imbalance which triggers ROS formation that damages the photosynthetic apparatus.48
The G. arborea study reported here found decreased
chlorophyll A, B and total chlorophyll content and an increase in carotenoids during the dry season compared
to the rainy and transition to dry season. Pigment study is important from an ecophysiological viewpoint as it provides information about productivity, stress and degradative events and limiting nutrients. Alterations in photosynthetic pigment composition may be related to photoacclimation.49 High irradiance acclimated cells may
contain high concentrations of carotenoids in relation to chlorophyll A. Yellow-orange carotenoids are associated with membrane-embedded proteins within chloroplasts where they interact with acceptor molecules and carriers. They have a protection-inducing photoxidative role against damage to the photosynthetic apparatus, dissipating excess light absorbed by pigment antenna.50,51 Similar results
have been reported for other plants subjected to water stress. Nayyar and Gupta52 found a significant decrease
in chlorophyll content in Triticum aestivum and Zea mays
plants subjected to water stress, and Jung53 found a decrease
in chlorophyll content in mature Arabidopsis thaliana
leaves subjected to water stress; however, no changes were found in carotenoids content compared to control.
The results of CAT, POD and APX activities in
G. arborea showed significant increase during the dry season
compared to the rainy season and transition to dry season. Other studies have reported similar behaviors: Bai et al.54
found increased SOD activity during severe water stress treatment in maize plants (Zea mays L.) and increased POD
activity when subjected to moderate stress and severe stress. Ozkur et al.55 noted significant increases in SOD, POD and
CAT activities in leaves from caper (Capparis ovate
Def.) plants subjected to water stress induced by adding polyethylene glycol (PEG). Nayyar and Gupta52 studied
the effect of low, moderate and severe water stress on C3 (Triticum aestivum) and C4 plants (Zea mays), finding that
leaves’ CAT and APX activity was greater for moderate stress in both types of plant.
Conclusions
Principal component analysis clearly established the presence of three groups corresponding to season (rainy season, transition to dry season and dry season) and three age-related groups (seedling, juvenile and adult). Increased osmoregulatory compound content and activity of the enzymes being studied (forming part of antioxidant enzymes) indicated that G. arborea exhibited oxidative
Supplementary Information
Supplementary data (Table S1 and data concerning climate Figure S1) are available free of charge at http://jbcs.sbq.org.br as pdf file.
Acknowledgments
We would like to thank the Colombian Ministry of Agriculture and Rural Development, the Universidad Nacional de Colombia, Pizano SA Monterrey plantation forestry (Zambrano, Bolivar), Miguel Rodriguez (for funding and logistical support) and Danny Rodriguez Lopez for advice on statistical analysis.
References
1. Smirnoff, N.; New Phytologist1993,125, 27.
2. Kavi Kishor, P. B.; Sangam, S.; Amrutha, R. N.; Laxmi, P. S.; Naidu, K. R.; Rao, K. R. S. S.; Sreenath, R.; Reddy, K. J.; Theriappan, P.; Sreenivasulu, N.; Curr. Sci.2005,88, 424. 3. Chen, T. H.; Murata, N.; Curr. Opin. Plant Biol. 2002, 5, 250. 4. Wormuth, D.; Heiber, I.; Shaikali, J.; Kandlbinder, A.;
Baier, M.; Dietz, K. J.; J. Biotechnol.2007,129, 229. 5. Sweetlove, L. J.; Møller, I. M.; Adv. Bot. Res.2009,52, 1. 6. D’Autréaux, B.; Toledano, M. B.; Nat. Rev. Mol. Cell Biol.
2007,8, 813.
7. Tambussi, E. A.; Bartoli, C. G.; Beltrano, J.; Guiamet, J. J.; Araus, J. L.; Physiol. Plant.2000,108, 398.
8. Møller, I. M.; Jesen, P. E.; Hasson, A.; Annu. Rev. Plant Biol.
2007,58, 459.
9. Vandenabeele, S.; Vanderauwera, S.; Vuylsteke, M.; Rombauts, S.; Langebartels, C.; Seidlitz, H. K.; Zabeau, M.; Montagu, V. M.; Inzé, D.; Breusegem, V. F.; Plant J.2004,39, 45.
10. Mittler, R.; Vanderauwera, S.; Gollery, M.; Breusegem, V. F.; Trends Plant Sci.2004,9, 490.
11. Rodriguez, M. M. A.; Maurer, A.; Rodriguez, H. A.; Gustafson, J. P.; Plant J.2003,36, 602.
12. Dietz, K. J.; Annu. Rev. Plant Biol. 2003,54, 93.
13. Tognolli, M.; Penel, C.; Greppin, H.; Simon, P.; Gene2002,
288, 129.
14. Kliebenstein, D. J.; Monde, R. A.; Last, R. L.; Plant Physiol.
1998,118, 637.
15. Switala, J.; Loewen, P. C.; Arch. Biochem. Biophys.2002,401, 145. 16. Herrero, E.; Ros, J.; Bellí, G.; Cabiscol, E.; Biochim. Biophys.
Acta, Gen. Subj. 2008,1780, 1217.
17. Grison, R.; Pilet, P. E.; J. Plant Physiol.1985,118, 189. 18. Asada, K.; Annu. Rev. Plant Physiol. Plant Mol. Biol.1999,50,
601.
19. Tausz, M.; Šircelj, H.; Grill, D.; J. Exp. Bot. 2004,55, 1955. 20. Rodríguez, R. F.; Arias, A. D.; Moya, R. R.; Meza, M. A.;
Murillo, G. O.; Arguedas, G. M.; Manual para Productores de Melina Gmelina Arborea en Costa Rica; Centro de Investigación en Integración Bosque Industria de la Escuela de Ingeniería Forestal del Instituto Tecnológico de Costa Rica: Cartago, 2004, http://www.sirefor.go.cr/Documentos/ Especies_plantaciones/MELINA/Manual%20para%20los% 20productores%20de%20melina.pdf, accessed in February 2011.
21. Obregón, S. C.; Gmelina Arborea. Versatilidad, Renovación y Productividad Sostenible para el Futuro; Revista El Mueble y La Madera: Bogotá D. C., 2005, http://www.revista-mm.com/ ediciones/rev50/especie.pdf, accessed in March 2011. 22. Aebi, H. In Methods of Enzymatic Analysis; Bergmeyer, H. U.,
ed.; Academic Press Inc: New York., 1974.
23. Kireyko, A. V.; Veselova, I. A.; Shekhovtsova, T. N.; Russ. J. Bioorg. Chem.2006,32, 71.
24. Nakano, Y.; Asada, K.; Plant Cell Physiol.1987,28, 131. 25. Bradford, M. M.; Anal. Biochem. 1976,72, 248.
26. Lichtenthaler, H. K. In Methods in Enzymology, Colowick, S. P.; Kaplan, N. O., eds.; Academic Press: New York, 1987. 27. DuBois, M.; Gilles, K. A.; Hamilton, J. K.; Rebers, P. A.;
Smith, F.; Anal. Chem.1956,28, 350. 28. Nelson, N.; J. Biol. Chem.1944,153, 375. 29. Somogyi, M.; J. Biol. Chem.1952,195, 19.
30. Bates, L. S.; Waldren, R. P.; Teare, I. D.; Plant Soil1973,39, 205.
31. Melgarejo, L. M.; Romero, M.; Hernández, S.; Barrera, J.; Solarte, M. E.; Suárez, D.; Pérez, L. V.; Rojas, A.; Cruz, M.; Moreno, A. L.; Crespo, S. C.; Pérez, W. H.; Experimentos en Fisiología Vegetal; Universidad Nacional de Colombia: Bogotá, 2010.
32. Beebe, K. R.; Pell, R. J.; Seasholtz, M. B.; Chemometrics: a Practical Guide; Wiley: New York, 1998.
33. Liu, J.; Zhu, J. K.; Science1998,280, 1943.
34. Liu, F.; Andersen, M. N.; Jacobsen, S. E.; Jensen, C. R.; Environ. Exp. Botany2005,54, 33.
35. García, A.; Dorado, M.; Pérez, I.; Montilla, E.; Interciencia: Revista de Ciencia y Tecnología de América2010,35, 47. 36. Munné-Bosch, S.; Peñuelas, J.; Plant Sci.2004,166, 1105. 37. Hoekstra, F. A.; Golovina, E. A.; Buitink, J.; Trends Plant Sci.
2001,6, 431.
38. Ramanjulu, S.; Bartels, D.; Plant Cell Environ.2002,25, 141. 39. Mahajan, S.; Tuteja, N.; Arch. Biochem. Biophys.2005,444,
139.
40. Zhu, J. K.; Trends Plant Sci.2001,6, 66.
41. Lawlor, D. W.; Cornic, G.; Plant Cell Environ.2002,25, 275. 42. Yoshiba, Y.; Kiyosue, T.; Nakashima, K.; Kazuko, Y. S.;
Shinozaki, K.; Plant Cell Physiol.1997,38, 1095. 43. Iyer, S.; Caplan, A.; Plant Physiol.1998,116, 203.
45. Abebe, T.; Guenzi, A. C.; Martin, B.; Cushman, J. C.; Plant Physiol.2003,131, 1748.
46. Avendaño, A. C. H.; Trejo, L. C.; López, C. C.; Molina, G. J. D.; Santacruz, V. A.; Castillo, G. F.; Interciencia: Revista de Ciencia y Tecnología de América2005,30, 560.
47. Tanaka, R.; Tanaka, A.; Annu. Rev. Plant Biol.2007,58, 321. 48. Shanker, D. R. In Handbook of Photosynthesis; Pessarakli, M.,
ed.; CRC Press: New York, 2005.
49. Richardson, A. D.; Duigan, S. P.; Berlyn, G. P.; New Phytologist
2002,153, 185.
50. Lichtenthaler, H. K.; Buschmann, C. In Current Protocols in Food Analytical Chemistry; John Wiley & Sons Inc.: New York, 2001.
51. Demmig-Adams, B.; Adams, W. W.; Trends Plant Sci.1996,1, 21.
52. Nayyar, H.; Gupta, D.; Environ. Exp. Botany2006,58, 106. 53. Jung, S.; Plant Sci.2004,166, 459.
54. Bai, L. P.; Sui, F. G.; Ge, T. D.; Sun, Z. H.; Lu, Y. Y.; Zhou, G. S.; Pedosphere2006,16, 326.
55. Ozkur, O.; Ozdemir, F.; Bor, M.; Turkan, I.; Environ. Exp. Botany2009,66, 487.
Submitted: April 11, 2011
Supplementary Information
0103 - 5053 $6.00+0.00S
I
*e-mail: lmmelgarejom@unal.edu.co
Principal Component Analysis of Changes due to Water Stress for Some Osmolytes,
Pigments and Antioxidant Enzymes in Gmelina arborea Robx. Leaves from Trees
Planted in Northern Colombia
Sandra C. Crespo, Andres L. Moreno-Chacón, Andrea Rojas and Luz M. Melgarejo*
Plant Physiology and Biochemistry Research Laboratory, Biology Department, Universidad Nacional de Colombia, Ciudad Universitaria, Bogotá, Colombia
Climate
Figure S1 shows the maximum temperature (Tmax) and rainfall pattern during the study period. Rainfall during September and October had similar, high values. The values recorded during November were because of La Niña. Rainfall became minimal during December and the dry season began in January.
Principal Component
Analysis of Changes due to
W
ater Stress
J. Br
az. Chem. Soc.
2 2 ∆ 436nm
min-1 mg-1 protein)a
Sample Age Season time / h AZT AZR PRL ChlT ChlA ChlB CRT PRT CAT POD APX
1 seedling rainy 8 9.4 ± 0.3 3.8 ± 0.4 0.8 ± 0.2 5.7 ± 0.5 3.3 ± 0.3 2.4 ± 0.2 0.61 ± 0.05 1.4 ± 0.1 0.38 ± 0.07 0.32 ± 0.09 1.09 ± 0.03
2 seedling rainy 10 8.5 ± 0.3 3.8 ± 0.5 0.8 ± 0.1 6.06 ± 0.04 3.3 ± 0.3 2.8 ± 0.3 0.58 ± 0.06 1.3 ± 0.2 0.32 ± 0.04 0.28 ± 0.04 1.21 ± 0.02
3 seedling rainy 12 7.6 ± 0.2 3.8 ± 0.3 0.8 ± 0.1 5.8 ± 0.3 3.2 ± 0.1 2.5 ± 0.3 0.60 ± 0.04 1.5 ± 0.1 0.44 ± 0.03 0.28 ± 0.03 0.96 ± 0.03
4 seedling trans. dry 8 9.2 ± 0.9 5.5 ± 0.3 1.5 ± 0.1 5.1 ± 0.2 2.9 ± 0.1 2.3 ± 0.2 0.89 ± 0.06 2.5 ± 0.3 0.9 ± 0.1 0.89 ± 0.05 1.7 ± 0.3
5 seedling trans. dry 10 9.5 ± 0.3 5.5 ± 0.3 1.4 ± 0.2 4.8 ± 0.1 2.7 ± 0.2 2.11 ± 0.02 0.94 ± 0.05 2.6 ± 0.2 0.9 ± 0.1 0.82 ± 0.09 1.7 ± 0.3
6 seedling trans. dry 12 9.4 ± 0.2 5.7 ± 0.3 1.3 ± 0.2 4.7 ± 0.3 2.6 ± 0.2 2.05 ± 0.07 0.76 ± 0.08 2.7 ± 0.1 1.0 ± 0.1 0.99 ± 0.08 1.46 ± 0.09
7 seedling dry 8 12.56 ± 0.07 9.3 ± 0.6 4.3 ± 0.2 4.3 ± 0.1 2.4 ± 0.2 1.90 ± 0.07 1.3 ± 0.2 2.7 ± 0.4 1.6 ± 0.1 1.58 ± 0.05 3.6 ± 0.1
8 seedling dry 10 11.9 ± 0.6 8.6 ± 0.5 4.3 ± 0.1 4.3 ± 0.2 2.5 ± 0.2 1.79 ± 0.06 1.4 ± 0.2 2.6 ± 0.1 1.5 ± 0.2 1.80 ± 0.08 3.16 ± 0.05
9 seedling dry 12 12.6 ± 0.2 8.4 ± 0.2 4.2 ± 0.2 4.0 ± 0.3 2.3 ± 0.3 1.66 ± 0.03 1.4 ± 0.1 2.6 ± 0.3 1.5 ± 0.3 1.3 ± 0.1 3.6 ± 0.1
10 juvenile rainy 8 12 ± 1 6.5 ± 0.3 0.40 ± 0.04 5.9 ± 0.3 3.5 ± 0.2 2.4 ± 0.2 0.36 ± 0.03 1.1 ± 0.1 0.26 ± 0.05 0.38 ± 0.02 0.58 ± 0.02
11 juvenile rainy 10 12.0 ± 0.7 6.9 ± 0.5 0.5 ± 0.1 6.3 ± 0.1 3.78 ± 0.08 2.54 ± 0.06 0.36 ± 0.07 1.21 ± 0.08 0.30 ± 0.05 0.43 ± 0.03 0.71 ± 0.06
12 Juvenile rainy 12 10.8 ± 0.6 6.6 ± 0.7 0.5 ± 0.1 6.4 ± 0.2 3.7 ± 0.1 2.7 ± 0.2 0.51 ± 0.04 1.3 ± 0.2 0.35 ± 0.05 0.38 ± 0.04 0.80 ± 0.01
13 juvenile trans. dry 8 14.4 ± 0.2 9.6 ± 0.3 1.9 ± 0.2 4.0 ± 0.5 2.4 ± 0.3 1.6 ± 0.2 0.72 ± 0.08 1.8 ± 0.3 0.77 ± 0.05 0.8 ± 0.2 1.11 ± 0.08
14 juvenile trans. dry 10 14.7 ± 0.9 9.6 ± 0.2 1.6 ± 0.3 3.7 ± 0.3 2.21 ± 0.06 1.5 ± 0.2 0.82 ± 0.06 1.4 ± 0.5 0.63 ± 0.09 0.93 ± 0.05 1.15 ± 0.08
15 juvenile trans. dry 12 15.6 ± 0.4 9.7 ± 0.2 1.5 ± 0.1 4.5 ± 0.3 2.7 ± 0.1 1.7 ± 0.2 0.76 ± 0.04 1.5 ± 0.2 0.66 ± 0.09 1.01 ± 0.07 1.01 ± 0.05
16 juvenile dry 8 15.5 ± 0.2 12.6 ± 0.3 3.4 ± 0.2 2.4 ± 0.1 1.53 ± 0.07 0.84 ± 0.06 1.17 ± 0.07 2.2 ± 0.2 1.2 ± 0.1 1.32 ± 0.08 2.46 ± 0.02
17 juvenile dry 10 19 ± 3 13.6 ± 1 3.6 ± 0.2 2.4 ± 0.1 1.5 ± 0.1 0.87 ± 0.07 1.49 ± 0.09 2.6 ± 0.2 1.3 ± 0.2 1.23 ± 0.06 2.1 ± 0.4
18 juvenile dry 12 18.8 ± 0.7 13 ± 1 3.5 ± 0.3 2.4 ± 0.1 1.53 ± 0.08 0.82 ± 0.05 1.19 ± 0.05 2.7 ± 0.2 1.2 ± 0.1 1.19 ± 0.07 1.6 ± 0.2
19 adult rainy 8 8.5 ± 0.2 6.7 ± 0.2 0.52 ± 0.05 2.7 ± 0.1 1.76 ± 0.02 1.0 ± 0.2 0.55 ± 0.01 1.5 ± 0.1 0.47 ± 0.05 0.41 ± 0.03 0.43 ± 0.03
20 adult rainy 10 8.6 ± 0.2 6.5 ± 0.1 0.44 ± 0.06 2.4 ± 0.3 1.7 ± 0.2 0.68 ± 0.05 0.8 ± 0.2 1.4 ± 0.2 0.56 ± 0.06 0.47 ± 0.03 0.6 ± 0.3
21 adult rainy 12 7.6 ± 0.1 6.0 ± 0.3 0.55 ± 0.03 2.56 ± 0.05 1.89 ± 0.03 0.67 ± 0.02 0.8 ± 0.2 1.1 ± 0.1 0.58 ± 0.09 0.44 ± 0.05 0.6 ± 0.1
22 adult trans. dry 8 11.6 ± 0.3 9.1 ± 0.3 2.65 ± 0.09 2.1 ± 0.1 1.31 ± 0.06 0.79 ± 0.05 0.97 ± 0.01 2.1 ± 0.1 1.31 ± 0.09 0.56 ± 0.01 0.8 ± 0.1
23 adult trans. dry 10 12 ± 1 8.4 ± 0.5 2.5 ± 0.2 2.0 ± 0.2 1.19 ± 0.06 0.8 ± 0.2 0.8 ± 0.1 2.3 ± 0.2 1.5 ± 0.1 0.59 ± 0.08 1.06 ± 0.01
24 adult trans. dry 12 12.7 ± 0.5 8.7 ± 0.7 2.4 ± 0.2 2.1 ± 0.2 1.22 ± 0.06 0.9 ± 0.2 0.8 ± 0.2 1.9 ± 0.6 1.4 ± 0.1 0.63 ± 0.09 0.96 ± 0.03
25 adult dry 8 17.6 ± 0.6 15.3 ± 0.9 5.3 ± 0.1 1.2 ± 0.2 0.68 ± 0.06 0.5 ± 0.1 1.4 ± 0.2 1.6 ± 0.3 1.6 ± 0.1 2.0 ± 0.1 3.0 ± 0.2
26 adult dry 10 17.6 ± 0.3 15.1 ± 0.9 5.3 ± 0.1 1.1 ± 0.2 0.7 ± 0.2 0.48 ± 0.04 1.22 ± 0.06 1.2 ± 0.1 1.93 ± 0.08 2.0 ± 0.2 3.8 ± 0.5
27 adult dry 12 18 ± 1 13.7 ± 0.6 5.5 ± 0.2 1.15 ± 0.03 0.65 ± 0.04 0.50 ± 0.06 1.32 ± 0.06 1.2 ± 0.2 1.7 ± 0.2 1.8 ± 0.1 4.0 ± 0.6