1 Recebido para publicação em 26.2.2016 e aprovado em 29.2.2016.
2 Department of Natural Resources and Environmental Engineering, College of Agriculture, Shiraz University, Shiraz, Iran, <[email protected]>.
F
INDING OUTR
ELATIONSHIPSA
MONGS
OMEM
ORPHO-B
IOCHEMICALP
ARAMETERS OFC
HRIST’
ST
HORN(
Ziziphus spina-christi
)
UNDERD
ROUGHT ANDS
ALINITYS
TRESSES1A Descoberta de Relações entre Alguns Parâmetros Morfobioquímicos do Espinheiro-de-Cristo
(
Ziziphus spina-christi
) sob os Estresses Hídrico e Salino
NEJAT, N.2, and SADEGHI, H.2
ABSTRACT - Taking into consideration that modeling and indicating relationship among traits and variables are among the most useful numerical techniques in the biological and botanical researches, and also undeniable impact of drought and salinity stresses, this research was implemented with the aim to consider change in relationship among the traits under separately drought and salinity stresses related to scarcely distributed medicinal plant called Christ thorn (Ziziphus spina-christi). A glass house experiment was implemented in controlled conditions at the College of Agriculture, Shiraz University, Shiraz, Iran. Five different water stress levels (irrigation at four, six, eight and 10 days intervals, compared to the unstressed control plants with every even days irrigation) and five salinity stress levels (0, 3.2, 6.4, 9.6 and 12.3 dS m-1) were separately induced on plants. Results of this study indicated that salinity and water stresses in addition to their destructive impact on cell and tissue compartment, can adverse and change the relationship among morphological and biochemical parameters in different ways. Cluster analysis could clearly separate traits into two groups under water stress while three groups under salinity stress. Principal component showed that this technique can accounted for a high variation among data under both water and salinity stresses so that it is possible to consider relationship among the traits using principal component in place of classic methods such as correlation coefficients. As result of principal component, it revealed that change in relationship among traits under different stresses is plausible.
Keywords: salinity, drought, stepwise regressions, principal component analysis, cluster analysis.
RESUMO - Levando-se em consideração que a modelagem e indicação de relações entre os traços e variáveis estão entre as técnicas numéricas mais úteis nas pesquisas biológicas e botânicas, assim como o impacto inegável dos estresses hídrico e salino, esta pesquisa foi realizada com o objetivo de investigar mudanças na relação entre os traços em condições de estresses hídrico e salino, separadamente, relacionados à planta medicinal de distribuição esparsa chamada espinheiro-de-cristo (Ziziphus spina-christi). Foi conduzido um experimento em estufa, em condições controladas, na Faculdade de Agricultura da Universidade de Shiraz, Shiraz, Iran. Cinco níveis diferentes de estresse hídrico (irrigação nos intervalos de quatro, seis, oito e dez dias, em comparação com as plantas do grupo controle não submetidas a estresse, nos dias pares de irrigação) e cinco níveis de estresse salino (0, 3,2, 6,4, 9,6 e 12,3 dS m-1) foram induzidos separadamente sobre as plantas. Os
principais, em substituição aos métodos clássicos,como os coeficientes de correlação. Como consequência do uso dos componentes principais, observou-se que é plausível a mudança na relação entre os traços sob diferentes tipos de estresse.
Palavras-chave: salinidade, seca, método de regressão stepwise, análise de componentes principais, análise de agrupamento.
INTRODUCTION
Three species of Christ thorn (ZSC) whose genus is subset of the Ramnaceae family, namely, Ziziphus spina-christi, Z. nummularia
and Z. jujuba can be found in Iran. Ziziphus spina-christi, Z. nummularia are adapted to tropical climate while Z. jujuba grows in cooler
regions(Hoveyzeh et al., 2001). This genus can be grouped as a subset of medicinal plants, and it contains a great deal of some important elements and micronutritions such as iron, magnesium and phosphorus in line with tanons and plant sterols e.g. β-cyctrol and glycoside β-cyctrol (Harighi, 2007).
Many studies have been carried out about the effect of water and salinity stress on plant growth and development (Barceló et al., 1990; Acosta-Gallegos et al., 1991; Ali et al., 2014; Nadeem et al., 2014; Osakabe et al., 2013, 2014). Under water and salinity stresses, leaf length and width are decreased, which it leads to a decrease in photosynthesis (Cochard et al., 2002; Zhou et al., 2013). Knowledge of genetic association between economical production of plants and their components under water deficit and salinity conditions would improve the efficiency of breeding programs by identifying appropriate indices for selecting plant varieties (Ahmed et al., 2014; Khattak et al., 2014; Taghvaei et al., 2015).
Tracking the relationship between traits by presenting different aspects of plant growth and regulation could provide clear insights about interactions among plants and help researchers and breeders to use this information for better management and make progress in plant production (Saed-Moucheshi et al., 2013a). Different statistical and numerical techniques have been developed to prompt the different aspects of the relationship of different variables. Principal component analysis (PC) is a variable reduction procedure which is useful for data with a large number of
variables. It can be explained as a method that reduces data dimensionality by performing a covariance or correlation analysis between variables. Performing PC analysis helps researchers to use simple diagrams such as factors loadings to explain relationships among each of the variables (Saed-Moucheshi et al., 2013a; Gholizadeh et al., 2014). Regression analysis is usually referred to one dependent variable and one or more independent variables. Stepwise regression technique is a method for selecting the most important variables affecting dependent variables (Saed-Moucheshi et al., 2013a). Cluster analysis or clustering is the task of assigning a set of objects into groups (called clusters) so that the objects in the same cluster are more similar (in some sense) to each other than to those in other clusters (Duran et al., 2013).
Taking into consideration the fact that modeling and indicating the relationship among traits and variables are some of the most useful numerical techniques in biological and botanical research, and also the undeniable impact of drought and salinity stresses, this research was implemented with the aim of considering change in the relationship among the traits, separately under drought and salinity stresses related to a scarcely distributed medicinal plant called Christ’s thorn (ZSC).
MATERIALS AND METHODS
The present study was conducted under controlled conditions at the College of Agriculture, Shiraz university, Shiraz, Iran (52o46' E, 29o50' N, altitude 1810 m asl), 12 km
north of Shiraz, on a Fine mixed, mesic Typic Calcixerpets soil with air temperature in the range from 25 to 30 oC and light intensity in
the range from 600-1000 µmol m-2 s-1. Seeds
hypochloride solution for 15 minutes (Saied et al., 2008). Subsequently, seeds were placed on moist silica sand in inverted cells of plastic trays at 30/25 oC (day/night) temperature and
50% (±10%) relative air humidity. Moisture level was periodically readjusted as necessary. After six weeks seedlings were selected and transplanted into 2.5 L (liter) sand filled plastic pots. For applying water and salinity stresses, plants were grouped into similarly plant subsets which were subjected to five different water stress levels (irrigation at four, six, eight and 10-day intervals, compared to the unstressed control plants, with irrigation performed every even day) and five salinity stress levels (0, 3.2, 6.4, 9.6 and 12.3 DS m-1).To avoid early plant death by
a sudden salt stress shock of the young transplanted seedlings, salt stress was imposed gradually by applying half of the salt concentration over four weeks followed by the full concentration applied for another eight weeks. Total duration of the salt stress was eight weeks.
Parameters measured
Relative water content (RWC)
For measurement of RWC, the last leaf was separated and immediately weighed as shoot fresh weight (FW). After being immersed in distilled water for 24 h, turgid weights (TW) of leaves were measured. Then, the leaves were kept in oven for 24 h at 60 oC and their
dry weights (DW) were measured. Relative water content was calculated with the following standard formula (Zhou et al., 2010):
100
x
DW
TW
DW
FW
RWC
−
−
=
Leaf pigment content
Chlorophyll a, b, Total chlorophyll and carotenoid content of flag leaves were determined according to Arnon’s (1949) method. Pigments were extracted in 80% cold acetone and the absorbance of the extractions was measured spectrophotometrically at 645, 663, and 470 nm wavelength and subsequently, Pigments content were determined.
Ion (Na+ and k+) accumulation
One hundred milligrams of finely ground shoot, root and flag leaf samples were digested in 4 mL of concentrated sulfuric acid with 0.5% selenium powder at 360 oC for 75 min
on a block digester and the digest was diluted to 75 mL. Exchangeable K and Na were estimated (Sahrawat et al., 2002) using an atomic absorption spectrophotometer (Varion model 1200, Australia).
Proline measurement
Free proline was extracted from flag leaf samples according to the method of Bates et al. (1973). Leaf samples (0.5 g) were homogenized in 10 mL of 3% (w/v) aqueous sulphosalicylic acid and the solution was filtered using Whatman No. 2 ûlter paper. Two mL of solution was then mixed with 2 mL acid ninhydrin and 2 mL glacial acetic acid in a test tube, and incubated in a water bath at 100 oC for 1 h. The reaction was terminated
by placing the mixture in an ice bath. The proline free solution was finely extracted with 4 mL toluene. Absorbance was recorded at 520 nm and proline concentration was determined as µmol g-1 fresh weight using a
standard curve.
Measurement of total protein
Frozen leaves were ground to fine powder with a mortar and pestle in liquid nitrogen and were extracted with ice-cold 0.1 M Tris-HCl buffer (pH 7.5) containing 5% (w/v) sucrose and 0.1% 2-mercaptoethanol (3:1 buffer volume/fresh weight). The homogenate was centrifuged at 12,000 x g for 20 min at 4 oC and
the supernatant was used to measure protein content. Protein content was estimated according to the method of Bradford (1976), using bovine serum albumin (BSA) as a standard and observance of 595 nm.
Statistical analysis
the relationship among traits. All statistical techniques were performed with the software IBM SPSS v. 22.
RESULTS AND DISCUSSION
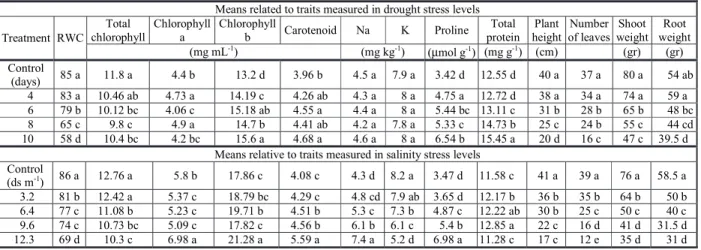
Table 1 shows the mean of different measured traits under drought and salinity stresses. The Table implies that regarding some traits such as K+ and Na+ the variation
among the data are higher in salinity stress while in some other traits such as RWC and total protein variation in drought stress are higher. This result indicates that different stresses might have different impact on the relationship among altered traits in Christ’s thorn. Hence, the relationships among traits and under different conditions were compared using different statistical methods.
The overall result of drought stress showed that the measured traits could be grouped into two different subsets. The first cluster consisted of plant height, shoot weight, number of leaves, RWC, root weight, total chlorophyll, and chlorophyll a. This cluster consisted of morphological traits mostly.
Stepwise regression was carried out for uncovering most important traits contributing to shoot weight of the Christ’s thorn. This analysis under drought stress was over in four stages or steps (Table 2). Plant height, root weight, proline, and number of leaves were imported from the model respectively. None of
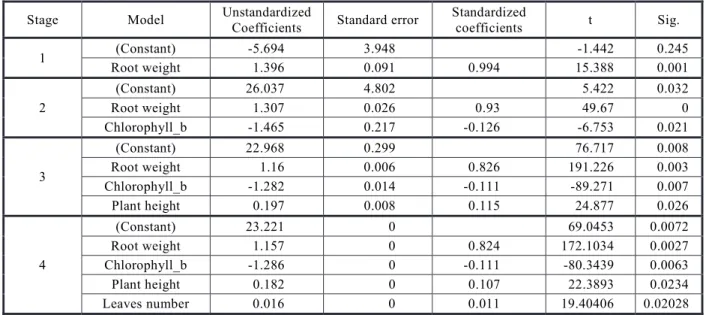
the imported variables were removed from the model. Final model (Table 2 and 3) for shoot weight aside from proline content having positively significant coefficient, others selected variables had positively significant coefficient. Similarly to drought stress condition, stepwise regression under salinity stress was completed in four steps (Table 3). Root weight, chlorophyll b, plant height, and number of leaves were respectively selected as most important factors that shoot weight is accounted for under salinity stress condition. The regression coefficients for root weight, plant height, and number of leaves were positive while the regression coefficient for chlorophyll b was negative.
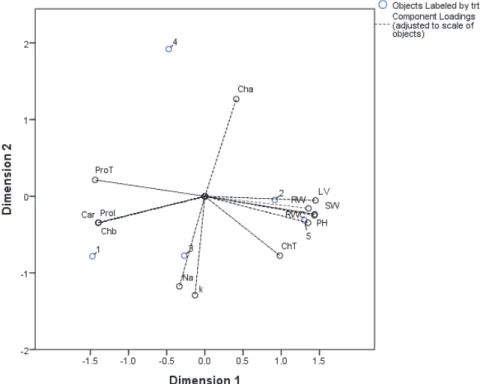
The first two components could account for overall 89.57 percent of data variation under drought and 96.80 percent under salinity stresses. Biplot graphs were depicted for both drought and salinity stresses Biplot graphs were depicted for both drought and salinity stresses (Figure 1 and Figure 2). Under drought stress chlorophyll a showed a negative relationship with Na+ and K+ content while
both of Na+ and K+ showed high positive
correlation with each other. Total protein showed no relationship with either K+ or Na+
content. Total chlorophyll showed highly positive association with number of leaves, plant height, shoot weight, root weight and RWC. Total protein had no relationship with any of the morphological traits, RWC and total chlorophyll content. Total protein content
Table 1 - Levels of salinity and drought stresses with means for all measured traits
Means related to traits measured in drought stress levels
Treatment RWC Total chlorophyll
Chlorophyll a
Chlorophyll
b Carotenoid Na K Proline
Total protein
Plant height
Number of leaves
Shoot weight
Root weight
(mg mL-1) (mg kg-1)
(µmol g-1) (mg g-1) (cm) (gr) (gr)
Control
(days) 85 a 11.8 a 4.4 b 13.2 d 3.96 b 4.5 a 7.9 a 3.42 d 12.55 d 40 a 37 a 80 a 54 ab
4 83 a 10.46 ab 4.73 a 14.19 c 4.26 ab 4.3 a 8 a 4.75 a 12.72 d 38 a 34 a 74 a 59 a
6 79 b 10.12 bc 4.06 c 15.18 ab 4.55 a 4.4 a 8 a 5.44 bc 13.11 c 31 b 28 b 65 b 48 bc
8 65 c 9.8 c 4.9 a 14.7 b 4.41 ab 4.2 a 7.8 a 5.33 c 14.73 b 25 c 24 b 55 c 44 cd
10 58 d 10.4 bc 4.2 bc 15.6 a 4.68 a 4.6 a 8 a 6.54 b 15.45 a 20 d 16 c 47 c 39.5 d
Means relative to traits measured in salinity stress levels Control
(ds m-1) 86 a 12.76 a 5.8 b 17.86 c 4.08 c 4.3 d 8.2 a 3.47 d 11.58 c 41 a 39 a 76 a 58.5 a
3.2 81 b 12.42 a 5.37 c 18.79 bc 4.29 c 4.8 cd 7.9 ab 3.65 d 12.17 b 36 b 35 b 64 b 50 b
6.4 77 c 11.08 b 5.23 c 19.71 b 4.51 b 5.3 c 7.3 b 4.87 c 12.22 ab 30 b 25 c 50 c 40 c
9.6 74 c 10.73 bc 5.09 c 17.82 c 4.56 b 6.1 b 6.1 c 5.4 b 12.85 a 22 c 16 d 41 d 31.5 d
12.3 69 d 10.3 c 6.98 a 21.28 a 5.59 a 7.4 a 5.2 d 6.98 a 11.28 c 17 c 12 e 35 d 31 d
showed high correlation with proline and chlorophyll b content. Four- and 10-day irrigation regimes were correlated with RWC in the biplot depiction. The six-day regime was correlated with Na+ and K+ content while
control was very closely correlated with proline, chlorophyll b, and carotenoid contents. The eight-day irrigation treatment showed no close distance with any of the measured traits. Under salinity stress (Figure 2), carotenoid, proline, and Na+ content showed very close
relationship on another under salinity stress. Chlorophyll a and chlorophyll b content have a positive relationship with each other. On the other hand, all morphological traits and RWC had a highly positive relationship with each other. Total protein content; chlorophyll a and b with each other; morphological traits and RWC; and also proline in line with carotenoid and Na+ showed no significant relationship because their related lines are completely crossed over each other.
Table 2 - Stepwise regression for determining most important traits relative to shoot dry matter under drought stress
Stage Model Unstandardized
Coefficients Standard error
Standardized
coefficients t Sig.
1 (Constant) 15.315 2.248 6.814 0.006
Plant height 1.587 0.071 0.997 22.397 0
2
(Constant) 24.626 0.34 72.37 0
Plant height 1.953 0.013 1.227 150.022 0
Root weight 0.421 0.014 0.243 -29.653 0.001
3
(Constant) 26.401 0.44 59.966 0.011
Plant height 1.961 0.005 1.232 418.972 0.002
Root weight 0.431 0.005 0.248 81.865 0.008
proline 0.346 0.083 -0.004 -4.168 0.015
4
(Constant) 28.525 0.382 48.57246 0.01199
Plant height 2.025 0.004 1.272 339.3673 0.00218
Root weight 0.45 0.004 0.259 66.31065 0.00872
Proline -0.75 0.072 -0.009 -3.37608 0.00635
Leaves number 0.05 0.063 0.031 2.54248 0
Table 3 - Stepwise regression for determining the most important traits relative to shoot dry matter under salinity stress
Stage Model Unstandardized
Coefficients Standard error
Standardized
coefficients t Sig.
1 (Constant) -5.694 3.948 -1.442 0.245
Root weight 1.396 0.091 0.994 15.388 0.001
2
(Constant) 26.037 4.802 5.422 0.032
Root weight 1.307 0.026 0.93 49.67 0
Chlorophyll_b -1.465 0.217 -0.126 -6.753 0.021
3
(Constant) 22.968 0.299 76.717 0.008
Root weight 1.16 0.006 0.826 191.226 0.003
Chlorophyll_b -1.282 0.014 -0.111 -89.271 0.007
Plant height 0.197 0.008 0.115 24.877 0.026
4
(Constant) 23.221 0 69.0453 0.0072
Root weight 1.157 0 0.824 172.1034 0.0027
Chlorophyll_b -1.286 0 -0.111 -80.3439 0.0063
Plant height 0.182 0 0.107 22.3893 0.0234
ChT: Total Chlorophyll; Cha: Chlorophyll a; Chb: Chlorophyll b; Prol: Proline; ProT: Total Protein; PH: Plant Height; LV: Number of Leaves; SW: Shoot Weight; RW: Root Weight. 1: Control; 2: 4 days; 3: 6 days; 4: 8 days; 5: 10 days.
Figure 1 - Biplot analysis for both treatment levels and traits measured under drought stress.
ChT: Total Chlorophyll; Cha: Chlorophyll a; Chb: Chlorophyll b; Prol: Proline; ProT: Total Protein; PH: plant Height; LV: Number of Leaves; SW: Shoot Weight; RW: Root Weight. 1: Control; 2: 3.2 ds m-1; 3: 6.4 ds m-1; 4: 9.6 ds m-1; 5: 12. ds m-1.
In the study of Bhattarai et al. (2008) on
Astragalusfilipes, the first principal component described 60.5% of the total variation among accessions, whereas the second principal component described an additional 15.4% of the total variation. The PC1 loadings were high for biomass (0.94), seed yield (0.87), combined plant height and vigor score (0.80), and combined number of stems and inflorescences (0.93), and low for crude protein (20.67) and over winter mortality (20.63). The PC2 loadings were high for seed mass (0.71).They stated that the number of stems is a reliable predictor of high biomass and seed yield.
As a result of comparing descriptive statistics separately for water and salinity stresses, some traits such as K+ and Na+ revealed higher variation under salinity stress while some other traits such as RWC and total protein showed higher variation under drought stress. Despite of the different variation ratio and variance, mean of different stresses were distinguishable from each other. According to these results, divergent stresses might have different impact on measured relationship parameters in Christ’s thorn. The relationships among measured traits were then compared using different multivariate statistical methods under both stress conditions distinctly; similar results were reported by Pirasteh Anoshe et al. (2011)
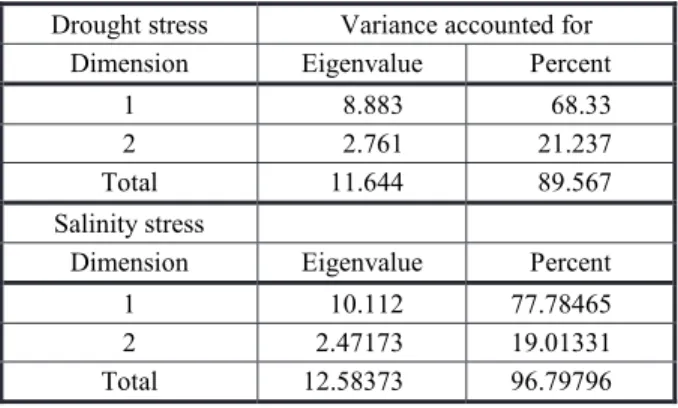
In this study, variance accounted for the relationship between the two first components of principal component analysis under drought and salinity stressful conditions, which are respectively 89.57 and 96.80. This means that
the same amount of variability among data under those conditions is interpretable by the first two components. As the first two clusters were biplot depicted, chlorophyll a showed a negative relationship with Na+ and K+ content
under drought stress while both of Na+ and K+
showed a highly positive correlation with each other. Total protein showed no relationship with either K+ or Na+ content. Proline content,
chlorophyll b, and carotenoid had a positive significant correlation with one another. Total chlorophyll showed a highly positive association with number of leaves, plant height, shoots weight, root weight and RWC. Total protein showed no relationship with any of the morphological traits and neither RWC or total chlorophyll content. Total protein content showed a high association with proline and chlorophyll b content, and similar results were reported by (Sadeghi and Robati, 2015). Four- and 10-day irrigation regimes were correlated with RWC in the biplot depiction. Irrigation at six days interval was correlated with Na+ and K+ content while control was only correlated with proline, chlorophyll b, and carotenoid contents.
Under salinity stress carotenoid, proline, and Na+ content showed a very close relationship with one another under salinity stress. Chlorophyll a and chlorophyll b content had a positive relationship with each other, and similar results were reported by (Ashraf et al., 2013). On the other hand, all morphological traits and RWC had a highly positive relationship with one another. Total protein content; chlorophyll a and b were correlated with one another; morphological traits and RWC; and also proline in line with carotenoid and Na+ showed no significant relationship because their related line are completely crossed over one another.
It could be concluded that salinity and water stress can be adverse and change the relationship among morphological and biochemical parameters in different ways. Under drought and salinity stresses, proline content and chlorophyll b concentration were effective factors towards plant rehabilitation, respectively. Under salinity and drought stress root weight, plant height and number of leaves were the most important factors contributing to rehabilitation of Christ’s thorn. Table 4 - Percentage of variance and eigenvalue relative to the
first two components under drought and salinity stresses
Drought stress Variance accounted for
Dimension Eigenvalue Percent
1 8.883 68.33
2 2.761 21.237
Total 11.644 89.567
Salinity stress
Dimension Eigenvalue Percent
1 10.112 77.78465
2 2.47173 19.01331
Principal component analysis showed that this technique can account for high variation across data under both water and salinity stresses so that it is possible to consider the relationship across the traits by using principal component in place of classic methods such as correlation coefficients. As result of principal component analysis, it was shown that changes in relationship among traits under different stresses are plausible.
ACKNOWLEDGMENTS
We would like to express our special thanks to the Department of Natural Resources and Environmental engineering, College of Agriculture, Shiraz University for the financial support for this research.
REFERENCES
Ahmed A. et al. Selection for drought tolerance in wheat population (triticum aestivum l.) by independent culling levels. World J Agric Res. 2014;2:56-62.
Ali S. et al. Amelioration of high salinity stress damage by plant growth-promoting bacterial endophytes that contain acc deaminase. Plant Physiol Biochem. 2014;80:160-7.
Arnon D.I. Copper enzymes in isolated chloroplasts. Polyphenoloxidase in beta vulgaris. Plant Physiol.
1949;24:1-15.
Ashraf M. et al. Photosynthesis under stressful
environments: An overview. Photosynthetica. 2013;51:163-90.
Barceló J. et al. Plant water relations as affected by heavy metal stress: A review. J Plant Nutr. 1990;13:1-37.
Bates L. et al. Rapid determination of free proline for water-stress studies. Plant Soil. 1973;39:205-7.
Bhattarai K. et al. Physiological and morphological
characterization of basalt milk vetch (Astragalus filipes): basis for plant improvement. Rangeland Ecol Manage.
2008;61:444-55.
Bradford M.M. A rapid and sensitive method for the quantitation of microgram quantities of protein utilizing the principle of protein-dye binding. Analytical Biochem.
1976;72:248-54.
Cochard H. et al. Unraveling the effects of plant hydraulics on stomatal closure during water stress in walnut. Plant Physiol. 2002;128:282-90.
Duran B.S. et al. Cluster analysis: A survey. New York: Springer Science & Business Media, 2013. p.3-23.
Harighi B. Bacterial leaf spot of christ’s thorn, a new disease caused by acidovorax avenae subsp. Citrulli in Iran. J Plant Pathol. 2007;89:283-5.
Hoveyzeh H. et al. A new record of pluchea cass. For Iran (compositae). Iranian J Bot. 2001;9:71-81.
Khattak G.S.S. et al. Evaluation of diverse wheat genotypes for potential biomass production through physiological parameters at seedling stage under controlled environment.
Pakistan J Bot. 2014;46:181-4.
Osakabe Y. et al. Osmotic stress responses and plant growth controlled by potassium transporters in arabidopsis. Plant Cell. 2013;25:609-24, 2013.
Osakabe Y. et al. Response of plants to water stress. Front Plant Sci. v.5, n.1, p.1-7, 2014.
Pirasteh Anosheh H. et al. Chemical priming with urea and kno3 enhances maize hybrids (Zea mays L.) seed viability under abiotic stress. J Crop Sci Biotechnol. 2011;14:289-95.
Saed-Moucheshi A. et al. A review on applied multivariate statistical techniques in agriculture and plant science. Inter J Agron Plant Produc. 2013a;4:127-41.
Saed-Moucheshi A. et al. Comparing relationships among yield and its related traits in mycorrhizal and nonmycorrhizal inoculated wheat cultivars under different water regimes using multivariate statistics. Inter J Agron. 2013b; 1:14.
Sadeghi H., Robati Z. Response of Cichorium intybus L. to eight seed priming methods under osmotic stress conditions.
Biocatal Agric Biotechnol. 2015;4:443-8.
Sahrawat K. et al. Sulfuric acid-selenium digestion for multi-element analysis in a single plant digest. Comm Soil Sci Plant Anal. 2002;33:3757-65.
SAIED, A. S. et al. Ziziphus spina-christi (l.) willd.: A multipurpose fruit tree. Genet. Resour. Crop Evol., v.55,n. 1, p.929-937, 2008.
Taghvaei M. et al.Cardinal temperatures for germination of a medicinal and desert plant, Calotropisprocera Aiton. Planta Daninha. 2015;33:671-8.
Zhou Q. et al. Changes in content of free, conjugated and bound polyamines and osmotic adjustment in adaptation of vetiver grass to water deficit. Plant Physiol Biochem.
2010;48:417-25.