Printed in Brazil - ©2007 Sociedade Brasileira de Química 0103 - 5053 $6.00+0.00
Article
*e-mail: [email protected]
The Influence of Seasonalness on the Structural Characteristics of Aquatic Humic Substances
Extracted from Negro River (Amazon State) waters: Interactions with Hg(II)
Luciana C. de Oliveira,a Ézio Sargentini Jr,b André H. Rosa,c Julio C. Rocha,*,a Marcelo L. Simões,d Ladislau Martin-Neto,d Wilson T. L. da Silvad and Ricardo L. Serudob
a
Instituto de Química, Universidade Estadual Paulista, CP 355, 14800-900 Araraquara-SP, Brazil
b
Instituto Nacional de Pesquisas da Amazônia-INPA, Manaus-AM, Brazil
c
Departamento de Engenharia Ambiental, Universidade Estadual Paulista, 18087-180 Sorocaba-SP, Brazil
d
Embrapa Instrumentação Agropecuária, 13560-970 São Carlos-SP , Brazil
Neste trabalho, substâncias húmicas foram extraídas de amostras de água coletadas mensalmente na Bacia do Rio Negro-AM para estudar suas propriedades no ambiente amazônico e interações com íons mercúrio, considerando a influência da variação sazonal na sua formação. Os parâmetros razões atômicas C/H, C/N e C/O, grupos funcionais, radicais livres do tipo semiquinona, pH, índices pluviométricos e fluviométricos, concentrações de mercúrio foram interpretados por análise hierárquica de cluster (AHC) e análise de componentes principais (ACP). As análises estatísticas mostraram que, quanto maior o índice pluviométrico e menor o índice fluviométrico maior o grau de humificação das substâncias húmicas aquáticas. A seguinte ordem decrescente do grau de humificação das SHA coletadas mensalmente pode ser estabelecida: Nov/02 a Fev/03 > Mar/02 a Mai/02 > Jun/02 a Out/02. As maiores concentrações de mercúrio foram determinadas nas amostras mais humificadas, sugerindo que devido a rearranjos inter e/ou intramoleculares, quanto maior o grau de humificação maior a afinidade dos íons Hg(II) pelas substâncias húmicas aquáticas.
In this work, humic substances were extracted from water samples collected monthly from the Negro River basin in the Amazon state (Brazil) to study their properties in the Amazonian environment and interactions with the mercury ion considering the influence of seasonalness in this formation. The C/H, C/N and C/O atomic ratio parameters, functional groups, concentration of semiquinone-type free radicals, pH, pluviometric and fluviometric indices, and mercury concentrations were interpreted using hierarchical cluster analysis (HCA) and principal component analysis (PCA). The statistical analyses showed that when the pluviometric index was greater and the fluviometric index was smaller, the degree of humification of aquatic substances was greater. The following decreasing order of the degree of humification of the AHS collected monthly was established: Nov/02 to Feb/03 > Mar/02 to May/02 > Jun/02 to Oct/02. The greatest concentrations of mercury were detected in more humidified samples. These results suggest that due to inter and/or intra-molecular rearrangements, the degree of humification of aquatic humic substances is related to its affinity for Hg(II) ions.
Keywords: aquatic humic substance, seasonality, Negro River, Amazon, mercury
Introduction
Fresh water streams have an important function in the global carbon cycle in that they conduct organic matter (OM) of terrestrial origin and transfer it to the
oceans.1 The Amazonian region is home to the most
extensive fluvial system which also has greatest liquid mass of the whole earth and it is covered by the largest
pluvial tropical forest. According to Bluntschli,2 the
function in the Amazonian ecosystem. According to
Sioli,3 the forest and the regimes of high-water and
low-water levels of this region are intimately related. The Amazon River has the greatest liquid mass with an
average annual outflow of 200,000 m3 sec-1 and drains
approximately seven million square kilometers of land
submitted to an average annual rainfall of 2,500 mm3.
According to Spitzy and Ittekkot,4 no other river on this
planet transfers more OM to the ocean than the Amazon. The Negro River is a tributary to the Amazon River and has the greatest concentration of dissolved organic
material (DOM) at around 600-900 µmol L-1, while other
tributaries of the Amazon have 300-500 mmol L-1 of
DOM.1 For this reason, the waters of the Negro River
are acidic due to this movement of OM derived mainly from extensive areas of hydromorphic podzols from the
superior portion of the basin5 and according to
Ravinchandram,6 about 80% of the DOM is in the form
of humic substances.
Humic substances (HS) are amorphic, dark and have a large content of oxygenated organic groups, such as carboxylic, phenolic, enolic, alcoholic and quinone groups, among others. They have an apparent molar mass varying from hundreds to thousands of atomic mass units (a.m.u.) and are resistant to biological and chemical
degradation.7,8 A structural model for HS has not yet been
totally elaborated explaining their chemical composition, structure, form and size. And existing models generate
controversy and discussion.9-12
Among the existing models, there are proposals, which state that HS are poli-dispersed mixtures of molecules formed by the microbial degradation of animal and plant residue. As for the aquatic humic substances (AHS), the method is based on chromatographic
extraction methods. Thurman and Malcolm13 define AHS
as a non-specific amorphic portion constituted of dissolved organic carbon (DOC) at pH 2 and absorbable in a XAD 8 non-ionic resin column having high distribution-coefficient values. The extracted fraction of DOC in a sample depends on the type of resin utilized, and on the quantity of sample and the eluent utilized. Consequently, samples of AHS extracted using different methods generally are not compatible. The properties of HS in the environment are influenced by their composition and structural characteristics, being
controlled by the humification process of the OM14,15 and
are dependant on the type of soil,16 vegetation17 and
climatic conditions.18
Humification is defined as the transformation of macromorphologically identifiable matter into amorphous compounds, as a rule involving the changes
that occur in vegetal residues or soil organic matter. It has been related to the preferential oxidation of plant polysaccharides, the selective preservation of more recalcitrant organic compounds such as lignin and phenolic structures, and to the incorporation of organic compounds of microbial origin. The best method for measuring the degree of humification is still being debated because there is no well-defined structural
model of HS structure.7,14,15
Due to the great quantity of linked land areas, the AHS interact with specimen metals in aquatic systems. Therefore, the depositing, the hydro-geochemical cycles and the bio-availability of metals such as mercury, are strongly dependant on the structural nature and the stability of the macro-molecular species that form in conjunction with the HS.
Due to its differentiated applicability and toxicity, mercury has been the focus of special attention on a global
level.19 Elevated levels of mercury have been detected in
aquatic Amazonian soils and systems in localities
geographically distant from anthropic emissions sources.20-25
As a global pollutant derived from natural and anthropic processes, mercury has a permanence time in the atmosphere which is relatively long and is transported via dry and/or wet atmospheric depositing. Intensive intemperisms and lixiviation over the most part of the year have led to the diminishing of cations in the soil. Thus, cations, mercury ions for example, can be lixiviated from the soil to the Negro River. In this case, mercury OM interpretation studies are of fundamental importance in order to help elucidate the environmental dynamics of mercury.
In this work, the influence of the water regime on the structural characteristics and properties of AHS in the Amazonian environment are being investigated, mainly in relation to their interaction with Hg(II) and the results were interpreted using hierarchical cluster analysis (HCA) and principal component analysis (PCA).
Experimental
The HS were extracted from water samples collected monthly from the Negro River (State of Amazonas-AM-Brazil) over a period of twelve months. The atomic ratio parameters of the C/H, C/N and C/O, functional groups
(obtained by 13C nuclear magnetic resonance
Reagents
Reagents of analytical grade were used and the solutions were prepared using deionized water (Milli-Q, Millipore system).
Water sample collection
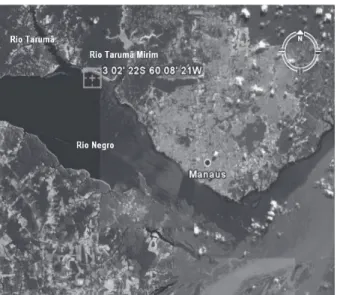
Monthly water-sample collections were done over the period of one year to verify the influence of seasonality on the structural characteristics and behavior of the AHS in the Amazonian environment. The water-sample collection points were situated on the left-hand bank of the Negro River -AM, between two tributaries, the Rio Tarumã Mirim and the Rio Tarumã Açu. This location was about 20 km west of the city of Manaus-AM (Figure 1).
Extraction of the aquatic humic substances using XAD-8 resin
The macro-porous resin, XAD-8, utilized to extract the AHS was previously purified by successive processing
with hydrochloric acid 0.50 mol L-1, sodium hydroxide
0.50 mol L-1 and methanol respectively (24 h for each
process). To realize the extraction, the procedure recommended by the International Humic Substances
Society (IHSS) was used.26 The samples were filtered using
a filtration system under vacuum having Whatman 42 filter paper and then they were acidified with hydrochloric acid
solutions of 6.0 mol L-1 until a pH of 3.0 was reached.
Then the samples were percolated by gravity through glass columns (2 cm internal diameter and 25 cm tall) packed
with XAD-8 resin, having a flow rate of 4 mL min-1. After
saturation, verified by the darkening of the resin, 10 mL
of 0.01 mol L-1 hydrochloric acid was used to remove
impurities and then eluted in 0.10 mol L-1 sodium
hydroxide having a flow rate of 1.2 mL min-1. After the
first elution, the resin was purified and the columns were once again put into operation. The pH of the final humic extract was adjusted to 5.0 (a pH similar to the Negro
River water samples) using 0.10 mol L-1 hydrochloric acid.
Purification of the humic extracts
Dialysis membranes were prepared (Samless cell 16 X 100 clear) according to the procedure described by Town
and Powell27 After treating for 10 min in a 2% solution of
sodium bicarbonate and a solution of disodium dihydrate
EDTA at 0.01 mol L-1, the membranes were washed with
deionized water at 65 °C and put in a refrigerator at about 4 °C. The humic extract was concentrated in a rotating evaporator and was purified using the dialysis membrane against deionized water until it gave a negative test for chlorides (a test using silver nitrate solution at 0.10 mol
L-1). After removing the excess dissolved salts
via dialysis, the humic extract was lyophilized according to the
procedure described by Pitombo28 and the material was
then stored in petri dishes in a dessecator.
Characterization of the aquatic humic substance samples
Elemental analysis
Carbon, hydrogen, nitrogen, sulfur and oxygen were determined in triplicate in the Thermo Finigam Flash EA1112 equipment.
Electronic Paramagnetic Resonance (EPR)
The EPR spectra were acquired in a Bruker EMX spectrometer operating in the X-band (~9 GHz) at room temperature. For quantitative analysis, quartz tubes were filled with freeze-dried AHS samples, noting down their respective masses for later normalization of the data. To
obtain the areas of the signals, the I × (ΔHPP)2
appro-ximation was used,29 where I is the derivative signal
intensity and ΔHPP is the peak-to-peak line width. To
determine the relative concentration of semiquinone-type free radicals (OFR), also defined in the text as
concentration of spins (in spins g-1 of C); the signal area
of the AHS samples was compared with a standard (“strong pitch”) of known concentration of spins supplied by Bruker. It was used too a secondary standard in according
to Singer’s method18,30 to detect possible alterations in the
Q-values of the EPR cavity. The experimental parameters were the following: 0.2 mW for the microwave power Figure 1. Map showing the sampling location site. The collection points
(determined by a power saturation experiment)31 100 kHz
for the modulation frequency; 0.1 mT for the modulation amplitude; 2.56 ms for the time constant and 10.24 ms for time conversion. The analyses were carried out in duplicate to obtain the medium deviation with at least sixteen sweeps per determination.
Nuclear Magnetic Resonance (13C NMR)
The 13C NMR experiments with cross polarization
(CP), magic angle rotation (MAS) and variable amplitude (VA) were carried out in a Varian Spectrometer (model Unity Inova 400). The samples were conditioned in a cylindrical zirconium rotor, being 5 mm in diameter (Doty Supersonic), rotating at 6 KHz in a Doty Supersonic probe
for solid samples. The VACP/MAS 13C NMR spectra were
obtained under the following experimental conditions: a
resonance frequency of 100 MHz for 13C, a spectral band
of 20 KHz, a proton preparation pulse of 3.8 µs, a contact
time of 1 ms, an acquisition time of 12.8 ms and a relax waiting time of 500 ms. As a reference of the chemical shift in the spectra, hexamethilbenzene (HMB) was used.
Digestion of the AHS samples and the determination of mercury
To 0.20 g of AHS, 5.0 ml of hydrogen peroxide solution (30% solution) was added slowly and under agitation to solubilize the AHS. When the sample was totally dissolved, 15.0 mL of sulfonitric solution was added slowly to give a ratio of 1:1 (v/v) while keeping the sample solution in an ice bath. The solution was heated for one
hour to a temperature of 70°C and then after cooling to
room temperature, 10.0 mL of potassium permagamate (7.5% m/v) was added. After 15 min, 5.0 mL of potassium persulphate (8% m/v) was added. The solutions containing
the AHS samples were heated for two hours to 70°C and
then they were left to rest for twelve hours. Hidroxilamine chloride solution (12%m/v) was added, sufficient to reduce
the remaining potassium permagamate and then shortly afterwards mercury determinations were undertaken using atomic absorption spectrometry with cold vapor generation.32,33
Results and Discussion
In environmental studies where generally a great number of variables must be considered simultaneously, multivaried techniques have been shown to be efficient in evaluating correlations and interpreting the results obtained. In this case, Principal Component Analysis (PCA) and Hierarchical
Cluster Analysis (HCA) have been the most utilized.34,35 The
PCA reduces the dimension of the original data, facilitating the interpretation of the more important information in a lesser number of main factors or components. HCA has as objective, the observation of formation of natural groups in a hierarchical structure in which the samples are placed in a system of groups and subgroups depending on the degree of similarity between them.
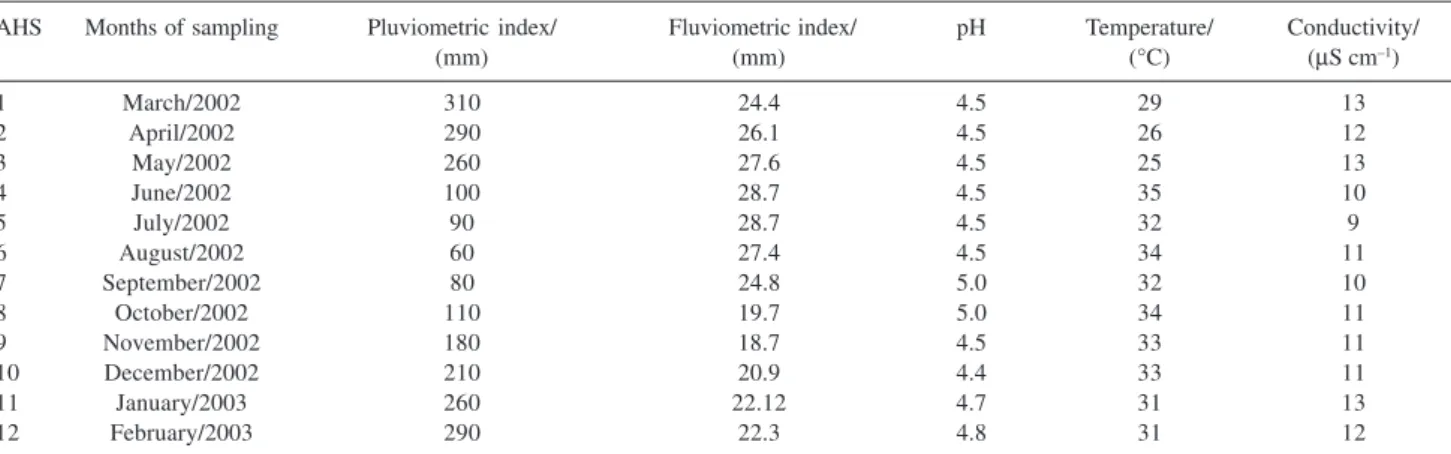
According to fluviometric indices, the Amazonian region is influenced by high-water and low-water periods. The average levels between March/02 and February/03 showed that the lowest water levels occurred between October and November (between 18.67 m and 19.69 m) and the highest between June and July (28.7 m) (Table 1). In the flooding (high-water) periods, the waters of the Negro River flood the forests, the marshes and streams. As of June, the low-water levels begin taking the waters out of the forests and in the dry season, between October and February, the streams remain in small channels. The low pH of the water in the tributaries of the Negro River is due to the great transport of various HS from extensive areas of hydromorphic podzols in the superior portion of
the basin. The conductivity values (mS cm-1) of the
so-called black waters indicated their low content of dissolved
solids, corroborating with Fadini and Jardim,20 who
Table 1. Pluviometric and fluviometric indices and complementary information related to the water samples from Negro River-AM
AHS Months of sampling Pluviometric index/ Fluviometric index/ pH Temperature/ Conductivity/
(mm) (mm) (°C) (µS cm–1)
1 March/2002 310 24.4 4.5 29 13
2 April/2002 290 26.1 4.5 26 12
3 May/2002 260 27.6 4.5 25 13
4 June/2002 100 28.7 4.5 35 10
5 July/2002 90 28.7 4.5 32 9
6 August/2002 60 27.4 4.5 34 11
7 September/2002 80 24.8 5.0 32 10
8 October/2002 110 19.7 5.0 34 11
9 November/2002 180 18.7 4.5 33 11
10 December/2002 210 20.9 4.4 33 11
11 January/2003 260 22.12 4.7 31 13
determined the average conductivity to be about 15 µS
cm-1 in water samples taken from the Negro River.
The H/C, C/N, C/O atomic ratios obtained from element analysis (Table 2) have been utilized to aid the characterization of HS and the comparison of HS from different matrices can indicate the degree of similarity between them. Utilizing these ratios,
Leenheer36 and Ertel
et al.37 verified structural
similarities of AHS in comparison with HS from soil samples from the central-Amazonian-basin region indicating that the AHS from black-water rivers are originally from podzol-type soils.
The H/C and C/N atomic ratios give an indication of
the structure and molecular shape of the HS.38 The
hydrogen content is related to the degree of saturation. Or in other words, an increase in the hydrogen content
indicates a greater number of aliphatic carbons (CH2) than
aromatic carbons (C=C).39 The values of the H/C atomic
ratios for samples of AHS vary between 1.17 and 1.33 (Table 2).
These values are close to the ones cited in literature for related researchers (Table 3). The samples indicate carbon atoms having more aliphatic characteristics when
compared with the data of Leenheer36 and Ertel et al.37
However, in relation to the data obtained by Sargentini et
al,40 the samples present more aromatic characteristics.
The C/N atomic ratios varied between 17.1 and 27.4 indicating a seasonal influence in the degree of humification of the AHS. Comparing the C/N atomic ratios with those found in literature (Table 3), there is an inference of a lesser degree of humification of the AHS samples utilized in this study, but also comparable to values obtained for OM extracted from samples taken from the Amazon River having particle sizes between 0.1 and 63 µm.41
The C/O atomic ratio is related to the carbohydrate content of the HS. Elevated values of this ratio indicate a greater degree of humification due to the diminishing of
carbohydrate content.7 Values of O/C can also represent a
greater presence of COOH and OH groups (both aromatic and aliphatic). From the results obtained, it can be observed that the C/O atomic ratios vary between 1.32 and 2.20, inferring differences in the degree of humification of the AHS.
The 13C NMR results indicated significant differences
in the content of functional groups present in the samples
Table 3. Atomic ratios (H/C, C/N e C/O) of different samples of humic substance according to the literature
Samples Atomic ratios References
H/C C/N C/O
AHS (Negro River ) 1.18 33.3 1.42 Leenheer36
AHS (Negro River ) 1.70 25.6 1.60 Sargentini et al.40
HA (Negro River ) 1.47 24.7 0.98 Sargentini et al.40
FA (Negro River ) 1.52 24.7 0.97 Sargentini et al.40
HA (Negro River ) 0.79 58.1 nd Ertel et al.37
FA (Negro River) 0.95 85.0 nd Ertel et al.37
DOM (Negro River) nd 25.0 nd McClain et al.1
OM particles > 63 mm (Amazon River) nd 24.0 nd Hedges et al.41
OM particles (0.1-63 mm) (Amazon River) nd 15.0 nd Hedges et al.41
DOM (0.001-0.1 mm) (Amazon River) nd 34.0 nd Hedges et al.41
nd - not detected, AHS - aquatic humic substance, HA - humic acid, FA - fulvic acid, DOM - dissolved organic matter, OM - organic matter.
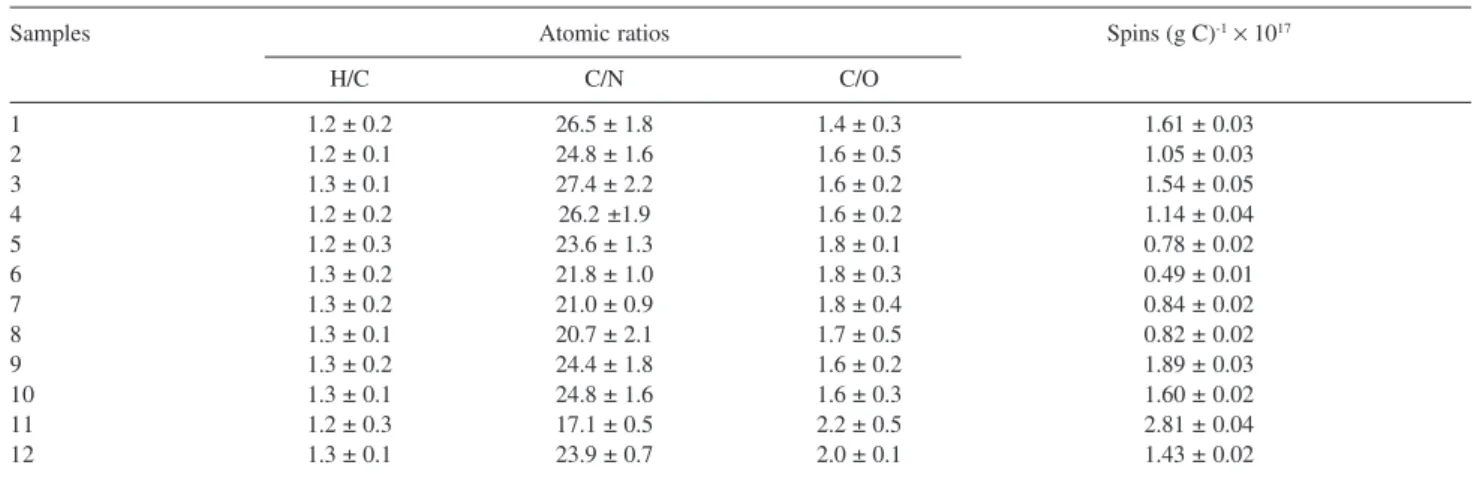
Table 2. H/C, C/N and C/O atomic ratios, spin concentration (spins (g C)-1) of aquatic humic substances extracted from Negro River-AM
Samples Atomic ratios Spins (g C)-1× 10¹⁷
H/C C/N C/O
1 1.2 ± 0.2 26.5 ± 1.8 1.4 ± 0.3 1.61 ± 0.03
2 1.2 ± 0.1 24.8 ± 1.6 1.6 ± 0.5 1.05 ± 0.03
3 1.3 ± 0.1 27.4 ± 2.2 1.6 ± 0.2 1.54 ± 0.05
4 1.2 ± 0.2 26.2 ±1.9 1.6 ± 0.2 1.14 ± 0.04
5 1.2 ± 0.3 23.6 ± 1.3 1.8 ± 0.1 0.78 ± 0.02
6 1.3 ± 0.2 21.8 ± 1.0 1.8 ± 0.3 0.49 ± 0.01
7 1.3 ± 0.2 21.0 ± 0.9 1.8 ± 0.4 0.84 ± 0.02
8 1.3 ± 0.1 20.7 ± 2.1 1.7 ± 0.5 0.82 ± 0.02
9 1.3 ± 0.2 24.4 ± 1.8 1.6 ± 0.2 1.89 ± 0.03
10 1.3 ± 0.1 24.8 ± 1.6 1.6 ± 0.3 1.60 ± 0.02
11 1.2 ± 0.3 17.1 ± 0.5 2.2 ± 0.5 2.81 ± 0.04
of AHS (Table 4). The more aliphatic samples were extracted from water samples collected in the months of March/02; April/02 and May/02. And the more aromatic samples in the month of Oct/02, Nov/02; Dec/02; Jan/03 and Feb/03, thus giving inference to a greater degree of
humification of these samples. Rocha et al.,42
charac-terizing samples of AHS samples extracted from water collected in the Amazon region, observed a greater aromatic characteristic than for the samples studied in this work (Table 4).
The Organic Free Radicals (OFR) in HS, detectable
using EPR, is attributed to semiquinone structures43
possibly conjugated to aromatic rings, being these groups formed in the OM from the oxidated
dehydro-genation of phenolic compounds.7,44 According to
Senesi,45 another possibility that cannot be excluded is
the contribution from methoxybenzene and nitrogen-associated radicals. These are only hypotheses, since there is no consensus as yet as to the exact origin of
the free radical signal in HS.45,46
It has been shown that the OFR concentration is
proportional to the humification of the SOM.18,44,45,48,49
Normally, humification process is related to the content
of aromatic compounds.50,51 Along with this, the
determination of the OFR concentration gives an indirect
estimation of the degree of aromaticity of the HS.43 Table
2 shows the values of the OFR concentration, where it can be seen that the values vary from 0.49 × 10¹⁷ spins g-1
of C to 2.81 × 10¹⁷ spins g-1 of C for samples 6 (Aug/02)
and 11 (Jan/03), respectively. These maximum and minimum values indicate a substantial variation in the OFR concentration of the AHS analyzed. However, these values are below the values normally encountered for
humic acids from soil.18,52
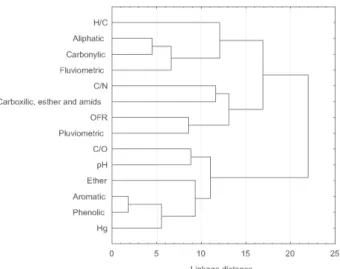
The statistical methods of extrapolational analysis, hierarchical cluster analysis (HCA) and principal component analysis (PCA) were used to interpret the experimental data generated from the different deter-minations using STATISTICA 6.0 software. Hierarchical cluster analysis (Figure 2) showed the formation of three main groups: (A) H/C atomic ratios, aliphatic carbon, carbonyl carbon and fluviometric index; (B) C/N, carboxyl carbon, OFR, and pluviometric index; (C) C/ O, pH, ether, aromatics, phenolics and the concentration of mercury.
Group “A” indicates correlation between the level of the river, AHS aliphaticity and therefore, H/C ratio. In this way, the AHS extracted in the period where the fluviometric index is greater, the degree of humification of these AHS is smaller. Group “B” shows the direct
Table 4. Peak assignments for the 13C NMR spectra of the aquatic humic substances extracted from Negro River and their integrated areas (%)
Samples Assignments / Integration %
Alkyl-C O-alkyl-C Aromatic and Carboxylic Carbonylic
Metoxyl and Phenolic Carbon Carbon
Alkyl-N (0-65 ppm) (65-110 ppm) (110-165 ppm) (165-185 ppm) (185-230 ppm)
1 53.1 17.1 9.3 9.6 10.9
2 56.8 16.1 7.5 10.6 8.9
3 65.1 5.6 9.1 10.3 9.9
4 50.5 21.8 8.5 10.1 9.1
5 47.9 24.3 9.2 9.3 9.3
6 47.5 23.9 8.8 10.4 9.5
7 47.5 23.3 11.2 10.0 8.1
8 36.8 29.2 18.9 9.7 5.3
9 36.6 29.4 18.5 10.2 5.3
10 36.9 28.7 19.8 10.1 4.5
11 37.1 28.9 19.8 9.6 4.6
12 36.9 29.7 18.2 10.3 4.9
(Rocha et al.42) 33.0 17.0 35.0 12.0 3.0
relationship between the C/N atomic ratio, the OFR, the pluviometric index and the carboxylic groups. These parameters are inter-linked by the degree of
humi-fication. Martin-Neto et al.18 encountered significant
positive linear correlation between the OFR con-centration and the pluviometric index. According to
Stevenson,7 the C/N atomic ratios is proportional to the
HS humification degree. The presence of carboxylic groups in this cluster is probably due to the fact that these groups are the most oxidated and therefore related to the most refractory OM. Group “C” indicates that the greater the C/O atomic ratio, the greater the
aromaticity of these HS. Stevenson7 described the
relationship between the C/H, C/N and C/O atomic ratios and the degree of humification of the HS. According to the statistical analysis of Group “C”, the mercury concentrations are also related to the C/O atomic ratios, aromatic groups or, in other words, parameters that suggest a greater degree of humification of the HS. In this way, the greatest concentrations of mercury are present in the more humified AHS samples. Due to the buffering effect of the HS, the water pH does not vary significantly as observed in Table 1, and so it is neither related to the fluviometric (Group “A”) nor the pluviometric parameters (Group “B”).
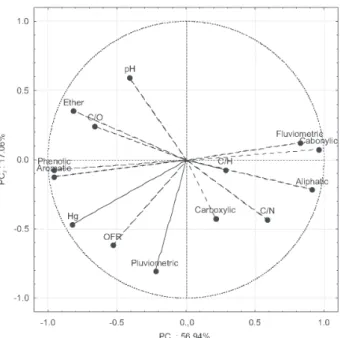
In Figure 3, the positive weights of fluviometric, carbonylic, aliphatic, C/N and carboxylic variables and the negative weights of phenolic, aromatic, mercury concentration, C/O and ester variables can be observed
in the PC1, which explains 56.94% of the total variance
of the data.
The positive-weight variables in the PC1 are related to
the AHS containing a greater content of fulvic acids. This is observed due to the fluviometric index parameters along with the aliphatic, carbonylic and carboxylic groups having elevated positive values in this CP. The
negative-weight variables in the PC1 are related to the samples
containing a greater humic acid content (the presence of phenolic and aromatic groups). When the fluviometric index is high (high-water periods), mainly the transport of more recently-formed OM occurs and so, the samples having positive values for this PC have a lesser degree of humification.
Due to the OFR concentration parameters, the concentration of mercury and the pluviometric index being negative-weight variables and having a strong
influence over the PC2, this PC is related to the degree
of humification of the HS. The OM lixiviation process for the aquatic system caused by the rains is evidenced in this CP. In this case, it refers to a slower drainage causing a dragging of HS in a more advanced state of
decomposition. The samples with negative values for PC2
have a greater degree of humification and, as described in the previous paragraph, the samples with negative
values for PC1 also have a greater degree of humification.
And so it can be seen that samples with negative values for the two PCs have a greater degree of humification. In summary, analyzing the graphs of Figures 3 and 4
Figure 3. Principal component analysis of the whole data set. Correla-tions between the parameters (pH, atomic ratios, concentration of Hg, OFR, functional groups, pluviometric and fluviometric indices) and prin-cipal components in the projection of components 1 and 2.
together, the following decreasing order of AHS humification can be established as a function of seasonality: Nov/2002 to Feb/2003 > Mar/2002 to May/ 2002 > Jun/02 to Oct/02.
The statistical analyses showed that the more humified samples have the greatest mercury content and the phenolic, aromatic and ester groups were predominant in
their interaction with mercury. According to Sargentini et
al.,40 the metal-OM complex tends to stabilize itself as a
function of time where inter and/or intra-molecular rearrangements occur with the transfer of the metal itself to the more internal complexation sites of humic structures. In this way, the results obtained show that the more humified samples having a greater content of the phenolic/aromatic/ester groups have a greater con-centration of mercury possibly related to the lixiviation of more humified OM in the soil for the aquatic system.
Conclusions
The Amazon region is characterized by its great variety of soils with floodable and non-floodable areas having particular characteristics of biodiversity, temperature and humidity. The region’s high-water and low-water regimes have a strong influence over the formation, properties and the characteristics of the humic material present in the rivers of the region, which was evidenced by the multivaried analyses undertaken. According to statistical analysis, the following decreasing order of the humi-fication degree can be established: Nov/02 to Feb/03 > Mar/02 to May/02 > Jun/02 to Oct/02. These results show that the greater the level of the river, the lower the degree of humification of the AHS. The relationships obtained from the HCA showed strong correlation between pluviometric index, concentration of semiquinone-type free radicals and the C/N atomic ratio, parameters which are related to a greater degree of humification. This shows that the pluviometric index is directly related to more humified OM.
Thus, the greater pluviometric index and the smaller fluviometric index, the greater the humification degree of the AHS. Along with this, the statistical analyses showed that the mercury concentrations are related to the more humified AHS samples and have greater interaction with samples having greater aromatic/ phenolic/ester group content. In other words, the humification degree is proportional to the stability of the metal-OM complex due to inter and/or intra-molecular rearrangements bringing about transfers between the metal itself to the more internal com-plexation sites of the humic structures.
Acknowledgments
Thanks to FAPESP, CNPq, CAPES and FUNDUNESP
for their financial support and study fellowships.
References
1. McClain, M.E.; Richey, J.E.; Brandes, J.A.; Global Biogeochem.
Cycles 1997, 11, 295.
2. Bluntschli, H. A.; Cadernos da Amazônia1921,1, 1. 3. Sioli, H.; Amazônia: Fundamentos da Ecologia da Maior
Região de Florestas Tropicais, Vozes: Petrópolis, 1985. 4. Spitzy, A.; Ittekkot, V.; In Ocean Margin Processes in Global
Change;Mantoura, R.F.C.; Martin, J.M.; Wollast, R., eds., John Wiley: Chichester, 1991, pp. 5-17.
5. Ivanissevich, A.; Ciência Hoje1990, 11, 47. 6. Ravichandran, M.; Chemosphere2004,55, 319.
7. Stevenson, F. J.; Humus Chemistry, 2nd ed., Wiley: New York, 1994.
8. Schulten, H.R.; Schnitzer, M.; Naturwissenschaften1995, 82, 487. 9. Clapp, C. E.; Hayes, M.H.B.; Soil Sci.1999, 164, 777. 10. Burdon, J.; Soil Sci.2001, 66, 752.
11. Hayes, M. H. B.; Clapp, C.E.; Soil Sci.2001, 166, 723. 12. Piccolo, A.; Soil Sci.2001, 166, 810.
13. Thurman, E. M. ; Malcolm, R. L.; Environ. Sci. Technol.1981,
15, 463.
14. Piccolo, A.; In Humic Substances Versatile Components of Plants, Soil And Water.; Davies, G.; Ghabbour, E.A., eds., Royal Society of Chemistry: Cornwall, 2000, pp. 111-124.
15. Rosa, A. H.; Simões, M. L.; Oliveira, L. C.; Rocha, J. C.; Martin-Neto, L.; Milori, D. P. M. B.; Geoderma 2005,127, 1. 16. Baldock, J. A.; Oades, J. M.; Waters, A. G.; Peng, X.; Vassalo,
A. M.; Wilson, M. A.; Biogeochemistry1992,16, 1. 17. Quideau, S.A.; Chadwick, O.A.; Benesi, A.; Graham, R.C.;
Anderson, M. A.; Geoderma2001, 104, 41.
18. Martin-Neto, L.; Rosell, R.; Sposito, G.; Geoderma1998, 81,
305.
19. Bringmarck, L.; In Mercury And its Effects on Environment
and Biology. Sigel, A.; Sigel, H. eds, Marcel Dekker: New York, 1997.
20. Fadini, P. S.; Jardim, W. F.;Sci. Total Environ. 2001, 275, 71. 21. Oliveira, S. B.; Melfi, A. J.; Fostier, A. H.; Forti, M. C.; Favaro,
D. I. T.; Boulet, R. ; Water, Air, Soil Pollut.2001, 26, 321. 22. Valle, C. M.; Santana, G. P.; Augusti, R.; Egreja Filho, F. B.;
Windmoller, C. C. ; Chemosphere2005, 58, 779.
23. Barbosa, A. C.; Souza, J.; Dórea, J. G.; Jardim, W. F.; Fadini, P. S. ; Arch. Environ. Contam. Toxicol. 2003,45, 235.
24. Forsberg, M.C.S.; Forsberg, B.R.; Zeidemann, V.K.; Ambio
1999, 285,19.
25. Malm, O.; Pfeiffer, W. C.; Souza, C. M. M.; Reuther,; R. Ambio
26. Malcolm, R.; Thurman, E. M. In Aquatic and Terrestrial Humic Materials; Christman, R. F.; Gjessing, E. T.; eds., Ann Habor Science: Ann Arbor, 1985.
27. Town, R. M.; Powell, H. K. J.; Anal. Chim. Acta1992, 256, 81. 28. Pitombo, R.N.M.; Ciência e Cultura (SBPC) 1989, 41, 427. 29. Poole Jr., C.P.; Electron Spin Resonance: A Comprehensive
Treatise on Experimental Techniques, Wiley: New York, 1967. 30. Singer, L.S.; J. Appl. Phys.1959, 30, 1463.
31. Weil, J. A.; Bolton, J. R.; Wertz, J. E.; Electron Paramagnetic Resonance: Elementary Theory and Practical Applications,
Willey: New York, 1994.
32. Rocha, J.C.; Santos, A.; Sene, J.J.; Eclética Química1994, 19,
119.
33. Jackwerth, E.; Wilmer, P. G.; Hohn, R.; Berndt, H.; At. Absorpt.
Newsl.1979, 18, 66.
34. Burns, W. A.; Mankiewicz, P. J.; Bence, A. E.; Page, D. S.; Parkers, K. R. A.; Environ. Toxicol. Chem.1997, 16, 1119. 35. Salau, J. S. I.; Tauler, R.; Bayona, J. M.; Tolosa I.; Environ.
Sci. Technol.1997,31, 3482.
36. Leenheer, J. A.; Acta Amazonica1980, 10, 513.
37. Ertel, J.; Hedges, J. I.; Richey, J. E.; Devol, A. H.; Richey, J. E.; Ribeiro, M. N. G.; Limnol. Oceanogr. 1986,31, 739. 38. Steelink, C. In Implications of Elemental Characteristics of
Humic Substances. Aiken, G. R.; Mcknight, M. D.; Wershaw, R. L.; Maccarthy, P.; eds., John Wiley & Sons: New York, 1985. 39. Traina, S. J. ; Novak, J.; Smeck, N. E.; J. Environ. Qual.1990,
19, 151.
40. Sargentini Jr. E., Rocha, J. C.; Rosa, A. H.; Zara, L. F.; Santos, A.; Quim. Nova2001,24, 339.
41. Hedges, J. I.; Mayorga, E.; Tsamakis, E.; McClain, M. E.; Aufdenkampe, A.; Quay, P.; Richey, J. E. Limnol. Oceanogr.
2000, 45, 1449.
42. Rocha, J. C.; Sargentini Jr., E.; Toscano, I. A. S.; Rosa, A. H.; Burba, P.; J. Braz. Chem. Soc. 1999,10, 169.
43. Budziak, C.R.; Maia, C.M.B.F.; Mangrich, A.S.; Quim. Nova
2004,27, 399.
44. Riffaldi, R.; Schnitzer, M.; Soil Sci. Soc. Am. Proc.1972, 36, 301.
45. Senesi, N.; Adv. Soil. Sci.1990, 14, 77.
46. Cheshire, M.V.; Mcpahil, D.B.; European. J. Soil Sci.1996,
47, 205.
47. Olk, D.C.; Brunetti, G., Senesi, N.; Soil Sci. Soc. Am. J.2000,
64, 1337.
48. Novotny, E. H.; Martin-Neto, L.; Geoderma2002,106, 305. 49. Pajaczkowska, J.; Sulkowska, A.; Sulkowski, W.W.;
Jedrzejczyk,M.; J. Mol. Struct.,2003,651, 141.
50. Kögel-Knabner, I.; Zech, W.; Hatcher, P.G.; Soil Sci. Soc. Am.
J.1991, 55, 241.
51. Leinweber, P.; Fründ, R.; Reuter, G. Z.; Pflanzernernähr.
Bodenk. 1993,156, 415.
52. Martin-Neto, L.; Andriullo, A. E.; Traghetta, D.G.; Soil Sci.
1994,157, 365.
Received: October 16, 2006
Web Release Date: July 19, 2007