BGD
7, 203–250, 2010Laboratory measurements of nitric oxide release
from forest soil
A. Bargsten et al.
Title Page
Abstract Introduction
Conclusions References
Tables Figures
◭ ◮
◭ ◮
Back Close
Full Screen / Esc
Printer-friendly Version
Interactive Discussion
Biogeosciences Discuss., 7, 203–250, 2010 www.biogeosciences-discuss.net/7/203/2010/ © Author(s) 2010. This work is distributed under the Creative Commons Attribution 3.0 License.
Biogeosciences Discussions
This discussion paper is/has been under review for the journal Biogeosciences (BG). Please refer to the corresponding final paper in BG if available.
Laboratory measurements of nitric oxide
release from forest soil with a thick
organic layer under di
ff
erent understory
types
A. Bargsten1, E. Falge1, B. Huwe2, and F. X. Meixner1,3
1
Biogeochemistry Department, Max Planck Institute for Chemistry, 55020 Mainz, Germany 2
Soil Physics Department, University of Bayreuth, Germany 3
Physics Department, University of Zimbabwe, Harare, Zimbabwe
Received: 17 December 2009 – Accepted: 28 December 2009 – Published: 13 January 2010 Correspondence to: A. Bargsten (anika.bargsten@mpic.de)
BGD
7, 203–250, 2010Laboratory measurements of nitric oxide release
from forest soil
A. Bargsten et al.
Title Page
Abstract Introduction
Conclusions References
Tables Figures
◭ ◮
◭ ◮
Back Close
Full Screen / Esc
Printer-friendly Version
Interactive Discussion
Abstract
Nitric oxide (NO) plays an important role in the photochemistry of the troposphere. NO from soil contributes up to 40% to the global budget of atmospheric NO. Soil NO emis-sions are primarily caused by biological activity (nitrification and denitrification), that occurs in the uppermost centimetres of the soil, a soil region often characterized by
5
high contents of organic material. Most studies of NO emission potentials to date have investigated mineral soil layers. In our study we sampled soil organic matter under different understories (moss, grass, spruce and blueberries) in a humid mountainous
Norway spruce forest plantation in the Fichtelgebirge (Germany). We performed labo-ratory incubation and fumigation experiments using a customized chamber technique
10
to determine the response of net potential NO flux to physical and chemical soil con-ditions (water content and temperature, bulk density, particle density, pH, C/N ratio, organic C, soil ammonium, soil nitrate). Net potential NO fluxes (in terms of mass of N) from soils of different understories ranged from 1.7–9.8 ng m−2
s−1
(grass and moss), 55.4–59.3 ng m−2s−1(spruce), and 43.7–114.6 ng m−2s−1(blueberry) at optimum
wa-15
ter content and a soil temperature of 10◦C. The water content for optimum net potential NO flux ranged between 0.76 and 0.8 gravimetric soil moisture for moss, between 1.0 and 1.1 for grass, 1.1 and 1.2 for spruce, and 1.3 and 1.9 for blueberries. Effects of soil
physical and chemical characteristics on net potential NO flux were statistically signifi-cant (0.01 probability level) only for NH+4. Therefore, the effects of biogenic factors like
20
understory type, amount of roots, and degree of mycorrhization on soil biogenic NO emission are discussed; they have the potential to explain the observed different of net
potential NO fluxes. Quantification of NO emissions from the upmost soil layer is there-fore an important step to quantify soil NO emissions in ecosystems with substantial organic soil horizons.
BGD
7, 203–250, 2010Laboratory measurements of nitric oxide release
from forest soil
A. Bargsten et al.
Title Page
Abstract Introduction
Conclusions References
Tables Figures
◭ ◮
◭ ◮
Back Close
Full Screen / Esc
Printer-friendly Version
Interactive Discussion
1 Introduction
Nitric oxide (NO) is a reactive gas which plays a central role in the photochemistry of the troposphere (Crutzen, 1979). The photochemistry of NO and nitrogen dioxide (NO2) is
important for the generation/destruction of tropospheric ozone and, hence, regulates the oxidizing capacity of the troposphere. The oxidation products of NO (gaseous NO2, 5
nitrous and nitric acid, particulate nitrite and nitrate) also contribute to the generation of acid rain (Crutzen, 1979) affecting human health and plant productivity.
With respect to NO biosphere-atmosphere exchange, soils are of great interest due to the fact that NO biogenic emissions from soil contribute up to 40% to the global budget of atmospheric NO (Davidson and Kingerlee, 1997; Meixner, 1994; Denman
10
et al., 2007; Rudolph and Conrad, 1996). Kesik et al. (2005) predicted that by 2039 soil NO emissions will increase by 9%. Although soils have the potential for (Conrad, 1994) and act infrequently as a net sink (Meixner, 1994) of atmospheric NO, but only a few studies provide an indication of soils acting as a sink (Dunfield and Knowles, 1998; Skiba et al., 1994; Slemr and Seiler, 1991). The NO flux between soil and
15
atmosphere is a result of microbial consumption and production of NO in the top soil layer. NO production and consumption occur simultaneously during nitrification and denitrification (Remde et al., 1989; Rudolph and Conrad, 1996; Skiba et al., 1997; Firestone and Davidson, 1989). Nitrification is the oxidation of ammonium to nitrate and denitrification is the reduction of nitrate to molecular nitrogen. In both soil microbial
20
processes NO can be an intermediate, it can be released and also absorbed (Galbally, 1989).
In most cases the organic layer is the only soil layer in direct contact with the atmo-sphere. There are soils having an organic layer with a thickness of 10 cm or more; these thick organic layers are mostly a kind of moder or raw humus (Scheffer and
25
upper-BGD
7, 203–250, 2010Laboratory measurements of nitric oxide release
from forest soil
A. Bargsten et al.
Title Page
Abstract Introduction
Conclusions References
Tables Figures
◭ ◮
◭ ◮
Back Close
Full Screen / Esc
Printer-friendly Version
Interactive Discussion
most organic layer. In their experiment with intact soil cores from a spruce forest site they found that the organic layer contributed over 86% to the NO emission from soil. It is also known that nitrification occurs predominantly in the first few centimeters of soils (Papke and Papen, 1998; Rudolph and Conrad, 1996; Laville et al., 2009; Venterea et al., 2005; Remde et al., 1993; Jambert et al., 1994). Venterea et al. (2005) found
5
actually the highest NO production in the first centimetre. Organic soils support high nitrification and denitrification rates and may be important hot spots of NO emission (Guthrie and Duxbury, 1978). Denitrification, in contrast, normally occurs in deeper soil layers or in the water table. In this respect, the role of organic matter is potentially important (Jambert et al., 1994).
10
In forests the type of understory influences NO exchange between the soil and the trunk space (Jambert et al., 1994; Pilegaard et al., 1999). Most studies to date have focused on the influence of the overstory vegetation and/or soil nutrients (Fowler et al., 2009; Venterea et al., 2004; Pilegaard et al., 2006). As reported by Oberdorfer (1994), Norway spruce forests fall into a series of plant sociological associations, which are
15
characterized by the main understory species present (e.g.Calamagrostio villosae –
Piceetum). Within one individual forest stand the understory might be composed of patches characterized by different species (e.g. Calamgrostis villosa, Vaccinium
myr-tillus, Descampsia caesoitosa). There are only a few studies how plants influence the NO exchange between soil and atmosphere (St ¨ohr and Stremlau, 2006; St ¨ohr and
Ull-20
rich, 2002), and there is a considerable lack of knowledge in this area. Other gases like carbon dioxide (CO2), methane (CH4) or nitrous oxide (N2O) are better explored
in this direction (Philippot et al., 2009; Rudolph and Conrad, 1996; Ruser et al., 1998; Flessa et al., 2002; Gasche and Papen, 1999; Butterbach-Bahl et al., 2002).
To investigate the effect of soil physical and chemical parameters and understory
25
BGD
7, 203–250, 2010Laboratory measurements of nitric oxide release
from forest soil
A. Bargsten et al.
Title Page
Abstract Introduction
Conclusions References
Tables Figures
◭ ◮
◭ ◮
Back Close
Full Screen / Esc
Printer-friendly Version
Interactive Discussion
2 Material and methods
2.1 Sample site
The field site is located at Weidenbrunnen (50◦09′N, 11◦34′E, 774 m a.s.l.) which is situated in the Fichtelgebirge Mountains, NE Bavaria, Germany. The site is mainly covered by 55-year-old Norway spruce (Picea abies) with significant variability in the
5
understory. There are four different main understory types: moss, grass (
Deschamp-sia flexuosaandCalamagrostis villosa), blueberries (Vaccinium myrtillus), and young spruce which cover 45, 19, 7 and 13%, respectively, of the total surface area of the Wei-denbrunnen site (Behrendt, 2009). Mean annual air temperature of the WeiWei-denbrunnen site is 5.3◦C, mean annual soil temperature is 6.3◦C, and mean annual precipitation is
10
approximately 1160 mm (1971–2000; Foken, 2003; Falge et al., 2003). The soil type was classified as cambic podzol over granite (Subke et al., 2003), and the texture is sandy loam to loam, with relatively high clay content in the Bh horizon. The mineral soil is characterised by low pH values (<4). The soil litter and the organic horizon had a thickness between 5 and 9 cm (Behrendt, 2009). The organic layer is classified as
15
a moder consisting of Oi, Oe, and Oa horizons. More details concerning the site can be found in Gerstberger et al. (2004).
2.2 Soil sampling and preparation
In September 2008, soil samples for the laboratory study on NO release were taken from the O horizon at patches below the main understory types: moss, grass, young
20
spruce, and blueberries. An individual understory patch has been defined, such that one square meter of understory area has to be covered mainly (>50%) with the respec-tive understory vegetation. Two samples were taken for each understory type, resulting in a total of eight soil samples. The soil samples were air dried and then stored at 4◦C until analysis. All measurements were performed within 5 months after sampling.
25
BGD
7, 203–250, 2010Laboratory measurements of nitric oxide release
from forest soil
A. Bargsten et al.
Title Page
Abstract Introduction
Conclusions References
Tables Figures
◭ ◮
◭ ◮
Back Close
Full Screen / Esc
Printer-friendly Version
Interactive Discussion
a 16 mm mesh to homogenise the soil and, all green biomass was removed. This can be contrasted with previous studies of mineral soils and sands where samples were sieved through 2 mm mesh (van Dijk and Meixner, 2001; van Dijk et al., 2002; Feig et al., 2008; Yu et al., 2008; Gelfand et al., 2009). A 16 mm mesh was chosen, based on tests sieving Weidenbrunnen organic matter through 2, 4, 8, and 16 mm
5
mesh sizes. These experiments showed, that sieving through a 2 mm mesh destroyed the structure of soil organic matter causing higher NO release rates than observed when sieving through 4, 8 and 16 mm meshes whose corresponding NO release rates were not significantly different from each other (see Fig. 1).
For measurements of net NO release rates approximately 0.1 kg soil was placed
10
into a Plexiglas cuvette, wetted with deionised water to a gravimetric water content>3 (using a spray can) and pre-incubated for 3 h in a thermo-regulated cabinet to adapt to the soil temperature used during the corresponding NO release experiments.
2.3 Soil physical and chemical characterization
In addition to samples for use in flux measurements, we took organic layer samples
15
from each understory patch for the determination of soil pH, C/N ratio, organic C (Corg),
soil nitrate (NO−3), soil ammonium (NH+4), bulk density (BD) and particle density (PD). For the determination of soil pH the organic matter was homogenized and afterwards measured in a soil-to-water suspension (1:2.5) using a glass electrode (SenTix®, WTW, Germany). The C/N ratio was measured with an elementary analyzer (Flash
20
EA 1112, Thermoquest, Germany). Corgwas determined by the mean difference of 5 g
(air dried) of the soil sample and 5 g dried at 430◦C in a muffle furnace (until constant
weight was achieved). The ammonium and nitrate concentrations in extracts of the soil samples were measured by spectrometry (FIA-lab, MLE, Germany). For determination of the soil bulk density, undisturbed soil samples were taken using a spade and
after-25
BGD
7, 203–250, 2010Laboratory measurements of nitric oxide release
from forest soil
A. Bargsten et al.
Title Page
Abstract Introduction
Conclusions References
Tables Figures
◭ ◮
◭ ◮
Back Close
Full Screen / Esc
Printer-friendly Version
Interactive Discussion
density of the soil sample was determined by a heliumpycnometer (AccuPyc II 1340, Micromeritics, USA) after sieving soil samples through a 2 mm mesh.
2.4 Laboratory setup
Net NO release rates from soil samples were determined using an automated labora-tory system. A detailed description of our experimental setup is given in van Dijk and
5
Meixner (2001); here we give only a short description of the most recent state of the setup (see Fig. 2).
Pressurized air is passed through a pure air generator (PAG 003, ECOPHYSICS, Switzerland) to provide dry and NO-free air. This NO-free air supplied five Plexiglas cuvettes (four incubation cuvettes and one empty reference cuvette). The volume of
10
each cuvette was 9.7×10⁻⁴m3 (0.97 l) and each was flushed with a continuous flow
of 4.2×10⁻⁵m3s−1 (2.5 l min−1) of dry NO-free air, as controlled by five mass flow
controllers (MFC, Mass-Flo®, 5000 sccm range, MKS instruments, USA), one for each cuvette. The headspace volume of each cuvette is well mixed by a teflonized micro-fan (Micronel®, USA). The outlet of each cuvette was connected to a switching valve.
15
Every two minutes one cuvette was switched to be the “active” cuvette (i.e., connected to the analyzers, while the remaining four cuvettes were still purged), so that all five cuvettes were measured within 10 min. The valves provided necessary sample air to a chemiluminescence detector, NO-analyser (Model 42i Trace Level, Thermo Electron Corporation, USA; detection limit: 250 ppt (3σ)) and a CO2-/H2O-analyzer (Li-cor 840, 20
Licor, USA). Instead of ambient air we operated the NO-analyser with pure oxygen (O2) to obtain a better accuracy and precision of the NO mixing ratio measurements, particularly at low mixing ratios.
The NO-analyser was calibrated using a gas phase titration unit (GPT, 146 C Dy-namic Gas Calibrator, Thermo Electron Corporation, USA). For operating the GPT we
25
BGD
7, 203–250, 2010Laboratory measurements of nitric oxide release
from forest soil
A. Bargsten et al.
Title Page
Abstract Introduction
Conclusions References
Tables Figures
◭ ◮
◭ ◮
Back Close
Full Screen / Esc
Printer-friendly Version
Interactive Discussion
requires the fumigation of incubated soil samples with enhanced NO mixing ratios (re-sulting in reduced or even negative net NO release rates, i.e. NO uptake by the soil). Hence, NO standard gas (200 ppm NO, Air Liquide, Germany) was diluted into the air flow from the PAG 003 via a mass flow controller (Flow EL, Bronkhorst, Germany).
All connections and tubes consisted of PTFE. A homebuilt control unit (V25) was
5
controlling the entire laboratory system and, in combination with a PC, was also used for data acquisition (see Fig. 2).
To determine the temperature response of the net NO release we performed a total of four experiments, each on another sub-sample of the original understory soil sample. The sub-samples were identically pre-treated. Incubations were at 10◦C and 20◦C,
10
corresponding fumigation was either with dry, NO-free air, or with air containing 133 ppb of NO. Since every experiment begins with a wetted soil sample and the fumigation air is completely dry, the gravimetric water content (θ) of the samples declines during each experiment as evaporating water leaves the cuvette with the fumigation air flow. Soil samples are completely dry within 4 to 7 days. This procedure provides us the
15
response of the net NO release rates over the entire range of gravimetric soil moisture (>4 to 0).
The NO release rate is a product of NO consumption and NO production, because both processes occur simultaneously in the topsoil (Rudolph and Conrad, 1996; Con-rad, 1994). Consequently, the observed NO release rate,J (see Eq. 1), is always a net
20
release rate. If NO consumption overrides the NO production in the soil sample, then
J becomes negative. However, this only occurs if the the NO mixing ratio in the ref-erence cuvette, mNO,ref, exceeds the NO mixing ratio in the headspace of a sample
cuvette (which is equal to the corresponding outlet NO mixing ratio, mNO,out, due to
well-mixed conditions within each sample cuvette).
25
2.5 Calculation and fitting the net NO release rate
BGD
7, 203–250, 2010Laboratory measurements of nitric oxide release
from forest soil
A. Bargsten et al.
Title Page
Abstract Introduction
Conclusions References
Tables Figures
◭ ◮
◭ ◮
Back Close
Full Screen / Esc
Printer-friendly Version
Interactive Discussion
mass of (dry) soil (kg) and time (s)) as a function of the gravimetric soil moisture (θ) of the soil samples.J(θ) was calculated from the NO mixing ratio difference between the
reference cuvette (mNO,ref, in ppb) and the soil incubation cuvettes (mNO,out, in ppb):
J(θ)= Q
Msoil
(mNO,out−mNO,ref)× MN
Vm
×10−3 (1)
whereQis the flow through the cuvette (m3s−1),Msoilis the dry mass of the soil sample 5
(kg),MN/Vm×10− 3
is the conversion factor (ppb to ng m−3), whereMNis the molecular
weight of nitrogen (14.0076 kg kmol−1) andV
mis the molar volume (m 3
kmol−1) at actual temperature and standard pressure (1013.25 hPa).
Individual data of measured net NO release rates were fitted with a 3 parameter function (Eq. 2) modified from that given by Meixner and Yang (2006) in order to yield
10
two of the three parameters as measured quantities (θopt,Jopt):
J(θ)=Jopt× θ
θopt
!b
×exp b 1− θ θopt
!!
(2)
whereθopt is the gravimetric water content where the optimum net NO release rate
(Jopt) is observed, and b characterizes the width of the fitting curve. The gnuplot®
software (www.gnuplot.info, see copyright information) was used for fitting.
15
It has been frequently shown, that there is a linear relationship between the net NO release rate (J) and the headspace NO mixing ratio (mNO,out) (Remde et al., 1989; van
Dijk and Meixner, 2001; van Dijk et al., 2002; Ludwig et al., 2001):
J=P−K=P−k×mNO,out×MN
Vm
×10−3 (3)
Equation (3) implies that the NO production rate P (ng kg−1s−1) is independent of
20
the cuvette’s headspace NO mixing ratio (mNO,out), whereas the first-order NO
con-sumption rate,K (ng kg−1
s−1
BGD
7, 203–250, 2010Laboratory measurements of nitric oxide release
from forest soil
A. Bargsten et al.
Title Page
Abstract Introduction
Conclusions References
Tables Figures
◭ ◮
◭ ◮
Back Close
Full Screen / Esc
Printer-friendly Version
Interactive Discussion
(m3kg−1s−1) is determined from the slope of Eq. (3). To obtail this slope, we used two incubation data sets: namely atmNO,ref=0 ppb andmNO,ref=133 ppb,
k(θ)= ∆JNO ∆[NO]=
J(mNO,out,high)−J(mNO,out,low) mNO,out,high−mNO,out,low ×
Vm MN
×10−3 (4)
wheremNO,out,low is the actual NO mixing ratio (ppb) in the headspace of the cuvette
under fumigation with NO free air andmNO,out,high is the actual NO mixing ratio in the 5
cuvette under fumigation with 133 ppb NO. Having determined k, the NO production rate P was calculated from Eq. (3) and corresponding NO net release rates J from Eq. (1).
Finally, Eq. (3) is extended to describe the net NO release rate, for each soil sample, as a function of the main influencing variables, headspace NO mixing ratio (mNO,out), 10
gravimetric water content (θ) and soil temperature (Tsoil). For the temperature
depen-dence we used theQ10 values (see Sect. 2.6), as a “temperature amplification factor”
(Feig et al., 2008):
J(mNO,out,θ,Tsoil)=P(θ,Tsoil)−k(θ,Tsoil)×mNO,out× MN
Vm
×10−3 (5)
2.6 Calculation of theQ10 value
15
The temperature dependence of the net potential NO flux was determined by using net NO release rates obtained for two soil temperatures, namely those at 10◦C and 20◦C. The temperature dependence usually shows an exponential increase and can be expressed by the ratio of two net potential NO fluxes, at soil temperatures 10◦C apart. TheQ10 values used for this study were calculated from the net potential NO 20
fluxes at optimum gravimetric soil moisture (θopt):
Q10=
FNO(θopt,Tsoil=20◦C) FNO(θopt,Tsoil=10◦C)
BGD
7, 203–250, 2010Laboratory measurements of nitric oxide release
from forest soil
A. Bargsten et al.
Title Page
Abstract Introduction
Conclusions References
Tables Figures
◭ ◮
◭ ◮
Back Close
Full Screen / Esc
Printer-friendly Version
Interactive Discussion
2.7 NO compensation point mixing ratio
The existence of a NO compensation point mixing ratio (mNO,comp) has been clearly
demonstrated (Remde et al., 1989; van Dijk and Meixner, 2001; Conrad, 1994; Gelfand et al., 2009; Feig et al., 2008; Otter et al., 1999; Johansson and Granat, 1984). Consid-ering Eq. (5)mNO,comp is the mixing ratio (mNO,out) at which the rate of NO production 5
P equals the rate of NO consumption K, so that the net NO release rate between soil and the headspace is zero (J=0). Hence, from Eq. (7)mNO,comp is calculated in terms
of gravimetric soil water content and soil temperature.
mNO,comp(θ,Tsoil)=
P(θ,Tsoil) k(θ,Tsoil)
×Vm MN
×10−3 (7)
2.8 Net potential NO flux
10
To relate the net NO release rate, which is expressed in ng NO per mass of soil and time, to the net potential NO flux, which is expressed in ng NO per soil area and time, we used the following equation, originally presented by Galbally and Johansson (1989), which has been used in modified forms already by Otter et al. (1999), van Dijk and Meixner (2001), Feig et al. (2008), Gelfand (2009), Yu et al. (2008).
15
FNO(θ,Tsoil)=
q
Dp(θ)×BD×k(θ,Tsoil)×
P(θ,T
soil) k(θ,Tsoil)
−mNO,out× MN
Vm
×10−3
(8)
FNO is the desired net potential NO flux (ng m− 2
s−1), BD is the bulk density of soil (kg m−3), Dp is the effective diffusion coefficient of NO in soil (in m2s−1) according to
Millington and Quirk (1960) (see Sect. 2.9).
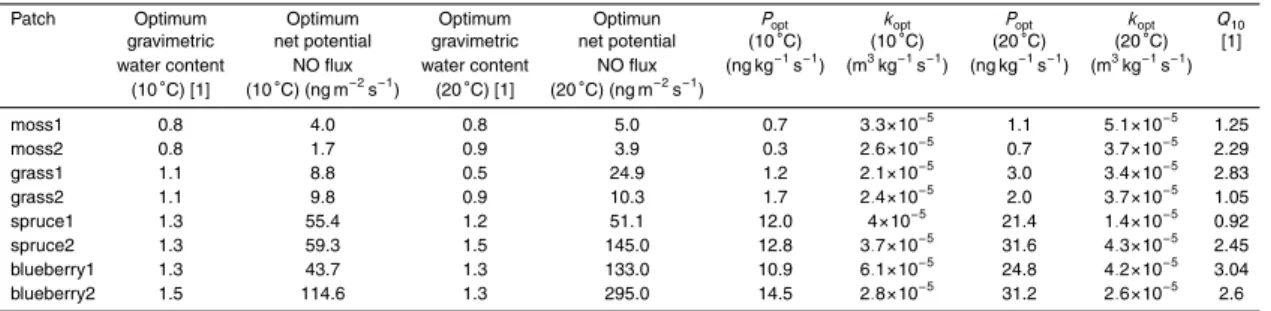
2.9 Effective diffusion of NO in soil air
20
The effective gas diffusion coefficient of NO in soil air is an important parameter for
(Boll-BGD
7, 203–250, 2010Laboratory measurements of nitric oxide release
from forest soil
A. Bargsten et al.
Title Page
Abstract Introduction
Conclusions References
Tables Figures
◭ ◮
◭ ◮
Back Close
Full Screen / Esc
Printer-friendly Version
Interactive Discussion
mann and Conrad, 1998). Since we do not have measurements of the effective soil
diffusion coefficient (Dp) at the Weidenbrunnen site, we estimated the diffusion
coef-ficient through available functional relationships. The choice of the proper diffusivity
coefficient function is not trivial, particularly for organic soils (Kapiluto et al., 2007).
Therefore, we tested different functions namely those of Moldrup et al. (2000),
Milling-5
ton (1959) and Millington and Quirk (1960) which are given in Table 1. In these func-tions the following measured variables were used:
– soil total porosity (Φ), calculated from the soil bulk density (BD) and the particle
density (PD) of the soil sample; both parameters measured directly on the soil samples:
10
Φ =1−BD
PD (9)
– soil air filled porosity (ǫ) calculated from the soil bulk density, the density of water (WD), and the the soil total porosity (Φ):
ǫ=1−θBD
WD× 1
Φ (10)
We calculated net potential NO fluxes (see Sect. 2.6) using the three different effective
15
NO diffusion coefficients. One example for a soil sample from a grass covered patch is
shown in Fig. 3. Net potential fluxes exhibit different maxima with a shifting value for the
optimum water content for NO production due to the different exponents forǫ.
Accord-ing to P. Moldrup (personal communication, 2009), the MillAccord-ington and Quirk approach describes the effective gas diffusion coefficient best for soil organic matter; therefore
20
BGD
7, 203–250, 2010Laboratory measurements of nitric oxide release
from forest soil
A. Bargsten et al.
Title Page
Abstract Introduction
Conclusions References
Tables Figures
◭ ◮
◭ ◮
Back Close
Full Screen / Esc
Printer-friendly Version
Interactive Discussion
2.10 Error estimation of NO release measurements
The errors in the net NO release rate were determined using the individual errors of all quantities on the right hand site of Eq. (1). We specified these errors as followed:
– The error in the soil weight (Msoil) measurements was set to the accuracy of the
balance (PG-S Delta Range®, Mettler-Toledo, Switzerland) provided by the
man-5
ufacturer: 0.001 kg (for a mass<1.0 kg).
– The error of the mass flow rate through the cuvette (Q) was found as 1.68×10⁻⁸m3s−1 (i.e. the standard deviation of all individual mean flux rates of
a corresponding experiment withn=798).
– The error of the mixing ratio in the headspace of a soil cuvette (mNO,out) was 10
determined by using every NO mixing ratio measurement: formNO,ref=0 ppb the
error was<0.1 ppb, formNO,ref=133 ppb the error was<0.6 ppb.
– The error of the reference cuvette (mNO,ref) was determined in the same way,
resulting in an error of<0.1 ppb (mNO,ref=0 ppb), and<0.4 ppb (mNO,ref=133 ppb).
Application of Gaussian error propagation to Eq. (1) resulted in an error in the optimum
15
net NO release rate (Jopt) of less than 8%.
The detection limit for the net NO release rate obtained by our laboratory system was determined by Feig et al. (2008) and Gelfand et al. (2009) using inert glass beads and autoclaved soils. The “blank” net NO release rate from the inert glass beads was 0.02 ng kg−1s−1 with a random deviation of 0.02 ng kg−1s−1and for autoclaved soils it
20
was 0.05 ng kg−1s−1with a random deviation of 0.02 ng kg−1s−1. Feig et al. (2008) de-fined the detection limit of the net NO release rate as 0.08 ng kg−1s−1(i.e. mean net NO release rate of glass beads plus three times its standard deviation). The detection limit of the autoclaved soils was calculated the same way and resulted in a detection limit of 0.11 ng kg−1s−1. Therefore, the more conservative estimate from the autoclaved soils
BGD
7, 203–250, 2010Laboratory measurements of nitric oxide release
from forest soil
A. Bargsten et al.
Title Page
Abstract Introduction
Conclusions References
Tables Figures
◭ ◮
◭ ◮
Back Close
Full Screen / Esc
Printer-friendly Version
Interactive Discussion
was used as the detection limit of net NO release rates determined by our laboratory system.
In Fig. 4a and b, we present the net NO release rate calculated from the difference in
the data points of NO mixing ratio (see Eq. 1) and the corresponding fit (see Eq. 2) for a soil samples under moss. Figure 4 also shows the individual errors ofJ(by Gaussian
5
error propagation; grey whiskers) and the detection limit ofJ (grey shadow band). For the fit of the data according to Eq. (2), prediction bands (PB) were calculated at a confidence level of 95% using the procedure given by Olive (2007) (Eq. 2.6 in the work by Olive). The prediction bands show for a prescribed probability, the values of one or more hypothetical observations that could be drawn from the same population
10
from which the given data was sampled.
3 Results
3.1 Net NO release rates
Figure 5a–d present net NO release rates obtained from soils under moss, grass, spruce and blueberry cover at two temperatures (upper panels: 10◦C, and lower
15
panels: 20◦C) and two NO mixing ratios (left panels: mNO,ref=0 ppb and right
pan-els: mNO,ref=133 ppb). The curves are the result of corresponding fitting (Eq. 2) to
measured data as described in Sect. 2.5. At incubation with NO free air higher net NO release rates occurred from soils under spruce and blueberry cover than under moss and grass cover. Maximum NO release rates at Tsoil=10◦C and 20◦C were 20
12.4 and 23.6 ng kg−1s−1for spruce1, 13.2 and 32.0 ng kg−1s−1for spruce2, 11.4 and 25.5 ng kg−1s−1 for blueberry1, and 14.6 and 33.6 ng kg−1s−1 for blueberry2. Simi-larly, when incubated with 133 ppb NO, patches covered with spruce (spruce1: 9.3 and 14.4 ng kg−1s−1, spruce2: 10.4 and 30.8 ng kg−1s−1) and blueberry (blueberry1: 6.8 and 23.6 ng kg−1s−1, blueberry2: 13.6 and 30.2 ng kg−1s−1) showed the highest net
25
BGD
7, 203–250, 2010Laboratory measurements of nitric oxide release
from forest soil
A. Bargsten et al.
Title Page
Abstract Introduction
Conclusions References
Tables Figures
◭ ◮
◭ ◮
Back Close
Full Screen / Esc
Printer-friendly Version
Interactive Discussion
NO release rates when fumigated with NO free air (Fig. 5a and c). When fumigated with air containing 133 ppb NO, negative net NO release rates occurred for soils from both moss covered patches and one grass covered patch (grass2). In these cases the fumigation NO mixing ratio of 133 ppb was obviously higher than the NO compensation mixing ratio (mNO,comp) of the corresponding soil samples (see Sect. 2.7), and the NO 5
consumption rate (K) has exceeded the NO production rate (P) in these soil samples. Net NO release rates reached their maxima between 0.64 (grass1) and 2.41 (blue-berry2) gravimetric water content. The soil moisture, where the optimum net NO re-lease rate is observed, is called the optimum soil moisture (θopt in Eq. 3). Generally,
highest values ofθoptwere observed for soils under spruce and blueberry cover.
10
At gravimetric soil moisture of 4 the net NO release rates do not become zero. That is due to the fact that the samples were not waterlogged at gravimetric soil moisture of 4. Therefore, nitrifiers and denitrifiers might be still supplied with oxygen.
However, the curves differ for optimum soil moistures and higher than these. The
net NO release rates from soils under spruce cover were not significantly different from
15
each other using either fumigation atTsoil=10◦C, but significantly differ at Tsoil=20◦C.
No significant differences could be observed between the two moss samples, or the
two grass samples. Net NO release rate of soils under blueberry cover were similar only in a range between 0 and 1.4 gravimetric water content and only in the treatment with NO free air and atTsoil=10◦C.
20
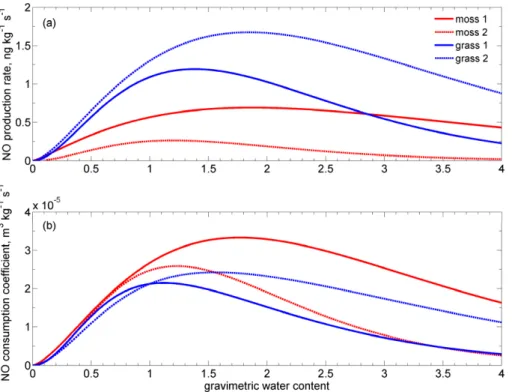
3.2 NO production rates, NO consumption coefficients, and NO compensation
point mixing ratios
Exemplary results of NO production rate and NO consumption coefficient as a
func-tion of gravimetric soil water content for Tsoil=10◦C are shown in Fig. 6a and b (soil
samples under moss and grass cover). The NO production rate P (also expressed
25
in ng kg−1s−1) is nearly as high as the net NO release rate at mNO,ref=0 ppb. The
BGD
7, 203–250, 2010Laboratory measurements of nitric oxide release
from forest soil
A. Bargsten et al.
Title Page
Abstract Introduction
Conclusions References
Tables Figures
◭ ◮
◭ ◮
Back Close
Full Screen / Esc
Printer-friendly Version
Interactive Discussion
production rate has been explained by substrate limitation under very dry conditions, and O2-diffusion limitation under very wet conditions (Davidson et al., 1993; Meixner,
1994; Rudolph and Conrad, 1996; Meixner and Yang, 2006; Skopp et al., 1990). The lowest optimum NO production rates were found at Tsoil=10◦C for soils under moss
cover with 0.7 and 0.3 ng kg−1s−1. Grass covered soils revealed optima of 1.2 and
5
1.7 ng kg−1s−1. Soils under spruce cover yield optimum NO production rates of 12.0 and 12.8 ng kg−1s−1, and blueberry covered soils 10.9 and 14.5 ng kg−1s−1 (see Ta-ble 2). The NO production rate at 20◦C showed generally higher values at optimum soil moisture. The optimum NO production rate under moss covered soils atTsoil=20◦C
were 1.1 and 0.7 ng kg−1s−1, under soils with grass cover 3.0 and 2.0 ng kg−1s−1,
10
21.4 and 31.6 ng kg−1s−1for spruce covered soils, and for blueberry patches 24.8 and 31.2 ng kg−1s−1(see Table 2).
The NO consumption coefficient (k, see Eq. 4) is expressed in m3kg−1s−1. For
our samples, we measured maximum NO consumption coefficients for soils
un-der moss cover of 3×10⁻⁵m3kg−1s−1, for grass covered soils 2×10⁻⁵m3kg−1s−1 15
for both, 4×10⁻⁵m3kg−1s−1 for both samples with spruce cover and 6×10⁻⁵ and
3×10⁻⁵m3kg−1s−1 for soils under blueberry cover (all values for Tsoil=10◦C, see
Ta-ble 3 for NO consumption atTsoil=20◦C).
Figure 7 presents mean NO compensation point mixing ratios (mNO,comp) for soils
covered with moss, grass, spruce and blueberry at gravimetric soil moisture of 1±0.1 20
which is at the upper end of gravimetric soil moistures observed at the sample site (Behrendt, 2009). The mNO,comp varies over a wide range. Moss and grass covered
soils showed smallmNO,comp (38 ppb and 94 ppb) compared to spruce and blueberry covered soils which exhibited considerable highermNO,comp (518 ppb and 389 ppb).
3.3 Net potential NO fluxes
25
BGD
7, 203–250, 2010Laboratory measurements of nitric oxide release
from forest soil
A. Bargsten et al.
Title Page
Abstract Introduction
Conclusions References
Tables Figures
◭ ◮
◭ ◮
Back Close
Full Screen / Esc
Printer-friendly Version
Interactive Discussion
net potential NO fluxes from spruce and blueberry covered soils were approximately 10-fold higher than net potential NO fluxes from moss and grass covered soils (note different scales of y-axes in Fig. 8). The optimum NO fluxes atTsoil=10◦C ranged
be-tween 1.7 ng m−2s−1 (moss2) and 114.6 ng m−2s−1 (blueberry2). The position of the optimum gravimetric water content varied between the different curves. The optimum
5
gravimetric water content forTsoil=10◦C was 0.8 for moss, 1.1 for grass, 1.3 for spruce
and 1.3 and 1.5 gravimetric soil moisture for blueberry1 and blueberry2 (also see Ta-ble 2). For fumigation atTsoil=20◦C, optimum net potential NO fluxes were, except for
spruce1, always higher at the higher incubation temperature. They ranged between 3.9 ng m−2s−1(moss2) and 295 ng m−2s−1(blueberry2) (see Table 2). Optimum
gravi-10
metric water content for Tsoil=20◦C were 0.8 and 0.9 for moss1 and moss2, 0.5 and
0.8 for grass1 and grass2, 1.2 and 1.5 for spruce1 and spruce2, and 1.3 for blueberry covered patches.
3.4 Temperature dependence (Q10values)
Optimum net potential NO fluxes measured at two different soil temperatures (10◦C
15
and 20◦C) allowed us to estimateQ10values for each soil sample of the
Weidenbrun-nen site and data are given in Table 2. For the soil from the spruce1 patch we derived the lowestQ10 value (0.92). The soil from the blueberry1 patch showed the highest Q10value of 3.04.
3.5 Chemical and physical soil parameters
20
The results of analysis of different soil parameters including bulk density (BD), particle
density (PD), soil pH, C/N ratio, organic carbon (Corg), soil ammonia (NH
+
4) and soil
nitrate (NO−
3) are summarized in Table 3. Soil bulk density ranged between 0.12 and
0.18×10³kg m−3, while PD ranged between 1.5 and 1.7×10³kg m−3. Soil pH was
lowest (3.5) in spruce covered soil and highest (5.0) for the moss covered soil. C/N
25
BGD
7, 203–250, 2010Laboratory measurements of nitric oxide release
from forest soil
A. Bargsten et al.
Title Page
Abstract Introduction
Conclusions References
Tables Figures
◭ ◮
◭ ◮
Back Close
Full Screen / Esc
Printer-friendly Version
Interactive Discussion
(16.2) close to the range reported in literature for other Norway spruce sites in the Fichtelgebirge (see Schmitt et al., 2008; Michel et al., 2006). C/N ratios varied only in a small range, namely between 14.7 and 18.4. For Corg the values ranged between
26.9% (moss2) and 43.5% (spruce1). A higher variability has been found for soil NH+4. Lowest soil NH+4 values were found for spruce covered soils (spruce1: 72 mg kg−1,
5
spruce2: 111 mg kg−1) and the highest soil NH+4 values were found for grass covered patches (grass1: 266 mg kg−1, grass2: 263 mg kg−1). Soil NO−
3 ranged between 5 and
50 mg kg−1.
Pearson’s product-moment-analyses were performed to test (a) net potential NO fluxes (atTsoil=10◦C, Tsoil=20◦C), (b) NO production rates (atTsoil=10◦C,Tsoil=20◦C) 10
and (c) NO consumption coefficients (at Tsoil=10◦C, T
soil=20◦C) for possible
relation-ship with the physical and chemical soil parameters (soil pH, Corg, C/N ratio, soil NH
+
4,
soil NO−3 and PD).
The results obtained from Pearson’s product-moment-analyses are presented in Ta-ble 4. Significant negative correlations (probability level of 0.1) were found only
be-15
tween soil NH+4 and NO production rate atTsoil=10◦C, NO production rate atTsoil=20◦C,
and NO consumption coefficient. The following correlations were not significant at
a probability level of 0.1. Soil pH correlated negatively with all independent variables except for the consumption coefficient atTsoil=10◦C. Positive correlations with the
in-dividual variables were found for soil Corg and also for C/N. Soil NO−3 vs. independent 20
variables showed positive correlations except for the NO consumption coefficient.
BGD
7, 203–250, 2010Laboratory measurements of nitric oxide release
from forest soil
A. Bargsten et al.
Title Page
Abstract Introduction
Conclusions References
Tables Figures
◭ ◮
◭ ◮
Back Close
Full Screen / Esc
Printer-friendly Version
Interactive Discussion
4 Discussion
4.1 Comparison with other studies
During the last two decades, there has been a series of studies on biogenic NO emis-sions from soil in forest ecosystems (Papke and Papen, 1998; Pilegaard et al., 2006; Kesik et al., 2005; Johansson, 1984; Pilegaard et al., 1999; Butterbach-Bahl et al.,
5
2001, 2002; Lehmann, 2002). However, there are only a few studies examining spatial differences of NO fluxes within a forest (Gasche and Papen, 1999; Lehmann, 2002;
Pilegaard et al., 1999; Nishina et al., 2009), not to mention the influence of different
understory types. Furthermore, the influence of soil organic matter on soil biogenic NO emissions has not been studied in detail and is consequently not well known. In
10
most studies the effect of the dominant overstory or of the whole soil core (mineral and
organic layer) was addressed by measurements using the dynamic chamber technique (Gasche and Papen, 1999; Butterbach-Bahl et al., 1997; Johansson, 1984).
During the last two decades, a series of field and laboratory studies clearly demon-strated, that NO fluxes, measured in the field by dynamic chamber techniques, were
15
in good agreement with those NO fluxes, which have been derived from laboratory in-cubations on soils sampled from the top soil layer of dynamic chambers’ enclosures (Meixner et al., 1997; van Dijk et al., 2002; Remde et al., 1993; Ludwig et al., 2001; Meixner and Yang, 2006; Otter et al., 1999). However, for more detailed investigations, laboratory studies are necessary, but only a few groups seem to have the facilities
20
available to carry out laboratory measurements of soil NO exchange (e.g., Bollmann et al., 1999; Ormeci et al., 1999; Schindlbacher et al., 2004; Feig et al., 2008; van Dijk and Meixner, 2001). Since laboratory studies are outnumbered, most of the following discussion is based on results from field measurements in spruce forests.
Pilegaard et al. (1999), applying a dynamic field chamber technique in a spruce
for-25
BGD
7, 203–250, 2010Laboratory measurements of nitric oxide release
from forest soil
A. Bargsten et al.
Title Page
Abstract Introduction
Conclusions References
Tables Figures
◭ ◮
◭ ◮
Back Close
Full Screen / Esc
Printer-friendly Version
Interactive Discussion
Similar results were presented by Gasche and Papen (2002) for the H ¨oglwald forest (Germany). Their measurements, also employing a dynamic chamber technique, ad-dressed the spatial distribution of NO fluxes along a tree-to-tree gradient. For 1997, annual mean NO fluxes of 29.2±0.9 ng m−2s−1were found for those chambers which
were located closest to the stems, 18.4±0.5 ng m−2s−1 for chambers approximately 5
4 m, and 12.3±0.4 ng m−2s−1for the chamber approximately 6 m apart from the stems.
With closeness to trunks (living trees) the NO emissions increased significantly (be-tween 1.6- and 2.6-fold). While for the H ¨oglwald beech forest site, Gasche and Papen (2002) could explain an identical spatial effect with marked differences in soil
physi-cal and chemiphysi-cal soil parameters, there was no detailed explanation for the H ¨oglwald
10
spruce forest site. One reason could be that the nutrient supply from stem flow is negligible at this spruce forest site (Gasche and Papen, 2002). Butterbach-Bahl et al. (1997) reported mean monthly NO fluxes between 5.6 and 36.1 ng m−2s−1 for the same H ¨oglwald spruce forest site (July 1994 to June 1995). The site exhibits acidic soil pH values (2.7 to 3.6) in the organic layer. Again for the H ¨oglwald spruce site, Gasche
15
and Papen (1999) showed, that most of the NO emissions came from the organic layer and only a small contribution from the mineral soil. For the entire H ¨oglwald site, they reported annual NO emission rates of 25.5±0.5 ng m−2s−1 during 1994–1996. Very
low NO fluxes (0.3±0.1 ng m−2s−1) were reported by Horv ´ath et al. (2006) for a spruce
forest site in NE Hungary (October 2002 to September 2003). Similar low NO fluxes
20
were reported by Kitzler et al. (2006) for the spruce-fir-beech forest site of Achental (Austria) during the period of May 2002 to July 2004. Using a dynamic chamber tech-nique, they found mean NO fluxes of only 0.2±0.02 ng m−2s−1 for the first year and
mean NO fluxes of 0.14±0.01 ng m−2s−1for the second year. However, the pH values
at this site are very high (6.42).
25
BGD
7, 203–250, 2010Laboratory measurements of nitric oxide release
from forest soil
A. Bargsten et al.
Title Page
Abstract Introduction
Conclusions References
Tables Figures
◭ ◮
◭ ◮
Back Close
Full Screen / Esc
Printer-friendly Version
Interactive Discussion
were carried out at the Nagoya University Forest (Japan) site covered with Japanese cedar. The NO emissions ranged from 0.3 ng m−2
s−1
at high soil water contents (<92% WFPS) to 72.2 ng m−2s−1 at low soil water contents (>29% WFPS) (Nishina et al., 2009).
Our optimum net potential NO fluxes for soil under grass cover (8.8–9.8 ng m−2
s−1
,
5
Tsoil=10◦C, see Table 2) agree well with the (laboratory) results of Muhr et al. (2008).
Also the results of Nishina et al. (2009) are in the range of our optimum net potential NO fluxes. However, their soil samples were taken from the mineral soil. Our results for grass covered soils also overlap with the data given by Butterbach-Bahl et al. (1997) and Gasche and Papen (2002). Annual NO emission rates measured by Gasche and
10
Papen (1999) range between our optimum net potential NO fluxes for grass and spruce covered soils (and also for the blueberry1 patch). Contrastingly, the NO fluxes found by Kitzler et al. (2006) and Horv ´ath et al. (2006) are much lower than any of our op-timum net potential NO fluxes. However, the Achental site is a mixed forest, and the soil exhibits a relatively high pH value (6.42). Relatively high values of the soil water
15
content (average: 53% water filled pore space (WFPS)) characterized the soils of the Hungarian site (see Horv ´ath et al., 2006). In contrast, the optimum soil water contents found in our study ranged between 18 and 27% WFPS (see equivalent gravimetric wa-ter contents in Table 2). Optimum net potential NO fluxes of our moss covered soils (if watered to 53% WFPS) would fall in the range of field fluxes observed by Horv ´ath et
20
al. (2006). In any case, our optimum net potential NO fluxes from soils under spruce and blueberries show higher values than any fluxes of the other studies mentioned above.
Net potential NO fluxes derived from laboratory experiments using the algorithm of Galbally and Johansson (1989) are particularly sensitive to changes in NO production
25
rates and NO consumption coefficients and less sensitive to changes in diffusivity and
equa-BGD
7, 203–250, 2010Laboratory measurements of nitric oxide release
from forest soil
A. Bargsten et al.
Title Page
Abstract Introduction
Conclusions References
Tables Figures
◭ ◮
◭ ◮
Back Close
Full Screen / Esc
Printer-friendly Version
Interactive Discussion
tions are basically applicable only to mineral soils. As gas diffusion in the organic layer
can be substantially different, and uncertainties in determining diffusion coefficients in
organic layers are still a matter of discussion (P. Moldrup, personal communication, 2009), we employed different mathematical formulations (see Table 1), and found that
the choice of the diffusion coefficient equation had an effect on the calculated NO flux
5
(see Fig. 3). Depending on the diffusion coefficient, the NO fluxes had different
mag-nitudes (factor of maximum 1.26 over the entire soil moisture range) and exhibited a shift in the position of the optimum flux (see Fig. 3). However, even using the cor-rect effective diffusion coefficient, attention should be paid to its determination as the
equation includes both the bulk and particle density. Both densities are varying
sig-10
nificantly between organic and mineral soil layers (e.g., Weidenbrunnen site: organic soil layers: BD: 0.14±0.02, PD: 1.6±0.07, n=8, mineral soil layers: BD: 0.88±0.18,
PD: 2.47±0.06, n=8). If the effective diffusion coefficient has to be calculated, it is
necessary to measure these quantities directly. Nevertheless, to reveal the uncertain-ties in diffusion through organic soil layers, further research, especially through field
15
measurements of the diffusion coefficient, are most desirable.
Comparisons of NO production rates are not affected by the choice of diffusion
co-efficients. Therefor, only a few NO production rates are reported in the literature.
Venterea and Rolston (2000) found mean NO production rates in a range of 9.4 to 18.7 ng kg−1s−1 for agricultural soils from the Sacramento Valley of California. These
20
values are comparable with our results of NO production rates (0.3–14.5 ng kg−1s−1). Remde et al. (1989) reported NO production rates twice as high as ours for a sandy clay loam under aerobic conditions (27.4±1.8 ng kg−1s−1), yet much higher under
anaero-bic conditions (738±21.6 ng kg−1s−1).
NO production rates reported in the literature are as rare as NO consumption
co-25
efficients. Values of the NO consumption coefficient (k) found in this study were in
the range of 2×10⁻⁵ to 6×10⁻⁵m3s−1kg−1. Soils from the Bolivian Amazon region
showed k values under oxic conditions of 8×10⁻⁵m3s−1kg−1 (Koschorreck and
BGD
7, 203–250, 2010Laboratory measurements of nitric oxide release
from forest soil
A. Bargsten et al.
Title Page
Abstract Introduction
Conclusions References
Tables Figures
◭ ◮
◭ ◮
Back Close
Full Screen / Esc
Printer-friendly Version
Interactive Discussion
and 26×10−5m3s−1kg−1. However, these values were determined for desert soil with
nearly no organic material inside at 25◦C in the laboratory, 15◦C more than for our studies. As biological processes usually increase by a factor of two with an increase in temperature of 10◦C (Kirschbaum, 1995; Davidson et al., 2006; Zheng et al., 2003), the higher values reported by Feig et al. (2008) are to be expected.
5
Only a few studies reported compensation point mixing ratios. Slemr and Seiler (1991) determined NO compensation point mixing ratio for agricultural soils between 0.3 and 5.5 ppb. Gasche and Papen (1999) found NO compensation point mixing ratios of 69.9±9.6 ppb for a spruce forest soil in the H ¨oglwald, Germany. Only for the soils
un-der moss and grass cover we found NO compensation points in the low range of these
10
studies. Soils under spruce and blueberry cover showed a much higher mNO,comp.
However, there are also studies which found higher NO compensation mixing ratios, e.g. ranging between 9 and 875 ppb for agriculture, meadow and forest soils (G ¨odde and Conrad, 2000). In view of the ambient NO mixing ratios observed at the Weiden-brunnen site, NO compensation point mixing ratios found in our study demonstrate,
15
that the soils there mainly act as a biogenic source for NO. Only when the ambient NO mixing ratio matches or falls below the NO compensation point mixing ratio will the soils become a sink for biogenic NO. Moravek (2008) observed ambient NO mixing ratios between 1 and 2 ppb at 5 cm above the forest floor (moss covered) and Plake (2009) found NO mixing ratios up to 4.2 ppb at 0.5 cm above the forest floor (moss), both at
20
the Weidenbrunnen site. These mixing ratios are too low to change the NO flux from upward to downward directions.
Many studies have presented an exponential increase of soil NO emissions with increasing temperature. Generally, Q10 values are in the range of 2–3, a range valid
for most biochemical processes (Koponen et al., 2006; Kirkman et al., 2002; van Dijk
25
et al., 2002; Feig et al., 2008; Smith and Tiedje, 1979; Meixner and Yang, 2006). We obtainedQ10 values for net potential NO fluxes between 0.92 and 3.04 (see Table 3).
However, aQ10 value less than 1 (e.g. spruce1 patch: 0.92) indicates a decrease of
BGD
7, 203–250, 2010Laboratory measurements of nitric oxide release
from forest soil
A. Bargsten et al.
Title Page
Abstract Introduction
Conclusions References
Tables Figures
◭ ◮
◭ ◮
Back Close
Full Screen / Esc
Printer-friendly Version
Interactive Discussion
4.2 Influence of soil chemical parameters on net potential NO flux
The processes which result in NO exchange are mainly influenced by soil temperature and soil moisture (Davidson and Kingerlee, 1997; Johansson and Granat, 1984; Skiba et al., 1997; Ludwig et al., 2001; Feig et al., 2008; Meixner, 1994; Meixner and Yang, 2006). Nevertheless, soil chemical and physical parameters may also affect the NO
5
exchange (Nagele and Conrad, 1990; Smith et al., 2003; Ludwig et al., 2001; Pilegaard et al., 2006; Kitzler et al., 2006; Laville et al., 2009; G ¨odde and Conrad, 2000).
For our soil samples from the Weidenbrunnen site we found no very significant (prob-ability level of 0.05) relationships between optimum net potential NO fluxes, NO produc-tion rates, or NO consumpproduc-tion coefficients with any physical or chemical soil
parame-10
ters. However, on the 0.1 significance level we found negative correlations between soil NH+4 and (a) NO production rate (atTsoil=10◦C), (b) NO production rate (atTsoil=20◦C),
and (c) NO consumption coefficient (at Tsoil=20◦C) (see Table 4). Also the NO con-sumption coefficient atTsoil=10◦C and the net potential NO fluxes showed a negative,
but not significant correlation with soil NH+4. These negative correlations with soil NH+4
15
point to nitrification as the main converting process, because soil NH+4 must be avail-able before nitrification may start. Denitrification is the conversion of NO−3 to N2O or
N2, and NO−3 is necessary for the activation of denitrification. However, denitrification
seems to play a smaller role for soils from the Weidenbrunnen site because we found no significant correlation between soil NO−3 and other variables (see Table 4).
Further-20
more, nitrification may be lower at moss and grass covered patches than at spruce and blueberry covered patches. Therefore, the amount of soil NH+4 is higher at moss and grass patches than at spruce and blueberry patches. G ¨odde and Conrad (2000) also found, that nitrification is the dominant process of NO production in the soil. In contrast to our study, Baumg ¨artner and Conrad (1992) found no significant correlation between
25
the NO production rate and soil NH+4, but did find a significant correlation between the NO consumption coefficient and soil NH+4. However, they investigated mineral soil only.
BGD
7, 203–250, 2010Laboratory measurements of nitric oxide release
from forest soil
A. Bargsten et al.
Title Page
Abstract Introduction
Conclusions References
Tables Figures
◭ ◮
◭ ◮
Back Close
Full Screen / Esc
Printer-friendly Version
Interactive Discussion
Knowles, 1998), so that both processes can respond independantly to changes in ex-ternal factors. Gasche and Papen (1999) found a correlation between NO fluxes and soil NH+4 for the H ¨oglwald spruce forest site as well as a correlation between NO fluxes and soil NO−3. Typically, 1–4% (sometimes more) of soil NH+4 is released from soil as NO (Dunfield and Knowles, 1998).
5
The other parameters showed no significant correlations (<0.1). As the research site, a typical even-aged monoculture, is relatively small (1.4 ha), soil parameters vary only over a small range (see also Behrendt, 2009). This makes it difficult or
impos-sible to establish significant correlations between the other soil chemical or physical parameters and net potential NO fluxes.
10
Nevertheless, net potential NO fluxes showed a small relationship with soil pH val-ues. During laboratory incubation measurements, there might have been microsites in the soil samples with a soil pH different from the measured mean pH, indicating
that nitrification occurred in microsites having pH higher than the surrounding soil (Paavolainen and Smolander, 1998). That could also be a reason for the relatively
15
high NO emission despite of the low pH values. A pH value between 7 and 8 is ideal for nitrification. However, Paavolainen and Smolander (1998) reported conifer-ous soils that exhibited acid-tolerant nitrification. In this respect, a series of studies reported relationships between NO exchange processes and soil pH (G ¨odde and Con-rad, 2000; Venterea et al., 2004). Other studies found no strong relationships (Dunfield
20
and Knowles, 1998).
4.3 Influence of the understory type on net potential NO flux
A number of studies have detected effects of vegetation on NO emissions (Meixner
et al., 1997; Feig et al., 2008; Davidson, 1991; Martin and Asner, 2005; Pilegaard et al., 2006). This influence could be caused by changes in the soil nutrients due to the
25
presence of vegetation.
Net potential NO fluxes as well as NO production rates, NO consumption coefficients,
blueber-BGD
7, 203–250, 2010Laboratory measurements of nitric oxide release
from forest soil
A. Bargsten et al.
Title Page
Abstract Introduction
Conclusions References
Tables Figures
◭ ◮
◭ ◮
Back Close
Full Screen / Esc
Printer-friendly Version
Interactive Discussion
ries, and the lowest values are obtained for soils under moss and grass. There seems to be a strong relationship between understory type and the amount of net potential NO flux. As this relationship can hardly be explained by soil parameters, other factors must be responsible.
One substantial difference between the four understory types is, that spruce and
5
blueberries are both biologically higher plants with woody and larger roots in compari-son to moss and grass. The root system affects the physical, chemical and biological
properties of soil. Roots are vital sources of food and energy for microorganisms like nitrifiers and denitrifiers. Slemr and Seiler (1991) found, that the presence of roots may stimulate the NO emission rate. Also, St ¨ohr and Ullrich (2002), and St ¨ohr and
Strem-10
lau (2006) demonstrated that roots can generate NO. Vos et al. (1994) measured 2 to 12-fold higher NO emissions from plots covered with green manure than from fallow plots, probably caused by increased microbial activity in the rhizosphere of the green manure plots compared to the bare soil. Unfortunately, no field studies exist examin-ing the influence of plant roots on NO emissions. However, a few studies have shown
15
a strong influence on nitrous oxide emissions by roots (Mosier et al., 1990) and it is generally accepted that denitrification decreases with distance from plant roots (Smith and Tiedje, 1979). The size and the density of the nitrifier and denitrifier communities are also influenced by plant roots (Philippot et al., 2009).
Spruce and blueberries belong to those species, which can exhibit ectomycorrhiza.
20
Ectomycorrhiza live in symbiosis with most of the woody plants of the temperate zones. NO accumulation can occur during mycorrhizal symbioses (St ¨ohr and Stremlau, 2006). Wallenda et al. (2000) also demonstrated, that intact roots with mycorrizha of Norway spruce took up substantial amounts of NH+4. This NH+4 may act as precursor of nitrifi-cation. During nitrification NO can be released as an intermediate.
25
BGD
7, 203–250, 2010Laboratory measurements of nitric oxide release
from forest soil
A. Bargsten et al.
Title Page
Abstract Introduction
Conclusions References
Tables Figures
◭ ◮
◭ ◮
Back Close
Full Screen / Esc
Printer-friendly Version
Interactive Discussion
factors such as canopy density and water availability. For our laboratory measurements influence of water availability or canopy density can not be considered. Any fixation of nutrients should be reflected in the soil parameters with highest soil NH+4 found under moss and grass.
5 Conclusions
5
In this study we investigated the net potential NO fluxes from spruce forest soils, par-ticularly from the organic layers of soils covered with four different understory types
(moss, grass, spruce and blueberry).
Observed net NO release rates of soils under moss and grass cover indicated a high potential for NO consumption, resulting in very low net potential NO fluxes from soils
10
of these understory types. In strong contrast, soils under spruce and blueberry cover showed 10 fold higher net potential NO fluxes, than those covered by moss and grass. Therefore, it is an important lesson of this study is, that more attention must be paid to small scale heterogeneity of understory types, when quantification of the biogenic NO emission from a (spruce) forest floor is attempted.
15
Analysis of the compensation point mixing ratios indicated, that measured ambient mixing ratios of NO at 0.5 cm above the forest floor of the field site were – even for the soils under moss and grass – too low to change the soil NO flux from upward to downward directions.
Further research investigating effective soil diffusion coefficients is very desirable.
20
The net potential NO flux calculated with the diffusion coefficient according to
Milling-ton (1959) is 1.26 fold higher than the net potential NO flux calculated with diffusion
coefficients according to Millington and Quirk (1960). Also the position of the optimum
NO flux shifts depending on the choice of the diffusion coefficient.
While the understory type seems to be an important variable controlling NO
ex-25
BGD
7, 203–250, 2010Laboratory measurements of nitric oxide release
from forest soil
A. Bargsten et al.
Title Page
Abstract Introduction
Conclusions References
Tables Figures
◭ ◮
◭ ◮
Back Close
Full Screen / Esc
Printer-friendly Version
Interactive Discussion
implies that nitrification was the limiting factor of NO production for the investigated soils, whereas denitrification played an obviously smaller role. It is remarkable that high NO emissions were observed for soils under woody understory types; this may be related to soil chemical processes in the vicinity of mycorrhized roots, but further studies are certainly necessary for confirmation. As the establishment of different
un-5
derstory types is related to the availability of light at the forest floor as a result of forest thinning, management practises are likely to have important consequences on the net soil NO emission from a forested site.
Coniferous forest soils in temperate humid climates are characterized by thick or-ganic layers of moder or raw humus forms. Oror-ganic layers of our soils had a much
10
higher potential (over 2.5 fold) for NO emission than the corresponding mineral soil lay-ers. Hence quantification of net potential NO fluxes of the O horizons of temperate for-est soils is an important step for (a) comparison of laboratory and field measurements, (b) up-scaling from laboratory to field scale fluxes (by areal information on understory distribution), and (c) extrapolation from field site results to larger scales (e.g. regional).
15
Acknowledgements. The authors gratefully acknowledge financial support by the German
Science Foundation (DFG project: EGER – “ExchanGE processes in mountainous Regions” (ME 2100-4)) and by the Max Planck Society. Thomas Behrendt is thanked for collecting the soil samples. Particle density analyses were performed at the Landesamt f ¨ur Geologie und Bergbau in Mainz, Germany. Soil NO−
3, soil NH +
4, and soil pH were analysed through Bayreuth
20
Center of Ecology and Environmental Research (BayCEER), University Bayreuth, Germany. Corg and C/N ratio were analysed through the laboratory of the Institute of Geography, University of Mainz, Germany.
The service charges for this open access publication
25