Taxes and Labor Supply: Portugal, Europe, and
the United States (Conference Version)
André C. Silva
∗Nova School of Business and Economics
November 2005
Abstract
I relate hours worked with taxes on consumption and labor. I propose a model and compare its predictions for Portugal, France, Spain, United Kingdom and United States. Hours per worker in Portugal decreased from 35.1 in 1986 to 32.6 in 2001. With only the parameters and the taxes for Portugal, the model predicts the hours worked in 2001 with an error of only 12 minutes from the actual hours. Across countries, most predictions differ from the data by one hour or less. The model is able to explain the trend in hours with only the changes in taxes.
Keywords: labor supply, consumption tax, labor income tax.
∗Nova School of Business and Economics, Universidade Nova de Lisboa. Campus de Campolide,
1099-032 Lisboa, Portugal. Email: acsilva@novasbe.pt. Tel: 351-21-380-1600. I thank Pedro Pita Barros, Susana Peralta and an anonymous referee for useful comments. All remaining errors are my own. This paper was prepared for the III Conference “Desenvolvimento Económico Português no Espaço Europeu,” organized by the Banco de Portugal, which took place on February 2006. A technical version of this paper, with additional results on welfare and social security, has been
1. INTRODUCTION
You may cook your dinner when arriving at home or you may heat prepared food.
Heating prepared food requires less time. Regardless of your decision, when the price
of prepared food increases it is more likely that you choose to cook your dinner. To do
this, you will stop working earlier to arrive earlier at home or you will decrease your
leisure time. Probably you will combine the two. Unless you decide to cut entirely
from your leisure time, you will decrease your hours of work in the market.
Taxes influence our behavior because they change relative prices, that is, benefits
and costs of different alternatives. The example above runs for a tax on consumption.
We have a similar effect of a tax on labor income. We care for the goods that we can
produce with our time. When the labor tax increases, we can buy less goods with the
same amount of labor in the market. Therefore, there are more incentives to use our
time in nonmarket activities as doing more domestic tasks, or increasing the leisure
time.
Hours worked per worker in Portugal decreased from 35.1 hours per week to 32.6
hours per week from 1986 to 2001. The data are from the Organisation for Economic
Co-operation and Development (OECD). Consumption and labor taxes increased
during the same period. If we adjust a model to the average levels of hours and taxes
for Portugal during 1986 to 1989 and let taxes vary but fix all other parameters, we
can predict the number of hours worked and compare the predictions with their actual
values. This exercise yields a prediction of 32.4 hours worked in 2001. According to
these results, with only the change in taxes and abstracting from any other change
in Portugal during these 15 years, we can predict the number of hours worked with
an error of a little more than 10 minutes, or less than 1 percent from the true value!
The same model predicts a decrease in the number of hours to 31.9 hours per week if
labor.
The model does not make as precise predictions for all periods. It follows the
general trend up or down of hours worked, but it misses, for example, a peak of
hours worked in 1995. Nevertheless, the model is surprisingly precise to follow the
general trend. Figure (1) shows the data and the predictions of the model in each
year from 1986 to 2001. The results in thisfigure are for the parameters of the model
calculated for Portugal. We will also calculate the parameters taking into account
other countries and compare the new predictions with the data.
Portugal
31.5 32.0 32.5 33.0 33.5 34.0 34.5 35.0 35.5 36.0
1986 1988 1990 1992 1994 1996 1998 2000 2002
H
our
s
per
w
eek
p
er
w
or
k
er
Actual Hours Predicted Hours
Fig. 1. Predicted hours obtained from the model developed in sections 2 and 3.
Source of actual hours: OECD.
This paper is about the effects of consumption and labor taxes on labor supply. I
will make the model and the definitions more precise in the following sections. I will
focus on Portugal but I will also compare the predictions and the results with other
countries. To do this we need to use data the most comparable as possible. For this
and National Accounts and the OECD labor market statistics. I expect that using the same source of data we can minimize the chance of committing errors as trying
to explain something that is only an effect of different measurement standards. The
appendix contains more details about the data sources.
Notice the implications of a decrease in hours worked in the market caused by an
increase in taxes. One effect is the decrease in total production. With less products
we also have less consumption and investment and less welfare. But it can be the
case that the total number of hours stays constant but simply flows from market to
nonmarket activities. Even in this case, we can still have welfare consequences.
When I say hours worked in the market I refer to hours used in the legal market for
production. Hours not used in the market can be used for leisure or for nonmarket
work. Leisure refers to activities that do not increase the quantity of goods and
services available. Nonmarket work refers to domestic labor, as cooking your own
dinner or teaching your children, or to work in the underground economy.
We use markets to specialize in some activities and increase our ability to produce
more goods. I can produce an apple planting an apple tree in my backyard or buying
it in a supermarket with my labor income. I prefer to use markets, that is, to use the
supermarket, because I know that I will use my time better in this way.
Therefore, even if the total quantity of time devoted to work does not change when
hours worked in the market decrease, we would probably be more efficient using the
time in market activities. Moreover, the decrease in market work can also correspond
to an increase in the underground economy. As taxes increase, the incentives for
nonmarket work increase and so the economy works less efficiently.
I use the annual hours of work from the OECD and divide by 52 to obtain the
weekly hours of work. I focus on the decision of hours worked and not worked in
the market. If the workers in a country have less vacation for the same number of
Consequently, their average number of hours per week is also higher.
The work is inspired by Prescott (2004) “Why do Americans work so much more
than Europeans”. He argues that the main factor able to explain the difference
of income per capita in the United States and in the group of European countries
Germany, France, Italy and the United Kingdom is the number of hours worked per
person. The number of hours worked, in turn, can be almost fully explained by the
higher taxes in the group of European countries.
Here I focus on the effects of taxation on the labor supply for different years. I
investigate whether only taxes are able to explain the behavior of the number of hours
worked in each year, and whether it can explain the difference in hours between
countries. In addition to Portugal, I focus on the countries France, Spain, United
Kingdom and United States.
Ifind that the increase in taxes during 1986 to 2001 is very good in predicting the
behavior of labor supply in Portugal. Differences in taxes alone are not as precise
in predicting differences in labor supply across Portugal and the other countries, but
they are still able to explain a great part of the difference.
In section 2 below I discuss the effects of taxation on labor supply with an economic
model. We then have to calculate the labor and consumption taxes for Portugal and
other economies to compare the predictions of the model with the actual values of
labor supply. There are several taxes in each economy with incidence on consumption
and labor. We have to find a way to aggregate all these taxes in one number for
consumption and another one for labor. This is done in section 3. In section 4, I use
the calculated taxes to discuss the implications of the model, and discuss additional
2. TAXES AND THE DECISION OF CONSUMPTION AND LABOR
What to expect from an increase in taxes regarding the decision of consumption
and labor? We need to build a model with the following ingredients: a decision of how
much to consume and work, taxes on consumption and labor, a government sector,
and a production sector.
The elements of the following model are standard, it is the same model used by
Prescott (2004). Its advantage is to model explicitly the decisions of consumers and
firms, and the possibility to confront the predictions with data. Different versions of
the model have been used in several applications. They can be found, for example,
in the papers in Cooley (1995).
I treat all consumers in the economy as if they were represented as an average
consumer or a representative consumer. When I mention the consumer, I am in fact
making a reference to this representative consumer.
The only taxes that affect the decision of consumption and labor in each period
are the consumption and the labor taxes. We can have other taxes in the economy as
taxes on capital gains or taxes on investment but only consumption and labor taxes
are important for our purposes. It is interesting to lookfirst to the budget constraint
of an average household to understand this behavior.
The budget constraint defines the resources available and their possible uses. Let us
talk first about the resources. If the consumer works the number of hours ht at time
t for a wage wt then the labor income will be equal towtht. If there is a labor taxτh
then the labor incomeafter taxes, available for consumption, is equal to(1−τh)wtht.
The timetsubscript stresses that the consumer must make a decision for each period.
If the same consumer has a certain quantity of capitalkt and the interest rate during
the period is rt then the capital income will be equal to rtkt. If there is a tax on
depreciation of capital caused by its use. The government may also redistribute part
of the taxes back to consumers in the form of transfersTt, which are also part of the
resources.
The possible uses of the resources are consumption, ct, and investment, xt.
Con-sumption stands for conCon-sumption of goods and services. If the tax on conCon-sumption is
τcthen the price of a unit of consumption must be multiplied by(1 +τc). Similarly, if
the tax on investment isτx then the price of a unit of investment must be multiplied
by(1 +τx).
Therefore, a consumer in this economy faces the budget constraint
(1 +τc)ct+ (1 +τx)xt= (1−τh)wtht+rtkt−τk(rt−δ)kt+Tt. (1)
The left-hand side shows the possible uses for the resources: consumption and
invest-ment. The right-hand side shows the different resources: labor income, capital gains
and transfers. The consumer has to decide the levels of ct, ht and xt such that the
constraint above is satisfied. The important variables for our purpose arect andht.
Everything is in terms of the price of the consumption good. Therefore, if the
consumer works one hour, it will be possible to consume (1−τh)wt units of the
consumption good.
The tax systems in the world are much more complicated than what we have in
the budget constraint above. There are tax brackets, exemptions, subsidies for some
investments and so on. But considering these complications will not change the basic
point of the analysis. In section 3, I map the tax revenues and the tax bases to the
relevant taxes in the model.
The quantity of capital and the quantity of investment are related. The quantity
from the use of capital plus any investment made today. In symbols, write
kt+1= (1−δ)kt+xt. (2)
What is invested today will be available tomorrow in the form of capital and will
generate an additional form of income tomorrow. Therefore, investment is only a
way to connect consumption today with consumption tomorrow. As consumption
and investment are connected, apart from the taxes τc and τx, the price of a unit
of investment is equal to the price of a unit of consumption. It is only a decision of
consuming today or tomorrow.
The decision of working and consuming, on the other hand, affect the consumer in
the same period. As capital will sooner or later be transformed in consumption, we
can consider only the quantity of consumption and labor as the variables of interest
in each period.
It is reasonable to admit that any additional amount of consumption makes the
consumer happier. It is also reasonable to say that the quantity of time available
for the consumer is fixed, and that any increase in the time available after working
also makes the consumer happier. The time not working can be used to a nonmarket
activity, as the production of goods to be consumed at home, or to be enjoyed as
leisure. The number of hours ht refer to the quantity of work in the market. The
model, therefore, considers the decision of consumption, labor and savings of an
employed worker. It does not consider the decision of entering or not in the labor
force as a job searcher.
If the quantity of hours worked in period t increases one unit then the quantity
of leisure decreases. If it were for only this effect the consumer would be worse off.
But, from the budget constraint, the amount of resources will increase by(1−τh)wt
used for consumption, the consumer will be able to consume (1−τh)
(1 +τc)
wt units of the
consumption good.
The ratio (1−τh)
(1 +τc)
wt is key for this analysis. It relates how many units of the
consumption good we are able to consume when we give up one unit of leisure. If
taxes on labor or on consumption increase then the number of consumption units
decrease. There are two important aspects to pay attention. The first is that taxes
on capital income do not appear in this ratio. The second is that taxes on labor and
on consumption have similar effects: a unit more of work will bring less goods if the
labor tax is higher or if the consumption tax is higher. In fact, for small values ofτh
andτc, the number (1−τh)/(1 +τc)can be approximated by 1−τh−τc.
We need to be more explicit in the way the consumer weights the benefits of
con-sumption and labor in order to make predictions as the ones contained in Figure
(1).
Suppose that consumption and labor in each period yield a level of welfare given
by
logct+αlog (100−ht). (3)
The number100comes from the assumption that the consumer has100hours available
in each week. The number of working hours have to be taken from these 100 hours.
The parameterα is a positive constant. It will be used later to calibrate the model to
the actual economies. The logarithmic function logX is increasing in X. Therefore,
as consumption or leisure hours increase, the welfare in each period increases.
Our consumer evaluates consumption and leisure for all periods. But recent periods
are valued more than later periods. That is, the period t is discounted by the value
βt, whereβ is greater than zero but less than one. The welfare of all periods is given
by the sum of the terms βt×(logct+αlog (100−ht)) for t = 0, 1, 2 etc. As the
parameter β will not play an important role for our purposes
To close the model we need to define how products are produced and the role of
government in this economy.
Products are produced byfirms. They combine capital and labor to produce goods.
Capital corresponds to the machines, tools and instruments used to manufacture the
products. Capital and labor must be hired in the market, their prices are given
respectively by rt andwt. Let yt denote the value of production. Capital, labor and
production are related by the production function
yt=Atkθth
1−θ
t . (4)
The constant θ is positive and between zero and one. So, when capital or labor
increase, production increases. θ is equal to the fraction of capital income in the
total income. Correspondingly, 1− θ is equal to the fraction of labor income in
the total income. This parameter does not vary much from country to country and
during different time periods. The parameter At is called total factor productivity.
According to this model, if two countries use the same quantity of labor and capital
but produce different quantities of the consumption good it is because At is different
between them. But At will not affect the quantity of hours worked and will not be
important for our purposes.
Profits are given by the difference between revenue and costs. Profits are therefore
given by
Atktθh
1−θ
t −wtht−rtkt. (5)
A useful result is that, in order to maximize profits, eachfirm will set the quantity of
capital and labor so that wages and the production function are related by
wt= (1−θ)
yt
ht
There is also another condition for the interest rate. As interest rates do not enter in
the decision of consumption and labor within periods, we will not use this additional
condition here.
Total production is used for consumption and investment. The government also
uses part of the production to provide goods for the citizens. Let gt denote the
quantity of goods consumed by the government and left to the consumer. Some
examples of this kind of good are public schooling, police service and the maintenance
of public parks. Total consumption in this economy is given byct+gt. As consumption
and investment must come from production, we have
ct+xt+gt=yt. (7)
The government collects taxes to pay for government consumption. Any difference
between the government’s revenue and the government consumption is given back to
consumers in the form of transfers Tt. Therefore, the government budget constraint
is given by gt+Tt=revenues from taxes.
Solving the model
The variable that we do not know and need tofind is the number of hours worked
in each period, ht. Solving the model means writing ht as a function of the tax rates
and of the parametersθandα. We do not knowct,xtandkteither and a full solution
also involves obtaining these variables. Here we are concerned with the behavior of
hours worked and so we will concentrate on ht.
The value ofht depends on how consumers value consumption and leisure, and on
how firms value the use of labor and capital.
From the standpoint of consumers, when they increase one unit of labor they have a
decrease in welfare of α
100−ht
in (3). On the other hand, this unit of labor allows them to buy 1−τh
1 +τc
wt units of the
consumption good and yields an increase in welfare of 1
ct
1−τh
1 +τc
wt. Consumers will
increase the quantity of labor until the benefits are greater than the loss in welfare.
Therefore, they will choose consumption and labor so that
α 100−ht
= 1 ct
1−τh
1 +τc
wt. (8)
Firms choose capital and labor so thatwt= (1−θ)yt/ht. With this, we have
α 100−ht
= 1 ct
1−τh
1 +τc
(1−θ) yt ht
,
or
ht = 100×
1−θ
1−θ+αct yt
1 1−τ
, (9)
where 1−τ = 1−τh 1 +τc
.
Equation (9) is the key to understand how taxes influence labor supply. If taxes on
labor or on consumption increase, thenτ increases, the denominator increases and so
the number of hours worked, ht, decreases. The ratio of consumption to production,
ct/yt, depends on the expectations about the future. For example, if taxes are higher
in the future relative to today then it is better to work more now, save the additional
proceeds, and use the savings in the future. The additional savings will decrease the
ratio of consumption to production.
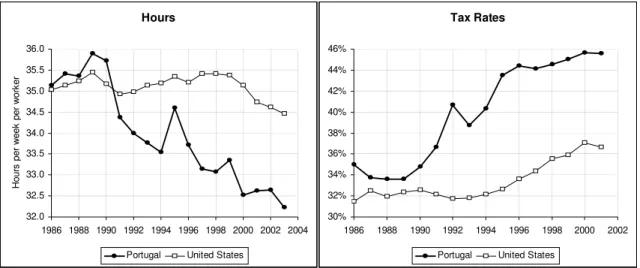
Figure (2) shows data on hours per worker for Portugal and for the United States
from 1986 to 2001 and the values of τ for the two countries in the same period. We
see that hours per worker decreased more in Portugal and that taxes increased more
in Portugal. This observation agrees with the model. To be more precise, we have to
of the model and the actual values of hours per worker. This is the subject of the
next sections. First, we have to calculate the tax rates to be used in equation (9).
Hours 32.0 32.5 33.0 33.5 34.0 34.5 35.0 35.5 36.0
1986 1988 1990 1992 1994 1996 1998 2000 2002 2004
Ho ur s per w e ek p e r w o rk er
Portugal United States
Tax Rates 30% 32% 34% 36% 38% 40% 42% 44% 46%
1986 1988 1990 1992 1994 1996 1998 2000 2002
Portugal United States Hours 32.0 32.5 33.0 33.5 34.0 34.5 35.0 35.5 36.0
1986 1988 1990 1992 1994 1996 1998 2000 2002 2004
Ho ur s per w e ek p e r w o rk er
Portugal United States
Tax Rates 30% 32% 34% 36% 38% 40% 42% 44% 46%
1986 1988 1990 1992 1994 1996 1998 2000 2002
Portugal United States
Fig. 2. Source for Hours: OECD. Tax rates: calculations by the author following
section 3.
3. TAXES ON LABOR INCOME AND CONSUMPTION
We have to calculate the value of taxes over the years. Consider the tax on
con-sumption for example. We have different taxes with incidence over the various goods
and services traded in the economy. Usually taxes are small for basic food and high
for luxury goods. In the model, the unique good represents all kinds of goods and
services. Therefore, the tax on consumption τc must represent the tax on all goods
and services.
The same idea applies to the labor tax. The income tax systems are progressive over
income and allow for exemptions and deductions. We also have social security taxes
paid by workers. Moreover, we have to consider the difference between marginal tax
rates and average tax rates. Consumers decide over consumption or labor according
on labor. Hence, consumers make decisions according to the marginal tax rate, and
not according to the average tax rate.
The calculations follow the same principle: dividing the revenues from the tax by
the tax base. We have data of tax revenue detailed by the origin for all OECD
coun-tries from the OECD database. We also have data for National Accounts aggregates
as consumption and GDP from the same database. Using this data and the procedure
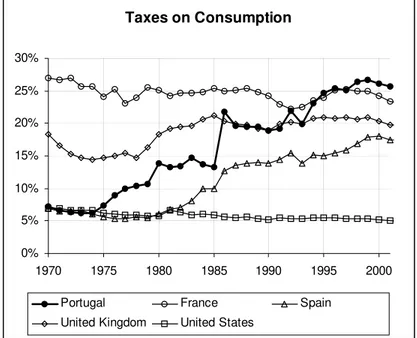
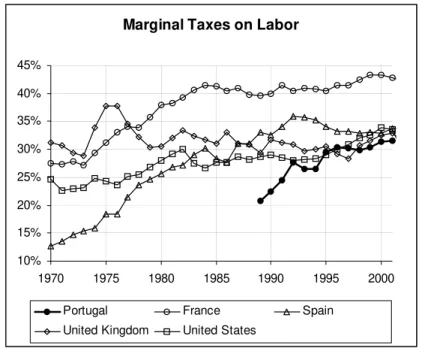
described in detail in the next paragraphs, I obtained the taxes infigures (3) and (4).
Taxes on Consumption
0% 5% 10% 15% 20% 25% 30%
1970 1975 1980 1985 1990 1995 2000
Portugal France Spain
United Kingdom United States
Fig. 3. Source: author’s calculations based on OECD data.
The idea of using National Accounts aggregates to calculate effective tax rates has
its origins in Lucas (1990) and was extended by Mendoza, Razin and Tesar (1994).
Prescott (2002) and Prescott (2004) also used this method and I am following closer
his calculations. There are some differences in my calculations in order to yield
longer series and being the most comparable as possible. Calculating directly using
Marginal Taxes on Labor
10% 15% 20% 25% 30% 35% 40% 45%
1970 1975 1980 1985 1990 1995 2000
Portugal France Spain
United Kingdom United States
Fig. 4. Source: author’s calculations based on OECD data.
not modify the conclusions as I calculate the taxes for each country using the same
procedure.
The sources of data are from the OECD publicationsNational Accounts, Detailed Tables: vol II andRevenue Statistics of OECD Member Countries. The codes of the items used in the calculations are in the appendix.
For the tax on consumption τc I divide the revenues from indirect taxation by
household final consumption expenditure minus indirect taxation. The revenues
con-sidered for the consumption tax come from general taxes from goods and services
and from excise taxes. Final consumption expenditures takes into account indirect
taxation in the National Accounts. Therefore, we have to subtract these taxes tofind
the relevant tax base.
As Mendoza-Razin-Tesar note, part of the indirect taxation comes from taxes paid
government consumption and wages paid to government employees. As the
denomi-nator is bigger with the government sector, the tax on consumption calculated in this
way is smaller. However, I compared the calculations with the two methods and the
two series are very close, moving almost in parallel. For Portugal, the OECD database
would allow us to calculate consumption taxes only for the period 1995-2001. The
difference between the calculations with or without the government sector are about
five percentage points for this period. The advantage of using the simpler formulation
is that it is possible to construct a longer series.
For the tax on labor income τh we have to calculate the social security tax and a
measure for the marginal income tax not including the social security tax.
The social security tax is obtained by dividing the social security contributions by
the labor income. From equation (6) of the model in section 2, the share of labor
income over total production is equal to 1−θ. Therefore, I use (1−θ) times GDP
less indirect taxes as an estimate of the labor income. We have to subtract indirect
taxes from GDP because the National Accountsfigures include the payment of taxes.
I set 1−θ = 0.7. This share is approximately constant over countries and time and
the number used is conventional in models of this type. Gollin (2002) obtains further
evidence for this number and for the stability of the labor share across countries.
The difficulty for the calculation of the labor shares results from the estimation of
the labor income of the self-employed. Gollin (2002) finds that the labor shares are
approximately constant, in the range of 0.65 and0.80, once the labor income of the
self-employed is treated carefully. The conclusions of the present analysis do not
change if we consider other values for this parameter in this range.
The average income tax is calculated by dividing the revenue from taxes of
individ-uals by GDP less indirect taxes less the depreciation of capital. Consumers care for
the tax payments of an additional unit of labor. This marginal tax rate is higher than
obtain the marginal tax rate, I follow Prescott (2002, 2004) and multiply the average
tax rate by the factor 1.6. The labor income tax is then obtained as the sum of the
social security tax and the marginal labor income tax.
4. DATA AND PREDICTIONS
We now turn to the predictions of the model. I repeat the key equation for the
predictions of the model for convenience
ht = 100×
1−θ
1−θ+αct yt
1 1−τ
, (9)
where 1−τ = 1−τh 1 +τc
. The taxes τh andτc are the labor income and consumption
taxes.
The objective of this section is to use the same model for different countries and
ver-ify if the difference in the tax rates is able to explain most of the difference in hours
worked. In addition to Portugal the countries chosen for this study were France,
Spain, United Kingdom and United States. I first focus on four periods: 1970-1974,
1983-1986, 1993-1996 and 2000-2002. The first period is the first that we have data
available for France, United Kingdom, and United States. Thefirst observation
avail-able for Portugal is in 19861, therefore I included the period 1983-1986. The period
2000-2002 is the last period that we have data available. Prescott (2004) focuses on
the periods 1970-1974 and 1993-1996.
Several other important features may affect the number of hours worked and labor
market statistics. For example, Bover, Garcia-Perea and Portugal (2000) and
Blan-chard and Portugal (2001) analyze how institutional structures such as unemployment
1Labor income taxes are available since 1989 for Portugal. I maintained the labor income tax
benefits, unions and other factors can affect unemployment and unemployment
dura-tion. Here I focus on taxes and the differences in hours worked.
I used two estimates for ct in equation (9). In the first case I considered only
private consumption net of indirect taxes. In the second I also considered government
consumption. So, ct = Ct− Indirect Taxes in the first case and ct = Ct +Gt−
Indirect Taxes in the second case. CtandGtare thefigures of private and government
consumption in the National Accounts data. The value of yt is the same in the two
cases: yt =GDP− Indirect Taxes.
The justification for considering government consumption as part ofct is that this
value may substitute part of private consumption. However, I do not have a clear
estimate of the degree of substitution between private and government consumption.
Therefore, I calculated the predictions for the two extreme cases, with zero or
one-to-one substitution, and compared with the actual values.
The parameter α sets the weights between consumption and leisure. It should
have the same value for all countries to assess how much of the difference in hours
is explained by the difference in taxes only. This parameter is obtained so that the
difference between the actual and the predicted values of hours worked is minimized
for the period 1970-1975 for France, United Kingdom and United States. It yields
α = 1.39and α= 1.02 when we consider respectively private consumption only and
private and government consumption. The predictions offigure (1) were obtained for
a value of α set to minimize the difference during the period 1986-1989 for Portugal,
with only private consumption. This yieldsα = 1.47and is used to assess how much
of the change in hours during the period 1986-2001 may be accounted for changes in
the tax rates for Portugal.
Therefore we estimate the parameterα in two ways. In the first way we focus on
Portugal and obtain thefirst predictions infigure (1) as a starting point. In the second
In this second way the parameter α is set independently from the data for Portugal.
Any difference in the predictions of hours worked across countries and through time
is because of the difference in taxes and the difference in the ratio of consumption to
GDP. I now focus on this second estimation ofα.
Table 1 compares the actual hours and the predicted hours using the model for the
countries studied. Each period has the average of the actual and the predicted values.
Each column for a prediction fixes the same value of α for all countries. Therefore,
I fix tastes on consumption and leisure and all kinds of institutional arrangements
across countries. I allow only taxes to vary and the corresponding equilibrium value
ct/yt.
Table 1. Actual and Predicted Hours
Portugal France Spain
Actual Pred 1 Pred 2 Actual Pred 1 Pred 2 Actual Pred 1 Pred 2
1970-74 - - - 35.9 37.2 36.4 - - -
1983-86* 35.1 36.2 37.7 31.6 31.9 29.6 36.0 35.3 36.8
1993-96 33.9 33.6 33.5 30.2 32.6 29.9 34.9 33.9 34.0
2000-02** 32.6 33.5 32.4 28.3 32.4 29.8 34.9 34.6 34.7
United Kingdom United States
Actual Pred 1 Pred 2 Actual Pred 1 Pred 2
1970-74 36.6 34.8 34.8 36.3 37.0 38.1
1983-86 33.5 34.4 33.2 35.1 35.2 36.5
1993-96 33.3 33.7 33.4 35.2 33.8 35.9
2000-02 32.8 32.3 32.3 34.8 32.1 34.5
Hours per week per worker. Pred 1: predictions with private consumption. Pred 2: predictions with private and government consumption. * 1986 only for Portugal. ** 2000-01 only for Portugal.
Source of actual hours: OECD.
Although the model abstracts from several potentially important features of the
rates. Most of the numbers are around one hour of error from the actual value of
hours worked. Only five predictions misses the actual numbers for more than two
hours.
According to table 1, the predictions for hours worked for Portugal are above the
actual values for 1986 and are much closer for 1993-96 and 2000-01. For Spain, in
only one period the model predicts the hours with more than one hour of error. For
the United Kingdom it misses the period 1970-74 but it is good in predicting the
other periods. For France, the model predicts more hours of work than the actual
values specially for the period 2000-2002. It can be an effect of the new legislation
on the reduction of the working week in France, and it can have a greater role than
the change in taxes for this period.
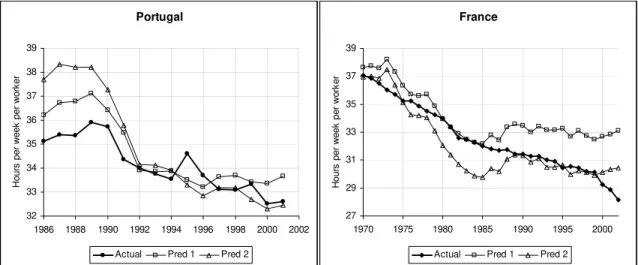
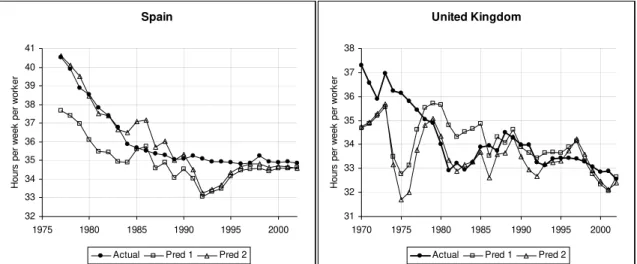
Therefore, the model is good in predicting the general pattern of hours worked
even though it misses some observations. As everything isfixed across countries and
only taxes are allowed to vary, this shows that taxes have an important effect in the
number of hours worked. The good fit is more surprising for Portugal and Spain as
I have not used these countries to estimate the value of α, and we could believe a
priori that they are much different from the other countries apart from the difference
in taxes. Seefigures (5)-(7) for the comparison of actual and predicted hours year by
year.
I am using hours per worker as a benchmark to compare the predictions of the
model. We can also think about using hours per capita, or hours per person in the
active population. In the model, the worker decides how much to work in one job,
and therefore hours per worker seem appropriate to use as the benchmark. It states
how many hours someone will work, given the fact that the decision of entering the
labor market has already been made. If the consumer is an average worker, taking
into account those that are in the labor force and those there are not, hours per capita
Portugal 32 33 34 35 36 37 38 39
1986 1988 1990 1992 1994 1996 1998 2000 2002
Ho ur s per we ek per wo rk e r
Actual Pred 1 Pred 2
France 27 29 31 33 35 37 39
1970 1975 1980 1985 1990 1995 2000
H o u rs per w e ek pe r wo rk er
Actual Pred 1 Pred 2 Portugal 32 33 34 35 36 37 38 39
1986 1988 1990 1992 1994 1996 1998 2000 2002
Ho ur s per we ek per wo rk e r
Actual Pred 1 Pred 2
France 27 29 31 33 35 37 39
1970 1975 1980 1985 1990 1995 2000
H o u rs per w e ek pe r wo rk er
Actual Pred 1 Pred 2
Fig. 5. Source of actual hours: OECD. Pred 1: predictions using only private
con-sumption net of indirect taxes. Pred 2: predictions with private and government consumption net of indirect taxes.
Hours per working age person in Portugal are on average 2.4 hours lower than
in the United States during 1986 to 2001. During the same period, however, hours
per person were more or less constant as the number of people in the labor force
increased. Prescott (2004) uses hours per working age person (by convention, people
aged 15 to 64) and he also finds an important effect of taxes on the supply of labor.
He notes, however, that hours per capita increased in the United States during
1970-1990 although taxes increased or remained approximately constant. He then notices
that households switching from one wage earner to two wage earners may explain this
behavior. In my analysis, I abstract from this possibility.
Davis and Henrekson (2004) show further evidence on the impact of consumption
and labor income taxes on labor supply. They use an empirical analysis to study the
relation between taxes and labor supply. They find that a 12.8 percentage points
increase in the tax rate implies 122 market work hours per year per adult, a decrease
Spain 32 33 34 35 36 37 38 39 40 41
1975 1980 1985 1990 1995 2000
H ou rs per w e ek pe r w o rk er
Actual Pred 1 Pred 2
United Kingdom 31 32 33 34 35 36 37 38
1970 1975 1980 1985 1990 1995 2000
H ou rs per w e ek pe r w o rk er
Actual Pred 1 Pred 2 Spain 32 33 34 35 36 37 38 39 40 41
1975 1980 1985 1990 1995 2000
H ou rs per w e ek pe r w o rk er
Actual Pred 1 Pred 2
United Kingdom 31 32 33 34 35 36 37 38
1970 1975 1980 1985 1990 1995 2000
H ou rs per w e ek pe r w o rk er
Actual Pred 1 Pred 2
Fig. 6. Source of actual hours: OECD. Pred 1: predictions using only private
con-sumption net of indirect taxes. Pred 2: predictions with private and government consumption net of indirect taxes.
shadow economy equal to 3.8 percent of GDP. It also decreases employment in retail
trade and repairs, and in eating, drinking and lodging. The increase in taxes affect
more heavily these industries with less-skilled labor as it is easier to substitute market
work for domestic work in these sectors.
There are also other explanations for the difference of labor supply in Europe and
in the United States. Alesina, Glaeser and Sacerdote (2005) state that policies of the
unions and labor market regulations are able to account for most of the difference in
labor supply.
5. CONCLUSIONS
Tax rates affect the decision of labor supply by changing the relative benefits and
costs of work and consumption. The effect is large. For Portugal, France, Spain,
United Kingdom and United States, taxes are able to predict the pattern of the labor
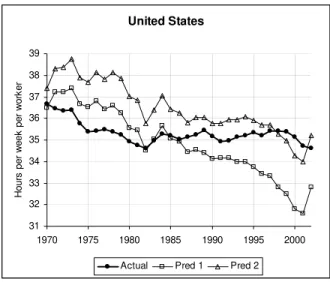
United States
31 32 33 34 35 36 37 38 39
1970 1975 1980 1985 1990 1995 2000
H
o
u
rs
pe
r w
e
ek
pe
r
w
o
rk
er
Actual Pred 1 Pred 2
Fig. 7. Source of actual hours: OECD. Pred 1: predictions using only private
con-sumption net of indirect taxes. Pred 2: predictions with private and government consumption net of indirect taxes.
I first estimate the tax rates for the countries considered during 1970 to 2001.
For all countries, taxes increased during the period and the number of hours worked
decreased. I then compare the predictions of the model on hours worked per worker
with the actual values for each country. Most of the predictions are different from
the actual values by one hour or less. The model is able to follow the general pattern
of labor supply.
Hours refer to hours working in the market. When the number of hours worked
decreases, the number of nonmarket hours increases. These hours may be leisure
hours or hours used in the production of nonmarket goods, as domestic production.
Production is a function of hours worked. With a decrease in the number of hours
worked, the number of consumption goods decreases. Therefore, when consumers
decide to work less hours, they consume less products in the market and increase
their consumption of leisure or nonmarket goods.
makes consumers less efficient. A result in Economics is that decisions are efficient
when the costs and benefits are equalized by consumers and firms. With taxes,
consumers receive a wage but can buy goods only with the after-tax wage. Therefore,
firms and consumers do not equalize the costs and benefits of the labor decision.
GDP per capita in Portugal increased from US$ 10,700 to US$ 17,100 during the
period from 1986 to 2003. These arefigures in dollars of 2000 corrected for purchasing
power. Relative to the United States, GDP per capita in Portugal increased from 41
to 48 percent during this period. In order to continue growing at high growth rates
we have to look for ways to make the economy more efficient. Paying attention to
the incentives that make consumers decide on their use of time is one of them.
APPENDIX - DATA SOURCES AND FORMULAS FOR THE TAX
RATES
The sources of data for National Accounts and Revenue Statistics are from the
OECD (Organisation for Economic Co-operation and Development) publications Na-tional Accounts, Detailed Tables: vol II and Revenue Statistics of OECD Member Countries. I use the OECD online dataset SourceOECD. For the labor force, I use the data available online from the OECD following the path Statistics/Data by
Topic/Labour/Labour Force Statistics - Data, “Average actual annual hours worked
per person in employment”. I divide the annual hours by 52 to write the values in
weekly hours. For thefigures of GDP per capita, I use the “Comparative tables based
on exchange rates and PPPs”.
The formulas for the tax rates on consumption and labor are
τc=
IT C−IT,
τc and τh denote respectively the tax rate on consumption and the marginal tax
rate on labor income. τSS and τh denote respectively the social security tax and
the average tax rate on labor income. C denotes consumption expenditures and IT
denotes indirect taxes on consumption. In the National Accounts, the final price of
the products are used to calculate aggregate consumption expendituresC. Therefore
C takes into account the indirect taxation. Therefore, we have to subtract indirect
taxation from consumption expenditures to find the relevant tax base.
The social security tax and the average labor income tax are obtained by
τSS =
Social Security Contributions
(1−θ) (GDP −IT) ,
τavgh = Direct Taxes of Individuals GDP −IT −Depreciation.
The parameterθ is the fraction of capital income in the total income. Hence, 1−θ is
equal to the fraction of labor income in the total income. In the Revenue Statistics,
social security contributions are given by the item 2000, IT is given by the sum of
the items 5110 and 5121 and Direct taxes of individuals is given by the item 1100.
We have to subtract indirect taxes from GDP because the value of the GDP in the
National Accounts includes indirect taxes. See section 3 for the explanation of the
formulas.
REFERENCES
Alesina, Alberto, Edward Glaeser and Bruno Sacerdote (2005). “Work and
Leisure in the U.S. and Europe: Why So Different?” NBER Working Paper 11278.
Blanchard, Olivier and Pedro Portugal (2001). “What Hides Behind an
Un-employment Rate: Comparing Portuguese and U.S. Labor Markets.” American
Bover, Olympia, Pilar Garcia-Perea and Pedro Portugal (2000). “Labour
Market Outliers: Lessons from Portugal and Spain.” Economic Policy, 31: 379-428.
Cooley, Thomas F., ed. (1995). Frontiers of Business Cycle Research. Princeton: Princeton University Press.
Davis, Steven J. and Magnus Henrekson (2004). “Tax Effects on Work
Ac-tivity, Industry Mix and Shadow Economy Size: Evidence from Rich-Country
Comparisons.” NBER Working Paper 10509.
Gollin, Douglas (2002).“Getting Income Shares Right.”Journal of Political Econ-omy, 110(21): 458-474.
Lucas, Robert E., Jr. (1990). “Supply-Side Economics: an Analytical Review.”
Oxford Economic Papers, 42: 293-316.
Mendoza, Enrique G., Assaf Razin, and Linda L. Tesar (1994). “Effective
Tax Rates in Macroeconomics: Cross-Country Estimates of Tax Rates on Factor
Incomes and Consumption.” Journal of Monetary Economics, 34(3): 297-323.
Prescott, Edward C. (2002). “Prosperity and Depression.” American Economic Review, 92(2): 1-15.
Prescott, Edward C. (2004). “Why Do Americans Work So Much More Than