Dennis Travagini Cremonese et al.
Abstract
In the early stage of front-end studies of a Mining Project, the global availability (i.e. number of hours a plant is available for production) and production (number of hours a plant is actually operated with material) time of the process plant are normally assumed based on the experience of the study team. Understanding and deining the availability hours at the early stages of the project are important for the future stages of the project, as drastic changes in work hours will impact the economics of the project at that stage. An innovative high-level dynamic modeling approach has been developed to assist in the rapid evaluation of assumptions made by the study team. This model incorporates systems or equipment that are commonly used in mining projects from mine to product stockyard discharge after the processing plant. It includes subsystems that will simulate all the component handling, and major process plant systems re-quired for a mining project. The output data provided by this high-level dynamic simu-lation approach will enhance the conidence level of engineering carried out during the early stage of the project. This study discusses the capabilities of the approach, and a test case compared with standard techniques used in mining project front-end studies.
Keywords: mining, dynamic simulation, high-level simulation model.
Dennis Travagini Cremonese
Doutorando
Universidade de São Paulo - USP
Departamento de Minas e Engenharia do Petróleo São Paulo – São Paulo – Brasil
Bhaskar Karanth
Global Tech and Engineering Director Hatch - Iron Ore BU
Montréal – Quebec – Canada [email protected]
Giorgio de Tomi
Professor Associado
Universidade de São Paulo - USP
Departamento de Minas e Engenharia do Petróleo São Paulo – São Paulo – Brasil
A high-level dynamic analysis
approach for studying global
process plant availability and
production time in the early
stages of mining projects
Mining
Mineração
http://dx.doi.org/10.1590/0370-44672016700043
1. Introduction
The eficiency of complete mineral processing facilities depends on the uti-lization of various subsystems and their degree of decoupling (Miller, 1979). The intermediate stockpiles and surge bins are important components that help to avoid unscheduled shutdowns (Berton et al., 2013). In the current economic
condi-tions, every investment dollar required to be spent on surge storage systems in these facilities should match the production sys-tem utilization. Any deviation from it will result in either losing production or poor capital investment eficiency.
All current major mining projects go through some form of front-end (FEL) studies, in line with IPA deinitions (Stange and Cooper, 2008), before reaching the implementation stage. The investment community is not willing to take as many risks in the year ahead and puts more pres-sure on mining companies to deliver the project eficiently (Nikkhah and
Ander-son, 2001; Ernst & Young, 2013). Many projects start with a scoping study (FEL1), followed by a pre-feasibility study (FEL2) and a feasibility study (FEL3), before be-ing approved for implementation. For all the stakeholders, it is very important to sustain project viability throughout these phases, with the exception of the identiied risks that may change the project course in the future. The changes in the project configuration established in the early stages are expected to include mitigation of risks identiied in the previous phase or additional data availability that supports a better deinition of the project. Most of the stakeholders understand and agree to most of these changes when they are related to better deinition of the process or mitigation of the risks foreseen in the previous stage(s). However, some of the parameters that form these studies, which are not scrutinized a great deal during the early stages, are the sizing of stockpiles,
effective utilization of the plant as a total system, etc. The values for these items are assumed based on experience in most stud-ies; the estimated values may cause change in the costs in the future phases of the project. These assumptions can impact the current study outcome or the later phase. Any major changes to these parameters can inluence the cost of the project. To enjoy investor conidence in the long term, it would be prudent to carry out front-end studies of the project with a better-deined set of utilization and storage parameters, since future project changes are directly related to mining or process changes or identiied risks. This will reduce some of the uncertainty caused by assumptions based solely on experience during the early stages of the project.
mecha-A high-level dynamic analysis approach for studying global process plant availability and production time in the early stages of mining projects
nized. The utilization of the system is adversely impacted if the surge capacity or anticipated decoupling of the plant is not suficient. At the same time, excess surge/ stockpile capacity may decrease the capital eficiency and may result in poor project economics in the early stages, which may make it lose its investment attractiveness. During initial studies, it is better to size the surge capacities that will address both plant utilization and capital eficiency. This is essential to improve the sustainability of future operations (Gomes et al., 2015).
The objective of the ‘High-level Dynamic Analysis Approach’ is to drive engineering to an improved deinition of plant availability, considering the stor-age or surge capacity sizing, during the early stages of mining projects, using the total system concept. This will also help as a project parameter veriication tool to ensure that the plant utilization and
individual production rates are less prone to surprises during future project phases.
Steady-state simulation is less com-plicated to develop and to operate, but dynamic simulation has a higher potential to predict the actual behavior, as it consid-ers the impacts of process and material handling disturbances (Bergquisst, 2012; Asbjörnsson et al., 2013). By simulating a
system in its totality, and not as isolated subsystems, the simulation approach yields globally optimal solutions that meet over-all system objectives (Cardoso and Teles, 1997; Altiok, 2010), as some investments in a determined area do not increase the global performance (Juliá, 2010).
The evaluation model is detailed enough to be accurate, as accuracy is dependent on the simulation success, but detailed simulation will be expensive to model and dificult to operate. Utilizing the information obtained by an inappropriate
or inaccurate model can lead to unex-pected plant behavior, such as underper-formances in critical areas (Asbjörnsson
et al., 2012; Le Roux et all., 2013; Vasabi et all., 2014).
An innovative high-level dynamic modeling approach has been developed by making a generic model that could be easily set to evaluate a mining project in a few hours (around 8–16 h). As the model requires less time to be set than traditional models (which require weeks), it can be used in the scoping study (FEL1) and pre-feasibility study (FEL2).
The contribution of this work is to show that a dynamic analysis can be used in the early stages of mining projects (FEL1 and FEL2), helping in the early detection of capacity and utilization issues of the complete system, and allowing corrective action to update the coniguration and design of equipment and storage.
2. Materials and methods
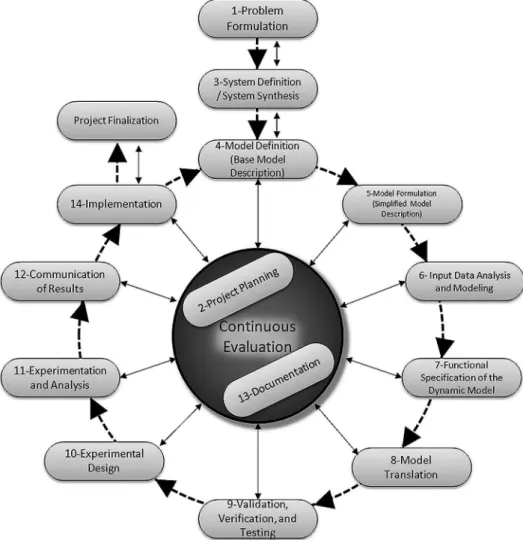
One of the keys to a successful simulation study is to follow a complete methodology in an organized and well-managed way. A comprehensive and disciplined methodology allows complex
models to be built quickly and accurately for maximum beneit. Due to the iterative nature of the method, which does not necessarily follow a list of sequences, some activities may be performed simultaneously
and/ or repeated; the initial idea of the low simulation study is shown in Figure 1 (Cre-monese, 2014). The complete methodology in the development of a dynamic simulation model is described by Cremonese (2014).
Figure 1 Simulation
Dennis Travagini Cremonese et al.
To develop the model with a sufi-cient level of detail, the following assump-tions were considered:
• Only solid low is considered. This
means that the water and particle size are not considered in the model. Inclusion of other parameters would increase model complexity and could make it dificult to use; however, further works are to include these modes, which could lead to studies not intended at the early stage of the project;
• The equipment capacity varies in
a triangular statistical distribution, and all the parameters are deined by the user with the interface provided;
• Unplanned maintenance occurs
in a triangular statistical distribution that considers the minimum value to be 50% and the maximum value 150% of the most
likely value. This most likely value is the time-between-stops as deined by the user with the interface provided.
The model could be developed in any commercially available discrete simu-lation software (Cremonese and Livoratti, 2012); however, for this study, the model was developed in the Arena (by Rockwell Automation) software. The input data were grouped into tabs in the Microsoft Excel file (Interface), where each tab describes a unique project system block. The model design allows for continuous improvement and expansion, as well as the inclusion of additional process steps as necessary.
The model input data template for the equipment includes the low of the material, equipment capacities, planned and unplanned maintenance. The typical
resulting data stored are annual through-out, maximum, minimum and average stock levels, and equipment utilization. All the data of stockpiles, bins and the necessary information along the simulated time are stored.
The model components are devel-oped to allow various combinations or a coniguration of equipment with no cus-tomizing effort at the programming level. When the model is set to run, the Visual Basic for Applications (VBA) obtains the input data from the MS Excel interface and inserts it into the Arena model, mak-ing the links between the system blocks, such as the Primary Crushing to Stock-pile 1 and so on. This interface allows an engineer with minimal experience in simulation software to set the input data and run the model.
3. Results and discussion
An iron ore project was used as a test case. There are 230 pieces of equipment at the process plant, made up of 100 catego-ries. There are 47 pieces of process equip-ment (Crushers, Screens, Spiral Classiier, Thickeners, Mills, Cyclones, etc,) and 53 of
material handling equipment (Belt Convey-ors, Bins, Piles, Stacker-Reclaimers, etc).
The FEL2 study data were used as input to the model. It is therefore possible to analyze whether the model output gives useful information to the
FEL 3 stage of the project.
The Run of Mine (ROM) ore is 7 million tons per annum (Mtpa), and the production time and average capacity deined by the project team are shown in Table 1.
Area Production time (hours/year) Plant average capacity (t/h) Primary Crusher System 5400 1400
Process Plant 6400 1200
Table 1 Production time and average plant capacity.
The static analysis shows that the Primary Crusher System achieves 540 0 h /year x 140 0 t / h = 7.56 Mtpa; and the Process Plant achieves 6400 h/year x 1200 = 7.68 Mtpa. Both are at least 8% higher than the necessary
7 Mtpa.
However, the production times of 5400 and 6400 hours/year are based on the experience of the project team and do not account for all the system interrela-tions and interdependencies. It does not
consider the sizes of stockpiles, bins and unexpected failures of the system, etc.
The ‘High-level Dynamic Analy-sis Approach’ considers the statistical variation occurring in the process, such as equipment through capacity variation,
Dennis Travagini Cremonese et al.
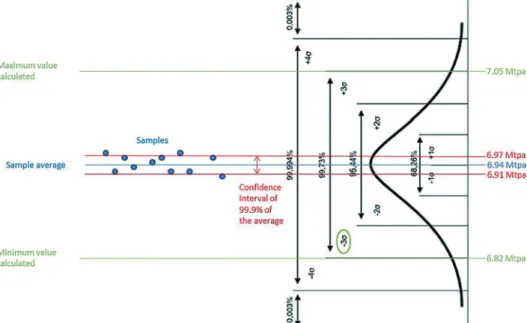
unexpected failures, bin levels, etc. Considering planned and un-planned maintenance, equipment data, and storage capacity, the model shows that the plant availability and produc-tion time will not be achieved. The ROM ore achieved an average of 6.94 Mtpa. Figure 2 shows that considering a conidence level of 99.9% of the mean, the mean ROM achieved along the year is between 6.91–6.97 Mtpa, which is less than the 7 Mtpa target.
Furthermore, at the 3-sigma level,
99.73% of the years will achieve a ca-pacity of between 6.82–7.05 Mtpa.
For a 7 Mtpa capacity, estimated from team experience, using the same coniguration, the dynamic simulation shows that in some years, the capacity can only be 6.82 Mtpa.
It is therefore evident that capac-ity will not be achieved. The question is: “why this is, and what can be done to achieve it?”
The irst step is to analyze the bin and stockpile utilization over a period.
The intermediate stockpile has a capac-ity of 200 kt and is almost full or com-pletely full after half the simulation time. This shows that the mine and primary crushing area are not the bottleneck.
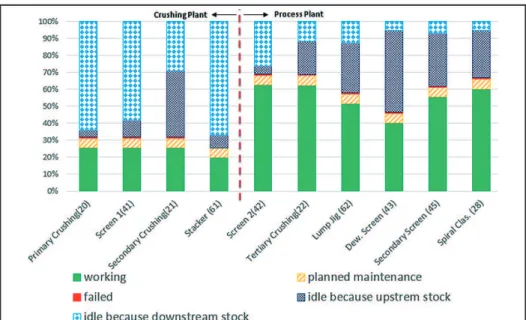
Figure 3 shows the utilization of the main equipment as a percentage of time. The dotted red line represents the separation (battery limit) between the crushing plant and the process plant. The number inside the “(#XXX)” is the block number. Each block is one equip-ment in the model.
Figure 3
Equipment utilization.
Figure 4 shows the storage level of each bin/tank (#189 to #199) and of the
intermediate stockpile (#180) as a percent-age of time. The dotted red line represents
the separation (battery limit) between the crushing plant and the process plant.
Figure 4
Bin and stockpile utilization.
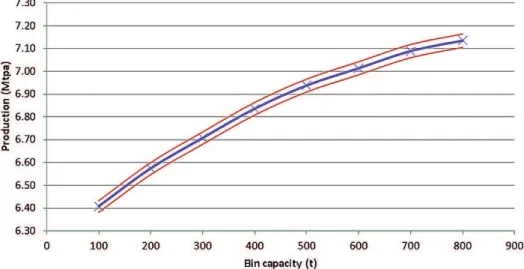
The analysis from Figure 5 shows that the capacity of the process plant was reduced by the dynamic behavior of the equipment. One way to increase the capacity is to enable decoupling of
the equipment and bins.
To test the inluence of bin capac-ity on global availabilcapac-ity, the Screen 2 Bin (#193) and Tertiary Crusher Bin (#194) were made variable from
A high-level dynamic analysis approach for studying global process plant availability and production time in the early stages of mining projects
Figure 5 Production (Mtpa) versus bin capacity (t).
The plant’s mean production ca-pacity is achieved by increasing the bin capacities to 650 t, and is expected to achieve a conidence level of 99%.
This bin capacity change in the FEL 2 stage to achieve the plant
capac-ity is minor compared to the changes that need to be carried out in FEL 3 and project implementation or worse, in plant operation.
In this test case, insuficient bin capacity was discovered in a complete
dynamic simulation model at the end of FEL 3. Discipline engineering, such as Mechanical and Civil, needed to be revised, since the belt conveyor length had to be changed, and the load of the structure was increased.
4. Conclusions
The “High-level Dynamic Analysis Approach” evaluates capacities consider-ing all the system blocks of the project; the results are closer to global availability. The work is carried out with standard information available to the study team in the early stage of the project, but with less engineering effort compared to a detailed dynamic simulation model. Domain ex-pert judgment or the operating staff input on systems or the experience of the user is required to obtain reliable results from this tool. However, it does not require modeling software experience.
Using this approach and based on the system dependability and system dynamics, one can assure that the plant availability is sized to achieve the antici-pated utilization of the systems included in the project. This innovative way of
ensuring the quality of the engineering work can enhance investors’ conidence in the project as the project evolves into the next level. The results also show that evaluating the system as a whole rather than in isolation would drive the values closer to the optimized system. How-ever, the High-level Dynamic Analysis Approach is not meant to be used in the later stages of the project, as it is necessary to simulate the system with more details to optimize the project systems or when more details of the system are available. The approach helps to combine the total project systems and to provide data for sizing the storage systems, instead of in-tuitive sizing based on experience, which may lead to surprises in future phases of the project. This approach can help in the early detection of capacity and utilization
issues of the complete system, and allows corrective action to update the speciic system coniguration and design.
As shown in the test case, the utilization of the High-level Dynamic Analysis Approach in the FEL 2 would lead to deining the bin capacities in the early stages. This would avoid the need of revised discipline engineering, such as Mechanical and Civil, once the belt conveyor length had to be changed and the load of the structure increased. This occurred at the end of FEL 3.
Further work to enhance the model is being undertaken to incorporate related systems, such as water storage require-ments, to make this approach more ef-fective by considering all the systems that inluence the production or sizing in the early stages of the project.
Acknowledgments
We would like to acknowledge sup-port for this project from CAPES, CNPq
and FAPESP (grant #2016/00647-2, São Paulo Research Foundation).
References
ALTIOK, T. Large-scale simulation modeling of ports and waterways: approaches and Challenges. In: WORKSHOP ON GRAND CHALLENGES IN MODELING, SIMULATION AND ANALYSIS FOR HOMELAND SECURITY. Anais...
Wa-shington: US DHS - Science and & Technology Directorate, 2010.
ASBJÖRNSSON, G., HULTHÉN, E., EVERTSSON, M. Modelling and dynamic simulation of gradual performance deterioration of a crushing circuit – Including time dependence and wear. Minerals Engineering, v. 33, p. 17–19, 2012.
Dennis Travagini Cremonese et al.
of dynamic crushing plant behavior with MATLAB/Simulink. Minerals Enginee-ring, v. 43–44, p. 112–120, 2013.
BERGQUIST, B. Traceability in iron ore processing and transports. Minerals Engine-ering, v. 30, p. 44–51, 2012.
BERTON, A. et alii. Ore storage simulation for planning a concentrator expansion.
Minerals Engineering, v. 40, p. 56–66, 2013.
CARDOSO, C.R.O., TELES M.B. Simulação de terminal portuário. In: ENCON-TRO NACIONAL DE ENGENHARIA DE PRODUÇÃO, 17. Anais... Gramado
(RS): ABEPRO, 1997.
CREMONESE, D.T. Desenvolvimento e aplicação de metodologia para estudos de simulação dinâmica na cadeia do minério de ferro. São Paulo: Escola Politécnica,
Universidade de São Paulo, 2014. 157 p. (Master’s Dissertation in Mineral Engi-neering).
CREMONESE, D.T., LIVORATTI, P. Simulation tools: a study of application at the Nouadhibou Port. In: INTERNATIONAL CONFERENCE ON
INTELLI-GENT PROCESSING AND MANUFACTURING OF MATERIALS, 7. Anais...
Foz do Iguaçu (PR): IPMM, 2012.
ERNST & YOUNG. Canadian mining companies focused on cost control, project execution in 2013. Ernst & Young. News Release, 7th Feb 2013. Available at: http://www.newswire.ca/news-releases/canadian-mining-companies-focused-on--cost-control-project-execution-in-2013-ernst--young-511933581.html [Last ac-cessed: 10 March 2016].
GOMES, R. B., DE TOMI, G., ASSIS, P. S. Impact of quality of iron ore lumps on sus-tainainability of mining operations in the Quadrilatero Ferrifero Area. Minerals Engineering, v. 70, p. 201–206, 2015.
JULIÁ, A. F. Desenvolvimento de um modelo de simulação para dimensionamento de um sistema integrado pátio-porto na cadeia do minério de ferro. São Paulo:
Escola Politécnica, Universidade de São Paulo, 2010. 165 p. (Master’s Dissertation in Logistic Systems Engineering).
LE ROUX, J. D. et al. Analysis and validation of a run-of-mine ore grinding mill cir-cuit model for process control. Minerals Engineering, v. 43–44, p. 121–134, 2013.
MILLER, M. J. Stockpiling and reclaiming systems in mill design. SME. SME-AIME
Fall Meeting and Exhibit, Tucson, Arizona, v. 79, p. 326. 1979.
NIKKHAH K, ANDERSON C. Role of simulation software in design and operation of metallurgical plants: a case study. In: SME SME ANNUAL MEETING. Denver Colorado, v. 1, p. 176, 2001.
STANGE W., COOPER B. Value options and lexibility in plant design, metplant - metallurgical plant design and operating strategies. Perth (Australia):
Australa-sian Institute of Mining and Metallurgy, 2008.
VASEBI, A., POULIN, E., HODOUIN, D. Selecting proper uncertainty model for steady-state data reconciliation – Application to mineral and metal processing in-dustries. Minerals Engineering, v. 65, p. 130–144, 2014.