ABSTRACT
Validation of an experimental polyurethane model
for biomechanical studies on implant supported
prosthesis – tension tests
Mariane MIYASHIRO1, Valdey SUEDAM2, Rafael Tobias MORETTI NETO3, Paulo Martins FERREIRA4, José Henrique RUBO4
1- DDS, Bauru School of Dentistry, University of São Paulo, Bauru, SP, Brazil.
2- DDS, MSc, PhD, Department of Prosthodontics, Bauru School of Dentistry, University of São Paulo, Bauru, SP, Brazil. 3- DDS, MSc, PhD student, Department of Prosthodontics, Bauru School of Dentistry, University of São Paulo, Bauru, SP, Brazil.
4- DDS, MSc, PhD, Associate Professor, Department of Prosthodontics, Bauru School of Dentistry, University of São Paulo, Bauru, SP, Brazil.
Corresponding address: Prof. Dr. José Henrique Rubo - Faculdade de Odontologia de Bauru - USP - Departamento de Prótese - Al. Dr. Octávio Pinheiro Brisolla, 9-75 - 17012901 - Bauru - SP - Brasil - e-mail: [email protected]
Received: July 1, 2009 - Modiication: April 27, 2010 - Accepted: May 25, 2010
O
bjectives: The complexity and heterogeneity of human bone, as well as ethical issues, frequently hinder the development of clinical trials. The purpose of this in vitro studywas to determine the modulus of elasticity of a polyurethane isotropic experimental model via tension tests, comparing the results to those reported in the literature for mandibular bone, in order to validate the use of such a model in lieu of mandibular bone in biomechanical studies. Material and Methods: Forty-ive polyurethane test specimens were divided into 3 groups of 15 specimens each, according to the ratio (A/B) of polyurethane reagents (PU-1: 1/0.5, PU-2: 1/1, PU-3: 1/1.5). Results: Tension tests were performed in each experimental group and the modulus of elasticity values found were 192.98 MPa (SD=57.20) for PU-1, 347.90 MPa (SD=109.54) for PU-2 and 304.64 MPa (SD=25.48) for PU-3. Conclusion: The concentration of choice for building the experimental model was 1/1.
Key words: Polyurethanes. Validation studies. Dental implants.
INTRODUCTION
Peri-implant bone resorption has been implicated in the success/failure of osseointegrated implants. Research on the maintenance of osseointegration under forces transmitted by occlusal load is as important as the study of the initial process of bone formation in different implant surfaces2,4,7,21. Oh, et al.18 (2002), in a literature review of the contributing factors to early peri-implant bone loss, pointed to occlusal overload as the most likely cause of this problem. Occlusal overload beyond the threshold of bone homeostasis leads to progressive marginal bone resorption, and eventual osseointegration failure1,14,17,20,22,25.
In order to correlate the forces transmitted by occlusal overload to the degree of bone remodeling in the tissues surrounding osseointegrated implants, the mechanostat theory proposed by
Frost8 (1990) may be used to determine the maximum tension bearable by bone. In his theory, Frost proposes that bone mechanical adaptation is governed by a mechanical strain threshold, which he called the minimum effective strain (MeS). If local strains within the bone are above MeS, the adaptative response occurs, but if they are below that threshold, bone remains stable6.
femoral, mandibular, cortical, cancellous), and even according to the bone site from where the sample is taken. O’Mahony, et al.19 (2000) also observed modulus of elasticity heterogeneity among different mandibular regions.
Based on these indings, Mish, et al.15 (2000) measured the modulus of elasticity of trabecular bone, with and without cortical plates, and concluded that human mandibular trabecular bone presents a signiicantly higher modulus of elasticity in the anterior mandibular region, and that the absence of cortical plates decreases bone modulus of elasticity. Tamatsu, et al.27 (1996), studying the modulus of elasticity of small bone specimens from four dry adult human mandibles, found that elastic properties varied with both site and orientation of the specimen, relecting the complexity of the mandibular bone structure.
Fresh mandibular specimens are inadequate for
in vitro biomechanical studies, as they show great
variability for modulus of elasticity and density and anisotropy. Moreover, fresh mandibular specimens have a natural viscosity that hinders the attachment of strain gauges. Because of these characteristics, the application of artiicial test materials for in vitro biomechanical research has been reported
in the literature3,5,9,10,12,16,24,28 and mathematical models have been developed to simulate the bone remodeling process under mechanical stimulus in implant supported prosthesis13.
In vitro studies require isotropic specimens
with elastic characteristics similar to those found in the target mandibular region. The homogeneity of polyurethane (PU) could favor its use in biomechanical studies of force distribution on implant supported prostheses aimed at establishing correlations between strains generated in the periimplant region and physiological strains as proposed by Frost’s theory. Based on these grounds, the purpose of this study was to validate the use of an experimental polyurethane model in
in vitro biomechanical studies of implant-supported
prostheses.
MATERIAL AND METhODS
Test Specimens
Forty-ive barbell-shaped, polyurethane (Axson; Cergy, France) test specimens (18 mm in length and 3.0 mm in diameter) were used in this study. A 2-part male/female stainless steel (1010/20) mold was used to shape the specimens. Polyurethane specimens were obtained by mixing 2 reagents, A and B (A: Polyol – catalyst and B: Diisocyanate – base). A/B ratio was previously determined in each group. The mixture, still in its viscous form, was injected into the mold with a hypodermic syringe. As soon as hardening was complete, specimens
were removed from the mold, according to the manufacturer’s instructions.
Study groups
Specimens were initially divided into 3 groups of 15 specimens each according to the ratio of polyurethane reagents (A/B, with A: polyol and B: diisocyanate). Following destructive tension testing, some specimens were excluded due to the fact that they failed under considerably low forces, what was attributed to the internal bubbles observed under visual analysis, which could have weakened them. As a result, the number of specimens in each group was PU-1=11, PU-2=14 and PU-3=15.
Testing
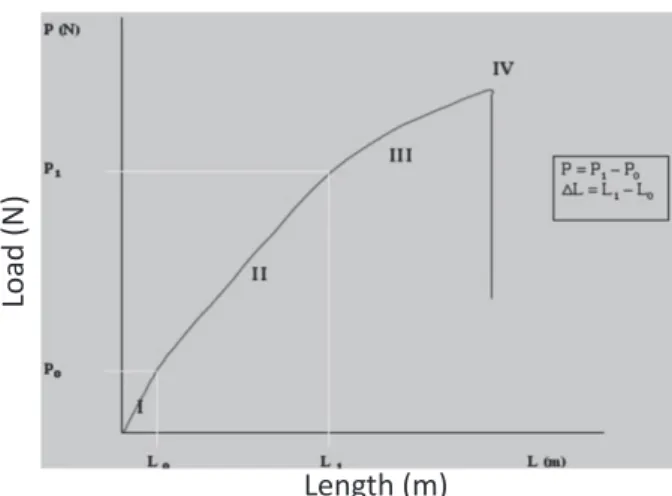
Tension testing was performed for the measurement of the modulus of elasticity in each specimen. Each one of the specimens was ixed to a Kratos Universal Testing Machine (Model K - 2000 MP; Kratos equipamentos Industriais Ltda., São Paulo, SP, Brazil), where a 500 Kgf load cell pulled the specimen at a crosshead speed of 1.0 mm/min until rupture occurred (Figure 1). The modulus of elasticity was then calculated based on the generated tension and the linear deformation of the specimen. Generated tension was calculated as follows:
Where: T = tension [Pa]; P = load [N];
So = original cross section [m].
Deformation was calculated as follows:
Where: ε = deformation [nondimensional]; Lo = reference initial length (load zero) [m]; L = reference length for load P [m].
Finally, the modulus of elasticity was calculated as follows:
Where: Ε = modulus of elasticity [Pa].
The values of P and ΔL were calculated according to the elastic deformation of the specimen, represented in Figure 2 by the curve of generated tension versus linear deformation during the
ANOVA was performed to determine statistically significant differences among groups, and the Tukey’s test (p≤0.05) was used to show differences among groups.
RESULTS
Figure 3 shows the modulus of elasticity (MPa) of each specimen, means and standard deviation for each group. Maximum and minimum tension forces (Fmax/Fmin) were 323.59 N/110.97 N for PU-1; 384.77 N/233.87 N for PU-2; and 384.91 N/263.86 N for PU-3. Mean modulus of elasticity values and standard deviation for groups PU-1, PU-2 and PU-3.
There was statistically signiicant difference between groups 1 and 2, as well as between groups 1 and 3 (p<0.05; ANOVA, Tukey’s test). No statistically signiicant difference was observed between groups 2 and 3 (p>0.05).
DISCUSSION
Using PU to build test specimens presented dificulties related to material viscosity, bubble formation, the time length of the process and the heterogeneity found in some reagent mixtures. The greatest dificulties were encountered in PU-1 as it was more prone to bubble formation than the other groups. In addition, the altered reagent proportion caused some of the specimens of this group to be rubbery. On the other hand, polymerization time was shorter for PU-1 than for the other groups, indicating a greater amount of catalyst in its composition. These facts together contributed to the lowest mean modulus of elasticity 192.98 MPa (SD=57.20) seen in PU- 1, as compared to PU-2 and PU-3. The best handling conditions were found in PU-2 whose polymerization time was adequate and similar to that in PU-1, whereas the modulus of elasticity was higher 347.90 MPa (SD=109.54) than in PU-1. PU-3 showed the longest curing time, probably because this group had the smallest amount of catalyst in the mixture, which contributed for dificulties to build the specimens. The tests in PU-3 showed mean modulus of elasticity and standard deviation values of 304.64 MPa (SD=25.48). The broad variance of measured values of modulus of elasticity in group PU2 compared to groups PU 1 and PU 3 can be explained by the low concentration of base (diisocyanate - PU-1) and low concentration of catalyst (polyol - PU-3) resulting in a more brittle material.
Mean modulus of elasticity varied according to the concentration of PU reagents. ANOVA showed difference among groups and the Tukey’s test showed no statistically signiicant difference between PU-2 and PU-3. Therefore, the increase in the B reagent concentration cannot be said to Figure 1- Polyurethane bell-shaped specimen positioned
for tension tests
Figure 3- Modulus of elasticity means values (MPa) according to mixture concentration. Bars represent standard deviation. *p<0.05 as compared to groups 2 and 3.
Figure 2- Tension x deformation curve of polyurethane specimen subjected to tension test
Lo
ad
(
N
)
be directly proportional to the increase in modulus of elasticity.
The modulus of elasticity is extremely important to the validation of the material used in the building of experimental models as the comparison between the values obtained with those reported in the literature for mandibular bone is the basis for building reproducible, easy-to-handle models of isotropic characteristics.
O’Mahony, et al.19 (2000) found different modulus of elasticity in different mandibular regions, which ranged from 47 to 2.283 MPa. Mish, et al.15 (2000) reported modulus of elasticity values ranging from 24.9 to 240.0 MPa, with a mean value of 96.2 MPa (SD=40.6) in the mandibular trabecular bone with its cortical plates. Without cortical plates, elasticity ranged from 3.5 to 125.6 MPa, with a mean value of 56.0 MPa (SD=29.6).
Tamatsu, et al.27 (1996), observed that the modulus of elasticity of the mandible varied with bone site and orientation, and that the mandibular bone presented anisotropic characteristics, relecting the complexity of its structure. In their study, these authors obtained the following modulus of elasticity values: 16.9 GPa (SD=2.7); 15.4 GPa (SD=4.9) and 13.9 GPa (SD=3.4) in the lower, medium and upper incisal regions, respectively; 19.4 GPa (SD=2.5), 18.8 GPa (SD=3.5) and 12.6 GPa (SD=4.2) in the lower, medium and upper premolar region, respectively. Scwartz-Dabney and Dechow23 (2002), also noted a great variation in modulus of elasticity according to the mandibular region, conirming the bone heterogeneity seen by Katz11 (1995) and O’Mahony, et al.19 (2000).
By comparing the modulus of elasticity values observed in this study to those reported in the literature for mandibular bone, where modulus of elasticity is known to be greatly variable, the mean modulus of elasticity values reported here are consistent with those found in the literature15,19. According to the highest value of modulus of elasticity found in group PU 2 and based on handling conditions, where the group PU-3 showed the longest curing time what contributed for dificulties to build the specimens, PU-2 was the group chosen for the building of the experimental model. Altering the reagents ratio also resulted in excessively rubbery specimens. The reagent ratio suggested by the manufacturer (1:1) proved to be the most adequate for obtaining the target modulus of elasticity. Thus, the use of this material in further experimental studies was considered adequate.
CONCLUSIONS
Based on the results obtained under the proposed conditions, it seems valid to conclude that:
1. Modulus of elasticity values varied according to reagent concentration in the test groups studied. However, the increase in concentration of reagent B was not directly proportional to the increase in modulus of elasticity;
2. The 1:1 concentration for reagents A and B (PU-2) showed the best mechanical and handling characteristics, and should be the concentration of choice for building of experimental models to be used in upcoming biomechanical studies of implant-supported prostheses in the mandibular region.
ACKNOWLEDgEMENTS
This investigation was supported by the State of São Paulo Research Foundation/ FAPESP (grant# 2006/57414-8).
REFERENCES
1- Adell R, Lekholm U, Rockler B, Brånemark PI. A 15-year study
of osseointegrated implants in the treatment of the edentulous jaw. Int J Oral Surg. 1981;10:387-416.
2- Barros RRM, Novaes AB Jr, Papalexiou V, Souza SLS, Taba M Jr, Palioto DB, et al. effect of biofunctionalized implant surface on osseointegration: a histomorphometric study in dogs. Braz Dent J. 2006;20:91-8.
3- Bredbrenner TL, Haug RH. Substitutes for human cadaveric
bone in maxillofacial rigid ixation research. Oral Surg Oral Med
Oral Pathol Oral Radiol endod. 2000;90:574-80.
4- Brentel AS, Vasconcellos LMR, Oliveira MV, Graça MLA, Vasconcellos LGO, Cairo CAA, et al. Histomorphometric analysis of pure titanium implants with porous surface versus rough surface. J Appl Oral Sci. 2006;14:213-8.
5- Chong AC, Miller F, Buxton M, Friis eA. Fracture toughness
and fatigue crack propagation rate of short iber reinforced
epoxy composites for analogue cortical bone. J Biomech eng. 2007;129:487-93.
6- Duncan RL, Turner CH. Mechanotransduction and the functional response of bone to mechanical strain. Calcif Tissue Int. 1995;57:344-58.
7- Faeda RS, Tavares HS, Sartori R, Guastaldi AC, Marcantonio e
Jr. Evaluation of titanium implants with surface modiication by
laser beam: biomechanical study in rabbit tibias. Braz Oral Res. 2009;23:137-43.
8- Frost HM. Skeletal structural adaptations to mechanical usage (SATMU): 1. Redeining Wolff’s law: the bone modeling problem.
Anat Rec. 1990;226:403-13.
9- Grant JA, Bishop NE, Götzen N, Sprecher C, Honl M, Morlock M. Artiicial composite bone as a model of human trabecular bone:
the implant-bone interface. J Biomech. 2007;40:1158-64. 10- Holst S, Geiselhoeringer H, Wichmann M, Holst AI. The effect of provisional restoration type on micromovement of implants. J Prosthet Dent. 2008;100:173-82.
11- Katz JL. Mechanics of hard tissue. In: Brozino JD, ed. The
biomedical engineering handbook. Boca Raton: CRC Press; 1995.
p. 273-89.
12- Kroon FH, Mathisson M, Cordey JR, Rahn BA. The use of miniplates in mandibular fractures. An in vitro study. J Craniomaxillofac Surg. 1991;19:199-204.
13- Li J, Li H, Shi L, Fok ASL, Ucer C, Devlin H, et al. A mathematical
14- Lindquist LW, Rockler B, Carlsson GE. Bone resorption around ixtures in edentulous patients treated with mandibular ixed
tissue-integrated prostheses. J Prosthet Dent. 1998;59:59-63. 15- Misch Ce, Qu Z, Bidez MW. Mechanical properties of trabecular bone in the human mandible: implications for dental implant treatment planning and surgical placement. J Oral Maxillofac Surg. 1999;57:700-6.
16- Moretti RT Neto, Hiramatsu DA, Suedam V, Conti PCR, Rubo JH. Validation of an experimental polyurethane model for biomechanical studies on implant - supported prosthesis - compression tests. J Appl Oral Sci. 2011;19:47-51.
17- Naert I, Quirynen M, Van Steenberghe D, Darius P. A study of
589 consecutive implants supporting complete ixed prostheses.
Part II: Prosthetic aspects. J Prosthet Dent. 1992;68:949-56. 18- Oh TJ, Yoon J, Misch Ce, Wang HL. The causes of early implant bone loss: myth or science? J Periodontol. 2002;73:322-33. 19- O’Mahony AM, Williams JL, Katz JO, Spencer P. Anisotropic elastic properties of cancellous bone from a human edentulous mandible. Clin Oral Implants Res. 2000;11:415-21
20- Richter eJ. Basic biomechanics of dental implants in prosthetic dentistry. J Prosthet Dent. 1989;61:602-9.
21- Santiago AS, Santos eA, Sader MS, Santiago MF, Soares G A. Response of osteoblastic cells to titanium submitted to three different surface treatments. Braz Oral Res. 2005;19;203-8.
22- Sanz M, Alandez J, Lazaro P, Calvo JL, Quirynen M, van Steenberghe D. Histo-pathologic characteristics of peri-implant
soft tissues in Brånemark implants with 2 distinct clinical and
radiological patterns. A histometric and ultrastructural study. Clin Oral Implants Res. 1991;2:128-34.
23- Schwartz-Dabney CL, Dechow PC. edentulation alters material properties of cortical bone in the human mandible. J Dent Res. 2002;81:613-7.
24- Shetty V, McBrearty D, Fourney M, Caputo AA. Fracture line
stability as a function of the internal ixation system: an in vitro
comparison using a mandibular angle fracture model. J Oral Maxillofac Surg. 1995;53:791-801
25- Smith DC. Dental implants: materials and design considerations. Int J Prosthodont. 1993;6:106-17.
26- Spiekermann H. Biomechanics. In: ______. Color atlas of dental medicine implantology. New York: Thieme Medical
Publishers; 1995.
27- Tamatsu Y, Kaimoto K, Arai M, Ide Y. Properties of the elastic
modulus from buccal compact bone of human mandible. Bull Tokyo
Dent Coll. 1996;37:93-101.
28- Van Sickels JE, Peterson GP, Holms S, Haug RH. An in vitro
comparison of an adjustable bone ixation system. J Oral Maxillofac