ABSTRACT:Introduction: The quality control of data entry in computerized questionnaires is an important step in the validation of new instruments. The study assessed the consistency of recorded weight and height on the Food Intake and Physical Activity of School Children (Web-CAAFE) between repeated measures and against directly measured data. Methods: Students from the 2nd to the 5th grade (n = 390) had their weight and height directly measured and then illed out the Web-CAAFE. A subsample (n = 92) illed out the Web-CAAFE twice, three hours apart. The analysis included hierarchical linear regression, mixed linear regression model, to evaluate the bias, and intraclass correlation coeicient (ICC), to assess consistency. Univariate linear regression assessed the efect of gender, reading/writing performance, and computer/internet use and possession on residuals of ixed and random efects. Results: The Web-CAAFE showed high values of ICC between repeated measures (body weight = 0.996, height = 0.937, body mass index – BMI = 0.972), and regarding the checked measures (body weight = 0.962, height = 0.882, BMI = 0.828). The diference between means of body weight, height, and BMI directly measured and recorded was 208 g, -2 mm, and 0.238 kg/m², respectively, indicating slight BMI underestimation due to underestimation of weight and overestimation of height. This trend was related to body weight and age. Conclusion: Height and weight data entered in the Web-CAAFE by children were highly correlated with direct measurements and with the repeated entry. The bias found was similar to validation studies of self-reported weight and height in comparison to direct measurements.
Keywords: Surveys and questionnaires. Body height. Body weight. Body mass index. Child. Adolescent.
Consistency evaluation of values of weight,
height, and body mass index in Food Intake
and Physical Activity of School Children:
the quality control of data entry in the
computerized system
Avaliação da consistência de valores de peso, altura e índice de massa
corporal no questionário Consumo Alimentar e Atividade Física de
Escolares: o controle da qualidade da entrada de dados no sistema
Gilmar Mercês de JesusI, Maria Alice Altenburg de AssisI,II, Emil KupekIII, Lizziane Andrade DiasIV
IPostgraduate Program in Physical Education, Universidade Federal de Santa Catarina – Florianópolis (SC), Brazil. IIPostgraduate Program in Nutrition, Universidade Federal de Santa Catarina – Florianópolis (SC), Brazil. IIIPostgraduate Program in Collective Health, Universidade Federal de Santa Catarina – Florianópolis (SC), Brazil. IVLaboratory of Physical Activity, Universidade Estadual de Feira de Santana – Feira de Santana (BA), Brazil.
Corresponding author: Gilmar Mercês de Jesus. Travessa Pássaro Vermelho, 32, Santa Mônica II, CEP: 44082-320, Feira de Santana, BA, Brasil. E-mail: [email protected]
Conlict of interests: nothing to declare – Financial support: Fundação de Amparo à Pesquisa do Estado da Bahia (FAPESB). Edital n. 028/2012, Grant: PES0049/2013, request n. 1238/2013. Brazilian Ministry of Health (Departamento de Ciência, Tecnologia e Insumos Estratégico – DECIT). Brazilian Ministry of Science, Technology and Innovation (Conselho Nacional de Desenvolvimento
Cientíico e Tecnológico [CNPq]), Grant: 308352/2016-5 (MAAA).
INTRODUCTION
The search for the development of questionnaires applied by using computers in epi-demiological studies is growing. There are instruments addressed to children and adoles-cents, aiming at assessing dietary intake1-5, physical activity6, or multiple constructs,
includ-ing nutritional status based on body mass index (BMI)7-10.
Computerized questionnaires have advantages in comparison to traditional printed tools, since they reduce the costs with the reproduction of forms, allow obtaining data from large samples in several locations, simultaneously11 and reduce potential biases12 by eliminating
the data entry stage13 and by providing more anonymity and privacy for the participant14,15.
The Questionnaire Dietary Intake and Physical Activity of Students (Web-CAAFE)16
was carried out for a monitoring system focusing on dietary intake and physical activities of students aged from 7 to 10 years.
In studies conducted with students from the public elementary school in Florianópolis, Santa Catarina, the Web-CAAFE had proper usability17 and validity in the evaluation of food
intake18, and it also proved to be a viable instrument to evaluate the fulillment of nutritional
recommendations19. The instrument also had the proper validity and reproducibility in the
evaluation of physical activities and dietary intake of students in Feira de Santana, Bahia20,21.
In the conception of Web-CAAFE, ields to ill out weight and height were also included to provide data to calculate the BMI and the diagnosis of nutritional status, by age and sex, using the reference curve from the World Health Organization (WHO)22. Aiming at
providing information for a monitoring system, the recommendation is that the quality RESUMO:Introdução: O controle da qualidade da entrada de dados em questionários informatizados é etapa importante na validação de novos instrumentos. Este estudo avaliou a consistência de registros de peso e altura no Questionário Consumo Alimentar e Atividade Física de Escolares (Web-CAAFE) entre aplicações repetidas e contra dados aferidos. Métodos: Escolares do 2º ao 5º ano (n= 390) tiveram peso e altura aferidos e, em seguida, preencheram o Web-CAAFE. Uma subamostra (n = 92) completou o instrumento 2 vezes com 3 horas de intervalo. A análise incluiu regressão linear hierárquica, modelo misto de regressão linear, para avaliar vieses, e coeiciente de correlação intraclasse (CCI), para veriicar a consistência dos dados. A regressão linear univariada avaliou o impacto de: sexo; desempenho na leitura/escrita; e posse e uso de computador/internet nos resíduos dos efeitos ixos e randômicos. Resultados: O Web-CAAFE exibiu valores altos de CCI entre aplicações repetidas (peso = 0,996, altura = 0,937, índice de massa corporal – IMC = 0,972) e com relação às medidas aferidas (peso = 0,962, altura = 0,882, IMC = 0,828). A diferença entre as médias de peso, altura e IMC aferidos e digitados foi de 208 g, -2 mm e 0,238 kg/m², respectivamente, indicando leve subestimação do IMC em razão da subestimação do peso e da superestimação da altura. Essa tendência relacionou-se ao peso corporal e à idade. Conclusão: Peso e altura digitados no Web-CAAFE foram fortemente correlacionados com medidas diretas e digitação repetida. O viés encontrado foi similar ao relatado em estudos de validação de instrumentos de autorrelato de peso e altura comparados a medidas diretas.
control regarding weight and height data be conducted by trained professionals, both in entry and in data13.
The objective of this study was to assess the consistency of weight and height data typed in Web-CAAFE, as well as the calculated BMI, compared to the measures checked and the repeated entry, providing information for quality control in data entry in the com-puterized system.
METHODS
The study to assess the validity and reproducibility of Web-CAAFE among students from elementary school was conducted from May to August, 2014, in the city of Feira de Santana, Bahia (Northeast Brazil). The study included the validation of the physical activ-ity20 and dietary intake sections21 in Web-CAAFE. This study focused on assessing the
qual-ity of entry of weight and height data. The consistency of data was evaluated according to age, sex, academic performance and use of computers and internet.
This was a convenience sample, composed of all students from the 2nd to the 5th grades in a public, part-time school, from the state education network from Feira de Santana, Bahia. The school was selected because it met the research protocol (being a public elementary school, having the approval of the director and professors to collaborate in the evaluation of performance of the students, having a computer room, with access to internet and school meals). The target-audience to use the Web-CAAFE included students from the 2nd to the
5th grades of elementary school, because the instrument was built based on the cognitive
skills of children aged between seven and ten years. In the school selected the age group of the students from the 2nd to the 5th grades ranges from 7 to 15 years.
Sample size was calculated based on a previous study conducted to validate the instru-ment of dietary intake for students23, with the following parameters: expected sensitivity of
75%, margin of error of 20% for the lower limit of this sensitivity, and prevalence of 50%, therefore obtaining a minimum sample of 124 children24.
The study was approved by the Research Ethics Committee of Universidade Estadual de Feira de Santana – CEP/UEFS (CAAE: 19499913.3.0000.0053). Participants obtained a written authorization from the tutors and signed an assent form.
In the irst stage of the study, all participants took anthropometric measurements and illed out the Web-CAAFE questionnaire afterwards. The anthropometric measurements were taken in the computer room of the school, before the children used the computers, and the height and body weight values were written on a label attached to the class diary of the students for consultation (without decimal points for body weight and only two for height).
was allowed during the illing out of the Web-CAAFE. The interval in-between the repeated entry was three hours, considering the part time stay at school of approximately ive hours in each shift (morning or afternoon). Therefore, two direct measurements of weight and height were taken, and there were three entries of these measurements in Web-CAAFE for each child participating in both stages of the study.
The sub-sample size was calculated based on the mean (33.3 kg) and on the standard deviation (SD) of weight (11.46) in the validity stage. The sample was calculated consider-ing the followconsider-ing parameters:
1. Expectation of the mean diference between stages equal to zero, and SD equal to 11.46 kg;
2. Sampling size suicient to detect a 10% diference in the initial mean (33.3 kg) or more.
The errors of types I (alpha) and II (beta) were established at 0.05 and 0.20, respectively. Therefore, the sample size for the second stage of the study was 93.
The anthropometric measurements were taken by a team of trained researchers, according to the standards in the literature25. Body weight was measured with a digital scale (accuracy
of 100 g and maximum capacity of 180 kg, from Wiso®, model Ultra Slim W801). To
mea-sure height, a portable, collapsible stadiometer was used, with platform and square (213 cm of maximum height and 0.1 cm of accuracy, from Altura Exata®). The weight was measured
while the children were barefoot, and wearing the school uniform. Height was measured with the children barefoot, without ornaments on the head and aligned with the Frankfurt plan.
The performance at reading and writing was assessed by the teacher in charge of the class, using a form containing a hedonic scale (0 = very poor, 1 = poor, 2 = regular, 3 = good, 4 = excellent). The criteria established for the evaluation of the reading were: luency, intonation in paragraphs, punctuation, recognition of the theme and explicit information in the text, and identiication of linguistic marks that show the speaker and interlocutor. For the performance in writing, the following items was considered: knowledge of small and capital letters, distinction of homorganic consonants, domain of the writing of the works inluenced by the characteristics of speech, application of orthography rules regarding the signaling of nasalization, and ability to write the words, sentences and texts correctly.
To assess the experience of each child with the use of computers and the internet, the following questions were asked:
1. “Do you have a computer (or notebook) in your house?”; 2. “Is there internet in the computer (or notebook) in your house?”; 3. “Do you use the computer (or notebook) in your house?”.
STATISTICAL ANALYSIS
values, the relative frequency of categorical variables (%) and the hierarchic linear regression with three levels: student, method (measures and entry in Web-CAAFE) and repetition for both methods. To assess the biases in the records of Web-CAAFE, besides the ixed efect for the diference between methods, the regression considered the repetition of measure-ments and their interaction with methods such as random efects.
The intraclass correlation coeicient (ICC) was calculated to assess the reliability of the records in repeated entries in Web-CAAFE, and to assess the correlation between the mea-surements and the records in the questionnaire.
The ICC for the reliability of the records in repeated entries was calculated as the squared root of the variance between the direct measurement and the entry in Web-CAAFE, divided by adding that to the variance between the repeated entries. The ICC between methods was determined with the same numerator, however, excluding the variance between the subjects of the previous denominator. The model parameters, including the standard error and the corresponding 95% conidence interval (95%CI) values, were estimated by the max-imum-likelihood estimation.
The analyses excluded the records of body weight and height from Web-CAAFE as follows: 1. When it exceeded the amplitude of the measured values; and
2. When it was outside the interval of X _
± 3 SD of the population of reference22 for
each age range of the students, since in a routine application of Web-CAAFE, like a monitoring system, there might not be measurements to assess its accuracy.
This procedure was adopted to eliminate the extreme, biologically implausible values of body weight and height, which would afect the analyses.
The impact of gender, school performance in reading/writing, possession and use of a computer/internet at home on the residuals of the ixed and random efects was assessed by using the univariate linear regression, after the hierarchical analysis. The relationship between the residue and the outcomes – body weight and height registered in Web-CAAFE and BMI calculated based on these measurements – was assessed graphically. The hypoth-esis tests were conducted considering the signiicance of p = 5%.
The body weight and height values measured in the two stages among the children in the sub-sample were compared with the Student’s t-test.
RESULTS
Of a total of 453 students, 416 accepted to participate and received an authorization from parents or tutors. Of these, 390 completed the irst stage of the study [mean age (years)
± DP = 9.53 ± 1.53 years; 50.3% girls]. The sub-sample of the second stage resulted on valid
data of 92 students (9.39 ± 1.41 years; 51.1% girls).
in relation to the school year (11 – 15 years of age). Very poor and poor performances were observed in reading and writing in 28.2 and 24.2% of the sample, respectively. Almost 2/3 of the students claimed to own a computer in their household, however, less than half of
Table 1. Characteristics of the participants.
Variable Sample
† Sub-sample‡
n (%) n (%)
Age (years)
7 72 (18.4) 17 (18.5)
8 73 (18.6) 18 (19.6)
9 97 (24.7) 27 (29.3)
10 96 (24.5) 19 (20.7)
11 32 (8.2) 7 (7.6)
12 – 15 22 (5.6) 4 (4.3)
Reading performancea
Very poor 14 (9.2) 2 (5.4)
Poor 29 (19.0) 5 (13.5)
Regular 52 (34.0) 14 (37.8)
Good 39 (25.5) 12 (32.4)
Excellent 19 (12.4) 4 (10.8)
Writing performancea
Very poor 14 (9.2) 3 (8.1)
Poor 23 (15.0) 4 (10.8)
Regular 46 (30.1) 10 (27.0)
Good 57 (37.3) 15 (40.5)
Excellent 13 (8.5) 5 (13.5)
Having a computer in the householdb
No 138 (36.5) 31 (34.4)
Yes 240 (63.5) 59 (65.6)
Accessing the internet in the householdb
No 174 (46.0) 43 (47.8)
Yes 204 (54.0) 47 (52.2)
Using a computer in the householdb
No 168 (44.4) 34 (37.8)
Yes 210 (55.6) 56 (62.2)
†Sample in the irst stage (n = 390); ‡Sub-sample in the second stage (n = 92); an = 153 in the irst stage and n = 37 in
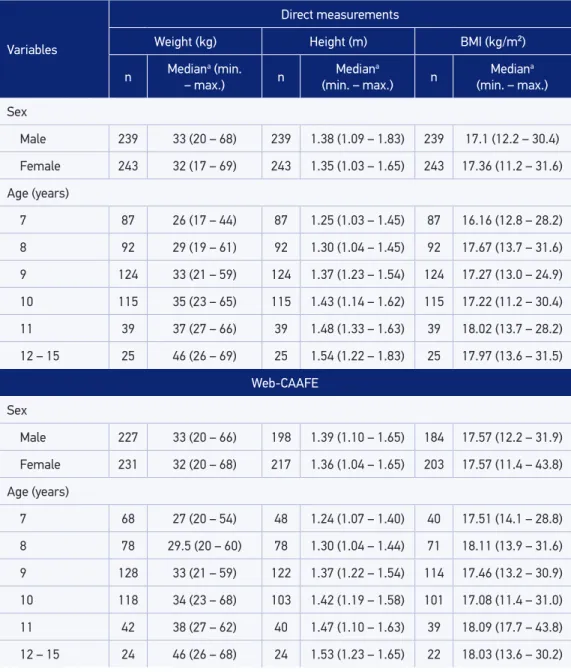
them used it or had access to the internet (Table 1). The characteristics of the sub-sample were similar. Table 2 presents median, maximum and minimum body weight, height and BMI values of the students, according to sex and age.
Table 2. Values of body weight, height and body mass index measured and registered by students in the Questionnaire Dietary Intake and Physical Activity of Students.
Variables
Direct measurements
Weight (kg) Height (m) BMI (kg/m²)
n Mediana (min.
– max.) n
Mediana
(min. – max.) n
Mediana
(min. – max.)
Sex
Male 239 33 (20 – 68) 239 1.38 (1.09 – 1.83) 239 17.1 (12.2 – 30.4)
Female 243 32 (17 – 69) 243 1.35 (1.03 – 1.65) 243 17.36 (11.2 – 31.6)
Age (years)
7 87 26 (17 – 44) 87 1.25 (1.03 – 1.45) 87 16.16 (12.8 – 28.2)
8 92 29 (19 – 61) 92 1.30 (1.04 – 1.45) 92 17.67 (13.7 – 31.6)
9 124 33 (21 – 59) 124 1.37 (1.23 – 1.54) 124 17.27 (13.0 – 24.9)
10 115 35 (23 – 65) 115 1.43 (1.14 – 1.62) 115 17.22 (11.2 – 30.4)
11 39 37 (27 – 66) 39 1.48 (1.33 – 1.63) 39 18.02 (13.7 – 28.2)
12 – 15 25 46 (26 – 69) 25 1.54 (1.22 – 1.83) 25 17.97 (13.6 – 31.5)
Web-CAAFE
Sex
Male 227 33 (20 – 66) 198 1.39 (1.10 – 1.65) 184 17.57 (12.2 – 31.9)
Female 231 32 (20 – 68) 217 1.36 (1.04 – 1.65) 203 17.57 (11.4 – 43.8)
Age (years)
7 68 27 (20 – 54) 48 1.24 (1.07 – 1.40) 40 17.51 (14.1 – 28.8)
8 78 29.5 (20 – 60) 78 1.30 (1.04 – 1.44) 71 18.11 (13.9 – 31.6)
9 128 33 (21 – 59) 122 1.37 (1.22 – 1.54) 114 17.46 (13.2 – 30.9)
10 118 34 (23 – 68) 103 1.42 (1.19 – 1.58) 101 17.08 (11.4 – 31.0)
11 42 38 (27 – 62) 40 1.47 (1.10 – 1.63) 39 18.09 (17.7 – 43.8)
12 – 15 24 46 (26 – 68) 24 1.53 (1.23 – 1.65) 22 18.03 (13.6 – 30.2)
BMI: body mass index; Web-CAAFE: Questionnaire Dietary Intake and Physical Activity of Students; aValues
There was no diference in the measurements of body weight (-1.01 kg; 95%CI -3.52 – 1.49) and height (-6.07 cm; 95%CI -2.88 – 0.31) measured between the two stages of the study for the children in the sub-sample.
Body weight and height typed in the Web-CAAFE and the resulted BMI presented ICC values higher than 0.90 for reliability (Table 3). The correlation between records in Web-CAAFE and the measurements was strong, higher for body weight (> 0.95) and a bit lower for height and BMI (> 0.80).
The diference between the mean values (bias) of body weight recorded in Web-CAAFE and measured was 677 g, that is, 2.0% (95%CI -0.5 – 4.6%) of the measurement (Table 3). The corresponding diferences for height and BMI were 1 cm or 0.73% (95%CI 0.0 – 1.46%) and 0.39 kg/m² or 2.11% (95%CI -0.11 – 4.49%), respectively.
However, these diferences did not include the random variation of the measurements, which needs to be considered to calculate the bias attributed to Web-CAAFE. With such an adjustment, the mean bias in body weight, height and BMI records made in Web-CAAFE decreased to 208 g, 2 mm and 0.238 kg/m², respectively. Therefore, the biases attributed to Web-CAAFE indicated a mild underestimation of BMI as a consequence of the underestimation of body weight and the overestimation of height. The residuals of the random efects among students represented a summary efect of the factors that inluenced the records of body weight in Web-CAAFE, but were absent from the model. The residuals were related with the students’ age and with the quartiles of body weight and height typed into the Web-CAAFE (data not shown), and BMI resulting from these measurements. The negative residue meant the underestimation of BMI resulting from the typed weight and height, and the positive results indicated the overestimation.
The students with lower BMI indexes calculated based on measured weight and height (1st quartile) were prone to the underestimation of BMI, based on the data registered in
Table 3. Consistency of values of body weight, height and body mass index recorded in the Questionnaire Dietary Intake and Physical Activity of Students.
Parameters Outcomes
Weight (kg) Height (m) BMI (kg/m²)
Measured values 33.84 (32.99; 34.69) 1.36 (1.35; 1.37) 18.05 (17.73; 18.36)
Values registered in
Web-CAAFE 34.53 (33.68; 35.39) 1.37 (1.36; 1.38) 18.44 (18.03; 18.86)
Biasa attributable to the
record in Web-CAAFE 0.208 (-0.032; 0.449) -0.002 (-0.006; 0.002) 0.238 (0.028; 0.448)
ICCb (applications
repeated in Web-CAAFE) 0.996 0.937 0.972
ICCb (records in Web-CAAFE versus
measurements)
0.962 0.882 0.828
BMI: Body Mass Index; Web-CAAFE: Questionnaire Dietary Intake and Physical Activity of Students; aDiference
Web-CAAFE, whereas those with higher values (4th quartile) had a strong tendency of
over-estimation, especially the older ones (Figure 1).
There was no statistically signiicant association between random residuals and gen-der, school performance of reading/writing, possession and use of a computer, as well as internet in the household, in the univariate linear regression analyses (details not shown).
The correlation between the residuals of the ixed efects and the outcome variables was close to zero (details not shown). The same relation was observed with the variables of the univariate analyses. However, the residuals of the random efects presented a linear relation with the outcome variables and the age of the children.
The magnitude and variation of random residuals increased with the second entry in Web-CAAFE, and reduced in the third entry. For weight, the means were -24 g (95%CI -33 – -16 g), 96 g (95%CI 66 – 127 g) and 10 g (95%CI -14 – 35 g), respectively, in the irst, second and third entries. For height, the means obtained in these entries were, in the same order, -2 mm (95%CI -3 – 1 mm), 6 mm (95%CI 4 – 8 mm) and 2 mm (95%CI -1 – 6 mm).
Figure 1. Relationship between the residuals and body mass index records in the Questionnaire Dietary Intake and Physical Activity of Students, according to age and body mass index quartiles based on measured body weight and height.
≥ 12 years
8,000
6,000
4,000
2,000
0,000
-2,000
-4,000
Q1
Q2 Q3
Q4
7 years 8 years
9 years 10 years
DISCUSSION
Records of body weight and height in Web-CAAFE, as well as the resulted BMI based on these measurements, showed strong correlation between the repeated entries and in compari-son with the measurements, being higher for body weight and a bit lower for height and BMI. There was a minor bias attributed to Web-CAAFE, of 2%, in the measured value for body weight, and less than 1% for height, having an impact of 2.11% on BMI. This inding led to a mild underestimation of BMI as a consequence of the underestimation of body weight and the overestimation of height.
Direct comparisons between these results and those of similar studies are not possible to be made, considering the signiicant methodological diferences. This study assessed the quality of entry in the system, and not the validity and reproducibility of the report of weight and height, since the anthropometric measurements were conirmed before illing out the Web-CAAFE and the students were instructed to check the values written down in the class diary, unlike what has been done in other studies7,26-32.
Considering that, curiously, the tendency of BMI underestimation found, such as the efect of the underestimation of body weight and the overestimation of height, was similar to that reported in validations of the self-report of body weight and height among students27,29-31.
In this study, students with diiculties to read and write were also beneitted by the access to the measurements, since the awareness of their own anthropometric measures improves the quality of the report25. Still, there was a tendency to underestimate body weight and
overestimate height. That indicated that other factors explain these biases – besides gender, age, skills to read and write, experience with the use of computers and the internet, or the knowledge of their own measurements – such as body dissatisfaction, and factors associ-ated with bias in the report of body weight among adolescents33.
The reduction of the magnitude and the variation of random efects for values of weight and height, observed between the second and third application of Web-CAAFE, can be owed to three factors:
1. the short interval of time (three hours), beneitting memory;
2. the learning of the processes required to ill out the questionnaire; and
3. the reduction in the children’s reactiveness, considering their previous experience with the instrument.
common that overweight or obesity lead to the underestimation of real weight and BMI based on self-report. This peculiar result suggests the realization of new studies, with population-based samples, in order to reach more consistent conclusions. The random residues among the eval-uated subjects were not associated with the possession and use of computers/internet in the household, nor with school performance in reading/writing. This indicates that the lack of pre-vious experience with computers and/or the fact that the child is not completely literate did not change the quality of the weight and height recorded in the analyzed sample. However, this result should be interpreted carefully, because it may have been inluenced by the limited number of subjects with information available about school performance, or by the use of a learning assessment tool built especially for this study, which has not been previously validated.
The use of a computer in the household did not change the accuracy and the reliabil-ity of the dietary intake report in Web-CAAFE among the students in Feira de Santana21.
On the other hand, the performance in the report of dietary intake and physical activities in Web-CAAFE was worse among the students in Florianópolis, Santa Catarina, who did not own a computer and were attending the 2nd and 3rd grades17,18, that is, they are supposedly
less capable of reading and writing, when compared to students in the 4th and 5th grades.
The record of weight and height in Web-CAAFE requires the participants to type in only two numerical digits for weight and three for height, without worrying about separating integer and decimal values, using the comma or the dot, since this is done by the system. Besides, an animated avatar instructs the person, using audio and text presented in balloons. Together, these facilities require little ability to read and write, and can explain partially the results obtained.
In a previous study about the usability of Web-CAAFE17, it was observed that, in the irst
part of the questionnaire (including weight and height data, name of the child and mother or tutor), the students presented a higher mean score of errors related with inconsistent responses, especially regarding: answering that the questionnaire had been illed out before it actually was; and entry the name incorrectly. Errors in data entry about weight and height were less frequent.
A potential limitation of the current study is that the absence of information about the school performance of about 2/3 of the students analyzed may have camoulaged the rela-tionship between the ability to read and write and the quality of the record in Web-CAAFE. Besides, the convenience sample restricts the generalization of the results found.
CONCLUSION
The weight and height records in Web-CAAFE showed strong correlation with the mea-surements assessed and the repeated entries. The bias attributable to Web-CAAFE was minor, but indicated a mild underestimation of BMI, due to the overestimation of health and the underestimation of body weight. As a measure to control the quality of data entry in the system for further studies, and for the monitoring of students at the population level, it is possible to adopt a warning informing the record of weight and height values that are bio-logically implausible, with subsequent evaluation of the validity and reproducibility of these values, without the individuals disposing of the information about their measurements.
1. Diep CS, Hingle M, Chen TA, Dadabhoy HR, Beltran A, Baranowski J, et al. The automated self-administered 24-hour dietary recall for children, 2012 version, for youth aged 9 to 11 years: a validation study. J Acad Nutr Diet 2015; 115(10): 1591-8. DOI: 10.1016/j.jand.2015.02.021 2. Medin AC, Astrup H, Kåsin BM, Andersen LF.
Evaluation of a web-based food record for children using direct unobtrusive lunch observations: a validation study. J Med Internet Res 2015; 17(12): e273. DOI: 10.2196/jmir.5031
3. Carvalho MA, Baranowski T, Foster E, Santos O, Cardoso B, Rito A, Pereira MJ. Validation of the Portuguese self-administered computerised 24-hour dietary recall among second-, third and fourth-grade children. J Hum Nutr Diet 2015; 28(6): 666-74. DOI: 10.1111/jhn.12280
4. Biltoft-Jensen A, Bysted A, Trolle E, Christensen T, Knuthsen P, Damsgaard CT, et al. Evaluation of web-based dietary assessment software for children: comparing reported fruit, juice and vegetable intakes with plasma carotenoid concentration and school lunch observations. Br J Nutr 2013; 110(1): 186-95. DOI: 10.1017/S0007114512004746
5. Foster E, Hawkins A, Delve J, Adamson AJ. Reducing the cost of dietary assessment: self-completed recall and analysis of nutrition for use with children (SCRAN24). J Hum Nutr Diet 2014; 27(1): 26-35. DOI: 10.1111/ jhn.12108
6. Legnani E, Legnani RF, Rech CR, Guimarães RF, Campos W. Instrumentos eletrônicos para avaliar atividade física em crianças: uma revisão sistemática. Motricidade 2013; 9(4): 90-9.
7. Storey KE, McCargar LJ. Reliability and validity of Web-SPAN, a web-based method for assessing
weight status, diet and physical activity in youth. J Hum Nutr Diet 2012; 25(1): 59-68. DOI: 10.1111/j.1365-277X.2011.01181.x
8. Bae J, Joung H, Kim JY, Kwon KN, Kim Y, Park SW. Validity of self-reported height, weight, and body mass index of the Korea youth risk behavior web-based survey questionnaire. J Prev Med Public Health 2010; 43(5): 396-402. DOI: 10.3961/jpmph.2010.43.5.396 9. McLure SA, Reilly JJ, Crooks S, Summerbell CD.
Development and evaluation of a novel computer-based tool for assessing physical activity levels in schoolchildren. Pediatr Exerc Sci 2009; 21(4): 506-19. 10. Moore HJ, Ells LJ, McLure SA, Crooks S, Cumbor
D, Summerbell CD, et al. The development and evaluation of a novel computer program to assess previous-day dietary and physical activity behaviours in school children: the synchronised nutrition and activity program (SNAP). Br J Nutr 2008; 99(6): 1266-74. DOI: 10.1017/S0007114507862428
11. Rhodes S, Bowie D, Hergnrather K. Collecting behavioural data using the world wide web: considerations for researchers. J Epidemiol Community Health 2003; 57(1): 68-73. DOI: 10.1136/jech.57.1.68 12. Larson MR. Social desirability and self-reported weight
and height. Int J Obes 2000; 24(5): 663-5.
15. Weeb PM, Zimet GD, Fortenberry JD, Blythe MJ. Comparability of a computer-assisted versus written method for collecting health behavior information from adolescent patients. J Adolesc Health 1999; 24(6): 383-8. 16. Costa FF. Desenvolvimento e avaliação de um
questionário baseado na web para avaliar o consumo alimentar e a atividade física de escolares [tese]. Florianópolis - SC: Universidade Federal de Santa Catarina; 2013.
17. Costa FF, Schmoelz CP, Davies VF, Di Pietro PF, Kupek E, Assis MA.Assessment of diet and physical activity of brazilian schoolchildren: usability testing of a web-based questionnaire. JMIR Res Protoc 2013; 2(2): e31. DOI: 10.2196/resprot.2646
18. Davies VF, Kupek E, Assis MA, Natal S, Di Pietro PF, Baranowski T. Validation of a web-based questionnaire to assess the dietary intake of Brazilian children aged 7 – 10 years. J Hum Nutr Diet 2015; 28(1): 93-102. DOI: 10.1111/jhn.12262
19. Kupek E, Assis MA, Bellisle F, Lobo AS. Validity of WebCAAFE questionnaire for assessment of schoolchildren’s dietary compliance with Brazilian Food Guidelines. Public Health Nutr 2016; 19(13): 2347-56. DOI: 10.1017/S1368980016000732 20. Jesus GM, Assis MA, Kupek E, Dias LA. Avaliação
da atividade física de escolares com um questionário via internet. Rev Bras Med Esporte 2016; 22(4): 261-6. DOI: 10.1590/1517-869220162204157067 21. Jesus GM, Assis MA, Kupek E. Validade e
reprodutibilidade de questionário baseado na internet (Web-CAAFE) para avaliação do consumo alimentar de escolares de 7 a 15 anos. Cad Saúde Pública 2017; 33(5): e00163016. DOI: 10.1590/0102-311X00163016 22. Onis M, Onyango AW, Borghi E, Siyam A, Nishida C,
Siekmann J. Development of a WHO growth reference for school-aged children and adolescents. Bull World Health Organ 2007; 85(9): 660-7.
23. Assis MA, Benedet J, Kerpel R, Vasconcelos FA, Di Pietro PF, Kupek E. Validação da terceira versão do questionário alimentar do dia anterior (QUADA-3) para escolares de 6 a 11 anos. Cad Saúde Pública 2009; 25(8): 1816-26. DOI: 10.1590/S0102-311X2009000800018 24. Flahault A, Cadilhac M, Thomas G. Sample size
calculation should be performed for design accuracy in diagnostic test studies. J Clin Epidemiol 2005; 58(8): 859-62. DOI: 10.1016/j.jclinepi.2004.12.009
25. Lohman TG, Roche AF, Martorell R. Anthropometric standardization reference manual. Champaign: Human Kinetics Books; 1988. 177 p.
26. Baile JI, González-Calderón M. Precisión del índice de masa corporal, obtenido a partir de datos de peso y altura autoinformados en una muestra infantil española. Nutr Hosp 2014; 29(4): 829-31. DOI: 10.3305/ nh.2014.29.4.7143
27. Seghers J, Claessens AL. Bias in self-reported height and weight in preadolescents. J Pediatr 2010; 157(6): 911-6. DOI: 10.1016/j.jpeds.2010.06.038
28. Beck J, Schaefer CA, Nace H, Stefen AD, Nigg C, Brink L, et al. Accuracy of self-reported height and weight in children aged 6 to 11 years. Prev Chronic Dis 2012; 9: e119.
29. Tokmakidis SP, Christodoulos AD, Mantzouranis NI. Validity of self-reported anthropometric values used to assess body mass index and estimate obesity in Greek school children. J Adolesc Health 2007; 40(4): 305-10. DOI: 10.1016/j.jadohealth.2006.10.001 30. Abalkhail BA, Shawky S, Soliman NK. Validity of
self-reported weight and height among Saudi school children and adolescents. Saudi Med J 2002; 23(7): 831-7. 31. Lee B, Chung SJ, Lee SK, Yoon J. Validation of
self-reported height and weight in fifth-grade Korean children. Nutr Res Pract 2013; 7(4): 326-9. DOI: 10.4162/nrp.2013.7.4.326
32. Chan NP, Choi KC, Nelson EA, Sung RY, Chan JC, Kong AP. Self-reported body weight and height: an assessment tool for identifying children with overweight/obesity status and cardiometabolic risk factors clustering. Matern Child Health J 2013; 17(2): 282-91. DOI: 10.1007/s10995-012-0972-4
33. Elgar FJ, Roberts C, Tudor-Smith C, Moore L. Validity of self-reported height and weight and predictors of bias in adolescents. J Adolesc Health 2005; 37(5): 371-5. DOI: 10.1016/j.jadohealth.2004.07.014
34. Sherry B, Jeferds ME, Grummer-Strawn LM. Accuracy of adolescent self-report of height and weight in assessing overweight status: a literature review. Arch Pediatr Adolesc Med 2007; 161(12): 1154-61. DOI: 10.1001/archpedi.161.12.1154
Received on: 09/28/2016