29
Evaluation And Characterization Of Trace Metals
Contamination In The Surface Sediment Using
Pollution Load Index (PLI) And Geo-Accumulation
Index (Igeo) Of Ona River, Western Nigeria
Andem, Andem Bassey, Okorafor, Kalu Ama, Oku, Ene Esien, Ugwumba, Adiaha AlexAbstract: Evaluation and Characterization of Trace Metal Contamination in the Surface Sediment Using Pollution Load Index (PLI) and Geo-accumulation Index (Igeo) Index of Ona River was conducted for six months. From the result of this study, the mean values of lead ranged between 0.004 mg/kg and 0.330 mg/kg, while the mean iron was highest (5.05 mg/kg) in station 4 and lowest (2.26 mg/kg) in station 5. The mean chromium value ranged from 0.007 mg/kg (station 1 and 2) to 0.021 mg/kg (station 3 and 4). The mean copper was highest (3.97 mg/kg) in station 1 and lowest (0.008 mg/kg) in station 2. Analysis of variance (ANOVA) revealed the same trend in spatial variation of these heavy metals. There was a significant difference (P< 0.05) in lead, chromium and copper among the study sampling stations and insignificant difference (P>0.05) in iron among the study sampling station. The PLI values recorded for all the stations were below 1. Thus the sediment of the study stretch that Ona River is unpolluted. The Igeo values for chromium and iron fall in class ‘0’ in all the five sampling stations, indicating that
there is no pollution from these metals in the Ona River sediments, lead fall in class ‘3’ in station 4indicating moderately to heavily contaminated condition and class ‘0’in station 1, 2, 3 and 5 and copper fall in class ‘3’ in station 4 and 5, in class ‘6’ in station 3 indicating extremely contaminated condition. The Igeo values were consistent with those derived for PLI. All trace metals had concentrations below the EPA regulatory limits for sediment except iron. From the results of this study, sediment quality reflects the impacts of anthropogenic activities on quality of the river. However, the continuous build-up of the metal contaminants can be checked if relevant government agencies ensure strict compliant of industrial standards which stipulate treatment of industrial waste before discharging such contaminated effluents/wastes into River. Therefore, perpetual assessment is highly recommended to minimize the potential health hazards of the people who surely depend on the River water for fishing and agricultural purposes.
Keywords: Trace metals, Sediment, Characterization, Ona River, Nigeria
———————————————————— 1INTRODUCTION
Sediment is the loose sand, clay, silt and other soil particles that is deposited at the bottom of body of water or accumulated at other depositional sites. Sediments can emanate from the erosion of bedrocks and soil or from decomposition of plants and animals [1]. Heavy metals are among the most common environmental pollutants and their occurrence in waters and biota indicate the presence of natural or anthropogenic sources.
The existence of trace metals in aquatic environments has led to serious concerns about their influence on plant and animal life [2]. Geo-accumulation index is the quantitative measure of the degree of pollution in aquatic sediment. It consists of seven grades ranging from unpolluted to very extremely polluted and the Pollution load index is a quick tool in order to compare the pollution status of different places, the pollution load index is use to determine the pollution severity and its variation along the different sample stations [3]. Heavy metals are chemical elements having atomic weights between 63.546 and 200.590 and a specific gravity that is 5 times greater than that of water. They exist in water in colloidal, particulate and dissolved phases with their occurrence in water bodies being either of natural origin (e.g. eroded minerals within sediments, leaching of ore deposits and volcanism extruded products) or of anthropogenic origin(that is; solid waste disposal, industrial or domestic effluents, harbour channel dredging) [4]. Furthermore, trace toxic metals are not easily removed from the environment nor are readily detoxified or degraded by metabolic activities in the body of the organism, thereby resulting in accumulation [5, 6]. Research has been that, they are no studies on sedimentology and geochemistry of the sediment in Ona River. To provide baseline information and also enlightened the people of the area about the immediate effect of the water body studied, they is need to determine trace metals pollution in sediment using pollution load index and Geo-accumulation Index. This study reports the levels of __________________________
Andem, Andem Bassey is currently a lecturer in the University of Calabar, Calabar, Department of Zoology and Environmental Biology, Cross River State, Nigeria PH:+2348060168081.
E-mail: [email protected]
Okorafor Kalu Ama is currently a lecturer in the University of Calabar, Calabar, Department of Zoology and Environmental Biology, Cross River State, Nigeria.
Oku, Eneawan Esien is a professor of Applied Entomology in the University of Calabar, Calabar, Department of Zoology and Environmental Biology, Cross River State, Nigeria.
30 trace metals in sediments quality of Ona River with the aim of
investigating the pollution status of the River.
2
MATERIALS AND METHODS2.1 Description of Study Area
The city of Ibadan in south western Nigeria (7°23, N, 3°5' E) is the largest urban centre in Africa south of the Sahara [7]. It is characterized by a West African Monsoon type of climate with hot dusty dry season (Nov-April) and cold, humid rainy season (May-October) [8]. Ona River has a length of 55km2 an area of 81.0km2 and it flows through the low density western part of Ibadan [8]. The river flows in a north-south direction from its source at Ido Local Government Area) where it is dammed and also flows through Apata Genga (Ibadan south-west Local Government Area) to Oluyole Local Government (Fig.1). Companies located along this river include 7up Nigeria Plc, Zartech, Sumal and Interpac a paper mill industry (not in operation). Channelled effluents from these industries are connected by a network of canals channelled directly into Ona River [9]. Ona River receives allochtonous input of organic matter from the surrounding vegetation, derived through run-offs from the surface of the soil. The water body receives a lot of wastes ranging from industrial, agricultural and domestic sources, which apart from adversely affecting the normal hydrochemistry of the river, also decreases its channel capacity at various points, and this has been largely responsible for flood disasters in the river [8]. The river is often used as a ‘latrine’ which makes it offensive to sight and smell and therefore not good as a natural resource [9].
Figure 1: Map of Ibadan South-West Local Government Area Showing Ona River and Sampling Station ( 1-5), (Map of
Nigeria and Oyo State Inserted).
2.1.1 Sampling stations
Five sampling stations (1-5) were chosen along the river course. The co-ordinates of the sampling stations were taken using GPS and approximate distances of the stations were calculated, each station was 500m apart from the other.
Station 1
This was the upstream station used as the control point because it was assumed to be unpolluted since waste/effluent was not discharge into the station. It is located at Moore plantation, Apata, Ibadan (Lat: N70 22’ 4.81”; Lon: E30 50’
09.84”). In this station, there is no emergent vegetation. Bank side vegetation is predominantly melina tree (Commelina nodiflora). This river bed is basically coarse sand, granite and fast flowing, it appears undisturbed, unaltered and clean.
Station 2
Station 2 is the discharge point, located at Odo-Ona (Lat: N70
22’ 4.85”; Lon: E30 50’ 09.88”). It receives effluents from human household and wastes disposal. This is the station, in which the river at this point flows along a concrete channelled of about 5m wide and through some residential area. The river here is dirty brown and fast moving, speed was not uniform because of midstream eddies and side water friction with debris and land.
Station 3
Station 3 receives effluents from Sumal Food Company, that produces biscuit and sweet and it is located along Ring Road between Ibadan northwest and southwest L.G.A (Lat: N70 21’
4.89”; Lon: E30 51’ 09.92”).
The river at this station is also insensitively used for disposal of domestic waste. The river is also very dirty, contaminated with heavily disposed domestic, solid wastes and other activities are like washing of cars, clothes, bathing and human defecation.
Station 4
Station 4 receives effluents from 7up Bottling Company and also some industrial wastes around. It is located at 7up Road, Ring Road, Ibadan (Lat: N70 20’ 4.92”; Lon: E30 51’ 09.96”). This station; is probably turbid due to the effect of discharged effluents. The vegetation is composed mainly of trees which form a partial shade over this station, with Panicum maximum (Guinea grass) and some banana cover. The substratum is muddy.
Station 5
Station 5 receives effluents from Adeoyo State Hospital and also some industrial wastes around. It is located at Elewura area towards Fodasis Hospital, Ring Road, Ibadan (Lat: N70
19’ 4.96”; Lon: E3051’ 09.99”). In this station, the vegetation is composed mainly of trees which form a shade over this station and the substratum is also muddy.
2.2 Collection of Samples
Sediment samples were collected into a polythene bag using hand trowel from five different sample stations from the month of October 2010 to the month of March 2011 between 9am to 3pm, then the sediment sample were taken to the Department of Agronomy, University of Ibadan for analysis.
2.3. Metal Analysis
31 were allowed to cool in a water bath for 30 min and the
concentrations of the Chromium (Cr), Iron (Fe), Lead (Pb) and Copper (Cu) were determined using Perkin-Elmer Analyst 300 Atomic Absorption spectrophotometer (AAS).
2.4. Statistical Analysis
Data obtained were subjected to Descriptive Statistics for mean, range, standard error and charts. Inter station comparisons were carried out to test for significant differences in the trace metals conditions using analysis of variance (ANOVA). To determine the magnitude of heavy metal contamination in the sediment, the Pollution Load Index (PLI) and geo-accumulation Index (Igeo) were employed. Pollution load index (PLI) for each station were evaluated using the procedure of [11]
PLI = (CF1 x CF2 x CF3x...CFn) 1/n (1)
Where: n = number of metals
CF = contamination factor
CF = Metal concentration in sediment/Background values of the metal
PLI is a potent tool in heavy metal pollution evaluation. According to [12] the PLI value > 1 indicates pollution
PLI value < 1 indicates no pollution.
The geo-accumulation index (Igeo) values will be calculated for the different metals using the equation of [13]
Igeo = log2 (Cn/1.5Bn) (2)
Where;
Cn = measured concentration of element n in the sediments
Bn = geochemical background for the element n
[13] Proposed seven classes of the geo- accumulation index.
Class 0 = Igeo <0 (practically uncontaminated)
Class 1= 0 < Igeo < 1 (uncontaminated to moderately contaminated)
Class 2 = 1 < Igeo < 2 (moderately contaminated)
Class 3 = 2 < Igeo < 3 (moderately to heavily contaminated)
Class 4 = 3 < Igeo < 4 (heavily contaminated)
Class 5 = 4 < Igeo < 5 (heavily to extremely contaminated)
Class 6 = 5 < Igeo (extremely contaminated).
Class 6 is an open class and comprises all values of the index higher than Class 5. The elemental concentrations in Class 6 may be hundred fold greater than the geo-chemical background value. In these computations, certified value or the world average concentration of Cr (192 mg/kg), Fe (45.5 mg/kg), Cu (101.7 mg/kg), Pb (146 mg/kg), reported for world
shale [14] were considered as the background values.
3. RESULTS
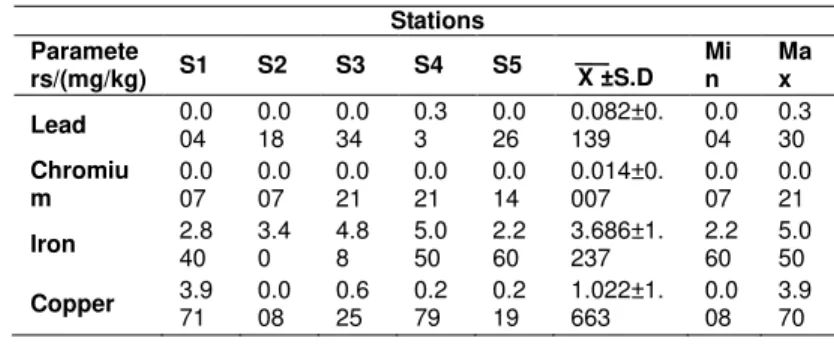
Table 1 shows the summary of the mean concentrations for the metals of sediments at the study stations, Table 2 shows the Calculated F-values of one way analysis of variance measured in Ona River and Table 3. Summary of Pollution Load Index (PLI) and Geo-accumulation Index (Igeo) on Sediment Quality of Ona River. The heavy metals determined in this study include lead, chromium, iron and copper. Spatial variations in their mean values are shown in Figure 3. The mean values of lead ranged between 0.004 mg/kg and 0.330 mg/kg, while the mean iron was highest (5.05 mg/kg) in station 4 and lowest (2.26 mg/kg) in station 5. The mean chromium value ranged from 0.007 mg/kg (station 1 and 2) to 0.021 mg/kg (station 3 and 4). The mean copper was highest (3.97 mg/kg) in station 1 and lowest (0.008 mg/kg) in station 2. Analysis of variance (ANOVA) revealed the same trend in spatial variation of these heavy metals (Table 2). There was a significant difference (P< 0.05) in lead, chromium and copper among the study sampling stations and insignificant difference (P>0.05) in iron among the study sampling station (Table 2).
TABLE 1
SUMMARY OF TRACE METALS ON THE SURFACE SEDIMENT OF ONA RIVER
Stations Paramete
rs/(mg/kg) S1 S2 S3 S4 S5 X ±S.D
Mi n
Ma x
Lead 0.0
04 0.0 18 0.0 34 0.3 3 0.0 26 0.082±0. 139 0.0 04 0.3 30 Chromiu m 0.0 07 0.0 07 0.0 21 0.0 21 0.0 14 0.014±0. 007 0.0 07 0.0 21
Iron 2.8
40 3.4 0 4.8 8 5.0 50 2.2 60 3.686±1. 237 2.2 60 5.0 50
Copper 3.9
71 0.0 08 0.6 25 0.2 79 0.2 19 1.022±1. 663 0.0 08 3.9 70 TABLE 2
CALCULATED F - VALUES OF ONE WAY ANALYSIS OF VARIANCE MEASURED IN ONA RIVER
Parameters F F-critical P-value Inferences
Lead(mg/kg) 27.332 5.987 0.002 P<0.05 Chromium(mg/kg) 29.135 5.987 0.002 P<0.05 Iron(mg/kg) 0.185 5.987 0.682 P>0.05 Copper(mg/kg) 23.901 5.987 0.003 P<0.05
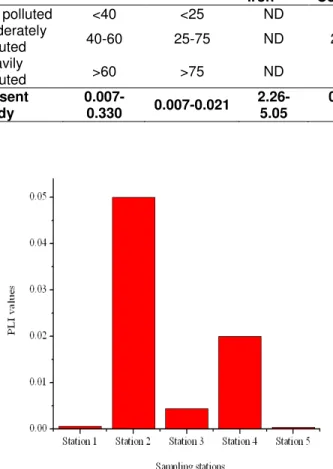
The Pollution Load Index (PLI) was calculated for each of the study stations according to the methods of Tomlinson et al. (1980). A PLI value of > 1 signifies pollution, while PLI value < 1 indicates no pollution. The PLI values recorded for all the stations were below 1 (Table 3 and Figure 2). Thus the sediment of the study stretch of Ona River is unpolluted. The calculated Igeo values are presented in Table 3 and the variations are shown graphically (Figure 3). It is evident from the figure that the Igeo values for chromium and iron fall in
class ‘0’ in all the five sampling stations, indicating that there is
no pollution from these metals in the Ona River sediments,
lead fall in class ‘3’ in station 4 and class ‘0’in station 1, 2, 3 and 5 and copper fall in class ‘3’ in station 4 and 5, in class ‘6’
32 derived for PLI. All traces metals had concentrations below the
EPA regulatory limits for sediment except for iron which was detectable (Table 4).
TABLE 3
SUMMARY OF POLLUTION LOAD INDEX (PLI) AND GEO-ACCUMULATION INDEX (IGEO) ON SURFACE SEDIMENT
OF ONA RIVER
STATIONS
S1 S2 S3 S4 S5
PLI 0.0005
6 0.050
0.004
3 0.020 0.00033 Geo-accumulation Index (Igeo)
Lead(mg/kg) 0.027 0.12 0.23 2.26 0.18
Chromium(mg/
kg) 0.036 0.036 0.11 0.11 0.07
Iron(mg/kg) 0.062 0.06 0.11 0.11 0.049
Copper(mg/kg) 0.039 0.078 6.15 2.92 2.15
TABLE 4
EPA TRACES METAL GUIDELINE FOR SEDIMENT
Trace metals (mg/kg)
EPA Limit Lead Chromium Iron
Copper Not polluted <40 <25 ND <25 Moderately
polluted 40-60 25-75 ND 25-50
Heavily
polluted >60 >75 ND >50
Present study
0.007-0.330 0.007-0.021
2.26-5.05
0.088-3.97
Figure 2: Spatial varations in the PLI values
Figure 3: Spatial varations in the Igeo values
4. DISCUSSION
33 for all stations indicating unpolluted and the Igeo values for
chromium and iron fall in class ‘0’ in all the five sampling stations, indicating that there is no pollution from these metals
in the Ona River sediments, lead fall in class ‘3’ in station 4
indicating moderately to heavily contaminated condition in
these stations and class ‘0’in station 1, 2, 3 and 5 indicating practically uncontaminated condition in these stations and
copper fall in class ‘3’ in station 4 and 5 also indicating
moderately to heavily contaminated condition in these stations
, in class ‘6’ in station 3 indicating extremely contaminated condition. These results were corroborated by the fact that the values of trace metals in the sediments were below the EPA guidelines for sediment, an indication that the sediment of the Ona River was polluted in some areas around the River and unpolluted in some areas also around the River by trace metals. The level of these metals in the environment has increased tremendously as a result of anthropogenic activities. The implication of this is that these trace metals pose risk of contamination to the sediments of the River.
5. CONCLUSION
Ona River is one of the major Rivers in Oyo State; local communities used this River for fishing and agricultural activities. From the results of this study, the evaluation and characterization of sediment quality reflects the impacts of anthropogenic activities on quality of the river. However, the continuous build-up of the metal contaminants can be checked if relevant government agencies ensure strict compliant of industrial standards which stipulate treatment of industrial waste before discharging such contaminated effluents/wastes into River. Therefore, perpetual assessment is highly recommended to minimize the potential health hazards of the people who surely depend on the River water for fishing and agricultural purposes.
Acknowledgment
The authors sincerely thank Department of Agronomy, Faculty of Agricultural Science, University of Ibadan, Nigeria for providing laboratory facilities for the success of this study.
References
[1] Akpan, I. O and Thompson, E. A. (2013).Assessment of Heavy Metal Contamination of Sediments along the Cross River Channel in Cross River State, Nigeria. Journal of Environmental Science, 2(25): 20-28.
[2] Iwuoha, G. N., Osuji, L. C., and Horsfall, M. Jnr. (2012). Index Model Analysis Approach to Heavy Metal Pollution Assessment in Sediments of Nworie and Otamiri Rivers in Imo State of Nigeria. Research Journal of Chemical Sciences, 2(8):1-8.
[3] Adel, M.R, Yaaroub, F. A, Abd-Al-Husain, N. A and Mustafa, N. (2011).Using Pollution Load index(PLI) and Geo-accumulation Index(Igeo) for the Assessment of Heavy Metals Pollution in Tigris River Sediment in Baghdad Region, Journal of Al-Nahraim University, 14(4):108-114.
[4] Momodu, M. A and Anyakora, C. A. (2010). Heavy Metal Contamination of Ground Water (The Surulere Case Study), Research Journal on Environmental and Earth Sciences, 2(1): 39-43.
[5] Ayejuyo, O.O., Tovide, O.O., and Moronkola, B.O. (2009). Heavy metal distribution in Crab (Callinectes amnicola) living on the shore of Ojo Rivers, Lagos Nigeria. Environmentalist, 29 (2):33-36.
[6] Boran, M and Altinok, I. (2010). A Review of heavy metals in water, sediment and living organisms in the Black Sea. Turkish Journal of Fisheries and Aquatic Sciences, 10: 565-572.
[7] Areola, O. (1994). The spatial growth of Ibadan city and its impact on the rural hinterland. In M.O. Filani, F.O. Akintola and C.O. Ikporukpo, (eds.). Ibadan Region. Rex Charles, Ibadan. 98-106pp.
[8] Akin-Oriola, A. G. (2003). Zooplankton association and environmental factors in Ogunpa and Ona rivers, Nigeria. Review biological tropica. 51 (2): 7pp.
[9] Andem, A. B., Udofia, U., Okorafor, K. A., Okete, J. A and Ugwumba, A.A.A. (2012). A study on some physical and chemical characteristics of Ona River, Apata, Ibadan South-west, Oyo State, Nigeria. European Journal of Zoological Research, 1(2):37-46.
[10] APHA (2005). Standard methods for the examination of water and waste water. 16th Edition. Washington DC, 1041-1195pp.
[11] Tomlinson, D. C., Wilson, J. G., Harris, C. R., and Jeffrey, D. W. (1980). Problems in the assessment of heavy metal levels in estuaries and the formation of a pollution index. Helgol. Wiss. Meeresunters, 33:566-575.
[12] Chakravarty, I. M., and Patgiri, A. D. (2009). Metal Pollution Assessment in Sediments of the Dikrong River, N.E. India. J Hum Ecol, 27(1):63-67.
[13] Muller, G (1969) Index of geo-accumulation in the sediments of the Rhine River. Geological Journal, 2: 108-118.
[14] Rubio, B., Nombela, M. A and Vilas, F. (2000). Geochemistry of major and trace elements in sediments of the Ria de Vigo (NW Spain): an assessment of metal pollution. Marine pollution bulletin, 40(11):968-980.
[15] Onyari, M. J., Muohi, A. W., Omondi, G., and Mavuti, K. M. (2003). Heavy metals in sediments from Makupa and Port-Reitz Creek systems. Kenyan Coast Environ. Int. 28(7):639-647.
[16] Ogbeibu, A. E., Omoigberale, M. O., Ezenwa, I. M., Eziza, J. O and Igwe, J. O. (2014). Using Pollution Load Index and Geo-accumulation Index for the Assessment of Heavy Metal Pollution and Sediment Quality of the Benin River, Nigeria. Natural Environment, 2(1):1-9.
34 Nigeria. Journal of Environmental Chemistry and
Ecotoxicology. 2(9):131-140.
[18] Majolade, A. O., Osibanjo, O. Yusuf, K. A and Olowu, R. A. (2012). Trace metals distribution and contamination in the surface sediment of Roro Bay in Lagos, Nigeria. Chemistry Journal, 2(2):69-78.
[19] Olomukoro, J. O., and Azubuike, C. N. (2009). Heavy Metals and Macroinvertebrate communities in bottom sediment of Ekpan Creek, Warri, Nigeria. Jordan Journal of Biological Sciences, 2(1):1-8.
[20] Momodu, M. A and Anyakora, C. A. (2010). Heavy Metal Contamination of Ground Water (The Surulere Case Study), Research Journal on Environmental and Earth Sciences, 2(1): 39-43.