Rev Bras Med Esporte _ Vol. 11, Nº 2 – Mar/Abr, 2005
139e
1. Post-graduation Program in Collective Health – Social Medicine Institute– UERJ. Physical Activity and Health Promotion Laboratory – LABSAU/ UERJ. UniverCidade – Sports and Health School – Physical Education and Physiotherapy Courses. Petrópolis Catholic University (UCP). 2. Physical Activity and Health Promotion Laboratory – LABSAU/UERJ.
UniverCidade – Sports and Health School – Physical Education Course. 3. Department of Applied Physiology and Kinesiology – University of
Flor-ida.
Received in 28/10/04. 2nd version received in 27/12/04. Approved in 11/3/05. Correspondence to: Geraldo de Albuquerque Maranhão Neto, Rua Cândi-do Benício, 1.201/502B, Jacarepaguá – 21321-802 – Rio de Janeiro, RJ. E-mail: [email protected]
Reliability between reported and measured weight
and height, and influence of physical activity history on
individuals who search for supervised practice of exercises
Geraldo Albuquerque Maranhão Neto1, Marcos Doederlein Polito2 and Vitor Agnew Lira3
O
RIGINALA
RTICLEKey words: Epidemiology. Evaluation. Health. BMI. ENGLISH VERSION
ABSTRACT
The objective of this study was to verify the reliability between self-reported and measured weight, height and body mass index values, as well as the influence of the physical activity history on 328 individuals, 200 women (39 ± 11 years) and 128 men (35 ± 10 years) who search for the supervised practice of exercises. All in-dividuals underwent functional evaluation that recorded self-report-ed and measurself-report-ed weight and height values. The individuals were also classified as active (those who exercised three times a week or more), a low active (those who exercised from one to two times a week), and inactive (those who did not exercise), according to the physical activity history in the last three months previously to the evaluation. The data obtained through the calculation of the intraclass correlation coefficient showed high reliability between variables reported in men (ICC ≥ 0.94) and women (ICC ≥ 0.96). The one-way analysis of variance ANOVA did not suggest any as-sociation, either isolated or combined, between the physical activ-ities review and regularity in the error magnitude in reports from men (p ≥ 0.29) and women (p ≥ 0.07). According to these findings, the authors encourage weight and height report use in studies with large sampling size, regardless the physical activity level.
INTRODUCTION
The growth of obesity as public health problem in developed and developing countries has led to an increasing need to asses weight, height and, hence, the body mass index (BMI) in epidemi-ological studies. The BMI, assessed through the product weight (kg) by height-2 (m), has been used as a valid indicator of the
nutri-tional status of populanutri-tional groups(1).
Despite being easily assessed, the weight and statute informa-tion is sometimes used through self-reported data. This is the case, for example, of studies involving a large number of individuals ap-proached through telephone interviews or questionnaires sent by mail(2,3). It seems to have a good reliability in this method that,
how-ever, is population specific(4-7).
The regular practice of physical exercises may be considered as one of the main factors to prevent weight gain, where the own weight control is a reason that leads individuals to exercise
them-selves. In addition, the physical fitness obtained through exercise reduces mortality and morbidity, even among obese individuals(8,9).
Studies assessing the physical activity level make use of the self-reported weigh and height more and more. Generally, such stud-ies investigate the risk of chronic-degenerative diseases in some populations using the self-reported BMI in associations with other variables(10-14).
In this context, knowing the reliability of self-reports of individu-als who search for the practice of supervised exercises and verify-ing if active individuals are more reliable their reports become im-portant. Relevant mistakes in these people report may mislead the evaluation of the risk profile for chronic-degenerative diseases and the physical activity program that will be prescribed.
Thus, the objective of this study was to verify the reliability of self-reported weight, height and BMI through the comparison of these variables with measured values in individuals who searched for supervised practice of exercise in a sports center. Furthermore, the influence of the physical activities review on the reliability of that report was also verified.
METHODS
The sample of this study was comprised 328 individuals from 18 to 81 years old: 200 women (39 ± 11 years) and 128 men (35 ± 10 years), who searched for supervised practice of exercises in the city of Petrópolis (Rio de Janeiro). Before the start or three weeks after the beginning of their training program, the individuals underwent functional evaluation that, among other information, recorded the weight and height self-reported and measured val-ues. The evaluations occurred between 2001 and 2002 with the objective of verifying the health status through questions regard-ing morbidity, cardiovascular diseases risk factors, physical activity history and physical fitness evaluation. All participants signed a term of informed consent, according to recommendations of the Resolution 196/96 – National Health Council, after approval from the ethics committee of the institution.
Weight was reported in kilograms and height in centimeters with up to one decimal place. Both variables were assessed after self-report in calibrated electronic scale with stadiometer (Welmy®),
presenting readings of 0.1 kilogram and 0.5 centimeter for weight and height, respectively. The measurements were performed ac-cording to the Anthropometric Standardization Reference Manu-al(15). Weight and height variables were collected by two
indepen-dent appraisers with 10-minute intervals, so that no one could know information collected by the other. All variables were evaluated separately, according to gender.
140e
Rev Bras Med Esporte _ Vol. 11, Nº 2 – Mar/Abr, 2005(those who exercised three times a week or more in the last three months with duration of 20 minutes per session).
The difference between self-reported and measured weight and height was considered as the report error. Negative values repre-sent underestimation, while positive values, overestimation. The concordance between reported and measured variables, once it deals about continuous variables, was assessed through the intra-class correlation coefficient (ICC)(16); which was estimated by
us-ing information regardus-ing to the mean squares obtained after two-way analysis of variance, considering the observer as a random factor; in other words, considering a variance, even minimal, be-tween appraisers.
The calculation of the ICC used is shown in chart 1.
CHART 1
Calculation of the intraclass correlation coefficient (ICC) used in the present study
ICC = δδδδδ2 individuals ÷ (δδδδδ2 individuals + δδδδδ2 appraisers + δδδδδ2 error)
δ2 individuals (Mean square of results from individuals – mean square of residuals) ÷ number of appraisers
δ2 appraisers (Mean square of results from appraisers – mean square of residuals) ÷ number of individuals
δ2 error Mean square of residuals
The difference between self-reported and measured variables or the report error was also evaluated through methodology pro-posed by Bland and Altman(17). This methodology consists of a
graphic arrangement of intra-individual differences (reported x sured) in function of the intra-individual averages ([reported + mea-sured] ÷ 2). Thus, it could also be evaluated if the report error was constant (homoscedastic) or if it changed according to the abso-lute value of the intra-individual averages, what would indicate pres-ence of heteroscedasticity. Ideally, the report error is expected to be independent of the variables’ absolute value; in other words, the report error magnitude is expected to be independent from the magnitude of the individual’s weight, height or BMI.
The Bland-Altman curve was also used with the objective of verifying possible outliers. Three concordance limits of 95% (CL 95%) were calculated to aid in this analysis and were calculated through the average difference between the reported and mea-sured ± standard deviation of differences multiplied by 1.96. In case some error equivalent to two upper or lower CL 95% was found, the ICC could be recalculated with the exclusion of these discrepant values.
In the evaluation of the influence of the physical activity level on the weight and height report, the one-way ANOVA was used. To do so, the variable analyzed was the absolute difference between reported and measured variable. The descriptive statistics was used in the sample characterization. The software Stata™ (Standard
Edi-tion 8.0) was used for the entire data analysis, considering p < 0.05 as significance level.
RESULTS
Table 1 shows the descriptive data regarding weight, height and BMI, both reported and measured for all subjects and the CL 95%. Through these values, we can observe only a slight difference be-tween the averages of reported and measured values, what sug-gests a high concordance for all variables in men and women. With the objective of corroborating this finding, the ICC calculation was performed (table 2). The data obtained showed high reliability be-tween all variables assessed in men. On the other hand, the reli-ability of reported height in women, was not low, but presented a lower coefficient than the other variables.
TABLE 1
Weight, height, body mass index (BMI), average differences and concordance limits of 95% (CL 95%) between self-reported
and measured variables in the sample studied
Variables Reported Measured Average CL 95% (average ± sd) (average ± sd) differences*
Men
Weight (kg) 79.8 ± 15.2 79.6 ± 15.2 –0.20 –5.1 ↔ +4.5 Height (m) 1.77 ± 0.08 1.76 ± 0.08 –0.01 +0.02 ↔ +0.03 BMI (kg.m-2) 25.8 ± 3.37 25.8 ± 3.35 –0,00 –1.88 ↔ +1.93 Women
Weight (kg) 62.7 ± 11.1 62.8 ± 11.5 –0.10 –3.0 ↔ +3.0 Height (m) 1.62 ± 0.07 1.61 ± 0.07 –0.01 –0.04 ↔ +0.04 BMI (kg.m-2) 23.9 ± 3.93 24.1 ± 4.27 –0.20 –1.58 ↔ +1.80 * average difference = reported value – measured value.
TABLE 2
Intraclass correlation coefficient (ICC) between self-reported and measured weight, height and body mass index (BMI)
Variables ICC
Men
Weight (kg) 0.979
Height (m) 0.964
BMI (kg.m-2-2-2-2-2) 0.941
Women
Weight (kg) 0.981
Height (m) 0.963*
BMI (kg.m-2) 0.964†
* This value was obtained when the ICC calculation occurred after the exclusion of two outliers present in the sample. The ICC value before this procedure was of 0.926.
† This value was obtained when the ICC calculation occurred after the exclusion of two outliers present in the sample. The ICC value before this procedure was of 0.958.
-10 -8 -6 -4 -2 0 2 4 6 8 10
30 40 50 60 70 80 90 100 110 120
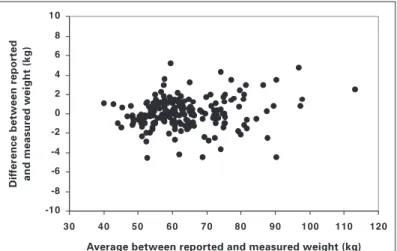
Fig. 1 – Difference between reported and measured weight (report error) in function of the average between reported and measured weight in wom-en
D
if
fer
ence between r
eported
and measured weight (kg)
Average between reported and measured weight (kg)
Figures 1 to 6 present the application of the Bland-Altman meth-odology(17) for variables height, weight and BMI for both men and
women. Through the observation of the curves, no heteroscedas-tic behavior is clear. In the case of the variable weight in men (fig-ure 4), a weight underestimation tendency is verified (more data below zero), and it is not evident that this difference increases with the body weight.
Rev Bras Med Esporte _ Vol. 11, Nº 2 – Mar/Abr, 2005
141e
-5,0-4,0 -3,0 -2,0 -1,0 0,0 1,0 2,0 3,0 4,0 5,0
15 20 25 30 35 40
(g
)
Fig. 3 – Difference between reported and measured body mass index (re-port error) in function of the average between re(re-ported and measured BMI in women
D
if
fer
ence between r
eported
and measured BMI (kg.cm
-2)
Average between reported and measured BMI (kg.cm-2)
-14 -12 -10 -8 -6 -4 -2 0 2 4 6 8 10 12 14
140 150 160 170 180
Fig. 2 – Difference between reported and measured height (report error) in function of the average between reported and measured height in women
D
if
fer
ence between r
eported
and measured height (cm)
Average between reported and measured height (cm)
-10 -8 -6 -4 -2 0 2 4 6 8 10
50 60 70 80 90 10 0 11 0 12 0
Fig. 4 – Difference between reported and measured weight (report error) in function of the average between reported and measured weight in men
D
if
fer
ence between r
eported
and measured weight (kg)
Average between reported and measured weight (kg)
-14 -12 -10 -8 -6 -4 -2 0 2 4 6 8 10 12 14
160 170 180 190 200
Fig. 5 – Difference between reported and measured height (report error) in function of the average between reported and measured height in men
D
if
fer
ence between r
eported
and measured height (cm)
Average between reported and measured height (cm)
-5,0 -4,0 -3,0 -2,0 -1,0 0,0 1,0 2,0 3,0 4,0 5,0
15 20 25 30 35 40
Fig. 6 – Difference between reported and measured body mass index (re-port error) in function of the average between re(re-ported and measured BMI in men
D
if
fer
ence between r
eported
and measured BMI (kg.cm
-2)
Average between reported and measured BMI (kg.cm-2)
TABLE 3
Physical activity level in men and women in the three months before evaluations
Physical activity level Men (n = 128) Women (n = 200)
Inactive* 65 (50.8%) 126 (63%)
A low active† 25 (19.5%) 016 0(8%)
Active‡ 28 (29.7%) 058 (29%)
* None physical activity.
† Physical activity once to twice a week during 20 minutes or more. ‡ Physical activity three times a week or more during 20 minutes or more.
TABLE 4
Influence of the physical activity level on the report error in men and women according to the one-way ANOVA
Variables Men Women
Weight p = 0.29 p = 0.07
Height p = 0.73 p = 0.61
BMI p = 0.41 p = 0.48
Not coincidently, the variable height in women was the one pre-senting the lowest ICC (table 2). As defined in the methodology, the ICC with the exclusion of the discrepant values was recalculat-ed, and this new value increased from 0.926 to 0.963. The removal of these two values also affected the ICC in relation to the wom-en’s BMI, which increased from 0.958 to 0.964.
142e
Rev Bras Med Esporte _ Vol. 11, Nº 2 – Mar/Abr, 2005 DISCUSSIONThe concern of deepening questions regarding the reliability of weight and height reports in individuals who seek the supervised practice of exercises was remarkable in this study. Although the findings presented are in agreement with those from other stud-ies(6,18) with regard to the magnitude of the difference between
reported and measured variables (less than 1 cm for height and 0.5 kg for weight for both genders), some approaches used here are different from those previously used.
For example, in the study of Chor et al.(6), the authors attempted
not only to test the reliability of each variable for men and women separately, but also to observe if the report error depended on the variable magnitude. In this purpose, the Bland-Altman curves were calculated separately by gender and variable reported. We believe that, when this procedure is not performed, the verification of spe-cific details of each gender becomes difficult, especially heterosce-dastic behaviors. A clear example of this difficulty may be seen in a recent study by Fonseca et al.(19), who verified the validity of the
weight and statute report information in relation to values mea-sured in university attendants.
No heteroscedastic behavior was verified in the present study for weight, height and BMI. One of the factors that may have influ-enced it was the fact that the sample used was not composed of many overweighed people, what could have impaired a more de-tailed observation.
Still in relation to the study of Chor et al.(6), the error in the height
report was considered as insignificant. Thus, both the ICC and the Bland-Altman curves were not calculated. In the present study, we showed that the height error should be considered, so that the ICC had to be recalculated in the case of women. Besides, we believe that the new ICC calculation is justified, once these values were quite discrepant (reports of 10 and 12 cm more than the actual height).
The fact that the individuals who participated in the study of Chor et al.(6) knew that their reports would be compared with
mea-surements before they had been questioned may explain the fact that higher ICC values were found, when compared with values from our study. An example may be the so high ICC for height.
The other study from which we differ with regard to the data treatment strategy was that by Araújo and Araújo(18). These
au-thors used the Pearson correlation instead of the ICC calculation. We recommend the use of the ICC, once correlation analysis would be effective to verify the association of variables, but not the reli-ability. A good example is the correlation between Celsius and Fahr-enheit degrees for temperature, as reported by Holiday et al.(20).
Although this correlation is perfect (r = 1.0), the ICC would be small, once the difference between the two values is too big.
CONCLUSION
The increasing divulgation of the physical activity benefits for weight control and health improvement in several national pro-grams, such as the governmental Health Policies program(21), may
lead to higher concern with body weight by those who search for the practice of physical activities. Furthermore, theses types of programs seem to encourage the performance of new population-al studies that would include the use of reported variables such as physical activity level, weight, height and, hence, BMI.
According to our findings, we encourage the use of the weight and height reports in large sampling size studies, regardless the physical activity level, once this variable does not seem to influ-ence the report. However, further research must be conducted in
order to verify the reliability of the reported weight and even the influence of the physical activity level in men and women previ-ously classified as overweighed and/or obese.
Other important aspect is that our sample involved individuals whose age range reflects most people who search for the super-vised practice of exercises in sports centers, including few elders. However, the number of elders seeking to maintain themselves active is increasing, what reinforces the importance of future in-vestigations also in older populations.
All the authors declared there is not any potential conflict of inter-ests regarding this article.
REFERENCES
1. Anjos LA. Índice de massa corporal como indicador do estado nutricional de adultos: revisão de literatura. Rev de Saúde Pública 1992;26:431-6.
2. Madrigal-Fritsch H, Irala-Estevez J, Martinez-Gonzalez MA, Kearney J, Gibney M, Martinez-Hernandez JA. Percepción de la imagen corporal como aproxima-ción cualitativa al estado de nutriaproxima-ción. Salud Publica del Mexico 1999;41:479-86.
3. Vaz de Almeida MD, Graca P, Afonso C, D’Amicis A, Lappalainen R, Damkjaer S. Physical activity levels and body weight in a nationally representative sample in the European Union. Public Health Nutr 1999;2:105-13.
4. Stunkard AJ, Albaum JM. The accuracy of self reported weight. Am J Clin Nutr 1981;34:1953-9.
5. Palta M, Prineas RJ, Berman R, Hannan P. Comparison of self-reported and measured height and weight. Am J Epidemiol 1982;115:223-30.
6. Chor D, Coutinho ESF, Laurenti, R. Confiabilidade da informação de peso e esta-tura em funcionários de banco estatal. Rev de Saúde Pública 1999;33:16-23. 7. Boltom-Smith C, Woodward M, Tunstall-Pedoe H, Morrison C. Accuracy of the
estimated prevalence of obesity from self reported height and weight in an adult Scottish population. J Epidemiol Community Health 2000;54:143-8.
8. Obesity: preventing and managing the global epidemic: report of a WHO Con-sultation on Obesity, Geneva, June 3-5, 1997. Geneva: World Health Organiza-tion, 1998.
9. Jebb AS, Moore MS. Contribution of a sedentary life-style and inactivity to the etiology of overweight and obesity: current evidence and research issues. Med Sci Sports Exerc 1999;31:S534-41.
10. Black DR, Taylor AM, Coster DC. Accuracy of self-reported body weight: Stepped Approach Model component assessment. Health Educ Res 1998;13:301-7.
11. Martinez JA, Kearney JM, Kafatos A, Paquet S, Martinez-Gonzalez MA. Vari-ables independently associated with self-reported obesity in the European Union. Public Health Nutr 1999;2:125-33.
12. Timperio A, Cameron-Smith D, Burns C, Salmon J, Crawford D. Physical activity beliefs and behaviour among adults attempting weight control. Int J Obesity 2000;24:81-7.
13. Gutierrez-Fisac JL, Guallar-Castillon P, Diez-Ganan L, Lopez Garcia E, Banegas Banegas JR, Rodriguez Artalejo F. Work-related physical activity is not associat-ed with body mass index and obesity. Obes Res 2002;10:270-6.
14. Lowry R, Galuska DA, Fulton JE, Wechsler H, Kann L. Weight management goals and practices among U.S. high school students: associations with physical activity, diet, and smoking. J Adolesc Health 2002;31:133-44.
15. Lohman TG, Roche AF, Martorell R, editors. Anthropometric standardization ref-erence manual. Abridged edition. Champaign: Human Kinetics, 1991. 16. Shrout PE, Fleiss JL. Intraclass correlations: uses in assessing rater reliability.
Psychol Bull 1979; 86:420-8.
17. Bland JM, Altman DG. Statistical methods for assessing agreement between two methods of clinical measurement. Lancet 1986;1:307-9.
18. Araújo DSMS, Araújo CGS. Autopercepção e insatisfação com o peso corporal independem da freqüência de atividade física. Arq Bras Cardiol 2003;80:235-42. 19. Fonseca MJM, Faerstein E, Chor D, Lopes C S. Validade de peso e estatura informados e índice de massa corporal: estudo pró-saúde. Rev de Saúde Publica 2004;38:392-8.
20. Holiday D, Ballard J, McKeown B. PRESS-related statistics: regression tools for cross-validation and case diagnostics. Med Sci Sports Exerc 1995;27:612-20. 21. Ministério da Saúde. Secretaria de Políticas de Saúde. Programa Nacional de