Precipitation Evolution and Modeling of Growth Kinetics of L1
2-structured Al
3Zr Particles
in Al-0.22Zr and Al-0.32Zr (wt.%) Alloys Isothermally Aged
Pedro Henrique Lamarão Souzaa*, José Maria do Vale Quaresmab, Carlos Augusto Silva de Oliveiraa
Received: May 10, 2017; Revised: July 31, 2017; Accepted: August 01, 2017
The microstructure and microhardness of isothermally aged Al-0.22Zr and Al-0.32Zr alloys were investigated. Peak microhardness occurred after aging at 650K for 100 h for both alloys and decreased slightly after aging at 400 h. Nanometer-scale spherical L12-structured Al3Zr precipitates were observed using Transmission Electron Microscopy, these presented r < 7 nm at the center of dendrite branches. In the Al-0.32Zr alloy, particles increased in radius after aging at 650 K from 100 to 400 h while in the Al-0.22Zr alloy, precipitate radii remained constant in the same range. This is possibly due to solute migration to the periphery of dendritic branches, where larger particles nucleated. After aging at 700 K for 100h, there are growth instabilities at the interface of the particles. A theoretical model,
used to predict particle growth by difusion, presented good agreement with the experimental indings.
Keywords: Microstructure, Al-Zr alloys, L12-structured Al3Zr precipitates, particle growth, microhardness.
*e-mail: [email protected].
1. Introduction
Studies about cast and aged Al-Zr alloys aim applications at elevated temperatures, in the production of automotive and aeronautical components1. In the former, cast Al alloys
are employed in pistons, cranckshafts, air-cooled cylinder heads and gear housings. In the latter as pylons and missile tail cones2.
Al-Zr alloys are precipitation hardening and present elevated thermal stability due to the precipitation of nanometer-scale metastable Al3Zr L12 precipitates1,3,4. These particles are
coherent, thermodynamically stable5 and provide hardening
even after long times of heat-treatment (400 h) at temperatures of 698 K6 and nucleate homogeneously in a high number
density at the center of the dendrites, where supersaturation is greater4,6. Al
3Zr precipitates present a series of diferent
morphologies, depending on processing conditions these may be spheroidal6-8, rod-like6,8, petal-like6,9,10, caulilower6,
cellular11,12 and disk-like13,14.
In Al-Zr alloys of hypoperitectic compositions (wt.% Zr < 0.28)15, Ness8 showed that after aging at 733 K, an
Al-0.18wt.%Zr alloy presented L12-structured Al3Zr particles, that increased in size from ~20 to 70 nm in the range of 24 - 700 h of aging time. The authors observed spherical particles mainly, although some rod-like particles are present in 〈100〉 matrix directions.
Some authors6,9-12,14 had performed microstructural
characterization in hyperperitectic Al-Zr alloys and observed that the main particles responsible for hardening are the
spherical Al3Zr, nucleated at the center of dendrite branches,
while the rod-like and caulilower morphologies occur at solute
depleted regions6. The petal-like morphology is characteristic
of coarse particles that nucleate during solidiication in slowly
cooled Al-Zr alloys. They nucleate at high temperatures, and its presence is undesirable for mechanical properties, once
they deplete the matrix with Zr4. The cellular morphology is
associated with the discontinuous precipitation of Al3Zr along a moving grain boundary12,14. It was observed after aging at
773 K for 120 h in an Al-0.5wt.%Zr alloy11 and after aging
at the same temperature for 3 h in an Al-9.4wt.%Zr alloy12.
The disk-like morphology is the equilibrium tetragonal D023 structure, which nucleates after aging at temperatures above 773 K13,14,16.
The precipitation of L12-structured Al3Zr particles is
modiied by the presence of ternary additions. Yb additions
promote a two-peak hardening during isochronal aging, by the precipitation of L12-structured Al3(Zr,Yb) precipitates, that are more coarsening-resistant than Al3Zr or Al3Yb particles17. Y additions accelerate the precipitation kinetics
of Al3Zr particles and retard coarsening18.
In quaternary alloys, the combined efect of Zr, Sc and
Er in Al alloys precipitate the L12-structured Al3(Zr,Sc,Er) precipitate, which present a core-shell structure and provide hardening for periods as 64 days of aging at 673 K1.
Booth-morrisson et al.19 studied the efects of Er additions in the
quaternary Al-Zr-Sc-Si alloy. It was observed that coarsening and creep resistance at 673 K increased with the presence of Er intermetallics.20 studied an Al-Mn-Sc-Zr aged at 573 K.
Although appreciable hardening was observed by the presence
aUniversidade Federal de Santa Catarina - UFSC, Campus Universitário João David Ferreira Lima,
Rua Delino Conti, Trindade, CEP: 88040-900, Florianópolis, SC, Brasil.
bUniversidade Federal do Pará - UFPA, Campus Guamá, Rua Augusto Corrêa, nº 01, Guamá, CP 479,
1601 Precipitation Evolution and Modeling of Growth Kinetics of L12-structured Al3Zr Particles in Al-0.22Zr and
Al-0.32Zr (wt.%) Alloys Isothermally Aged
of L12-structured Al3(Sc,Zr) particles, Mn solutes were not observed in the precipitation process.
Lefebvre et al.21 studied Al
3Zr precipitation in an
Al-0.34Zr alloy with the presence of Fe and Si from a 1050
Al alloy. No discussions of the inluence of Fe and Si over
the precipitation of the L12-structured Al3Zr particles were
performed, although the authors were the irst to study the
shearing to bypassing transition of the particles by dislocations. There is little information quantifying the microstructural evolution at the center and periphery of dendrite branches
during isothermal aging. As already explained by Knipling
et al6, Al-Zr alloys present strong solute segregation
along dendrites. This gives rise to a range of particle size distributions at distinct regions during aging. Also, there is little information about the mechanical properties of hypoperitectic Al-Zr alloys and few papers had proposed modeling for the prediction of the growth kinetics of L12 -structured Al3Zr particles during aging. Therefore, this study investigates the microstructures of dilute Al-0.22wt.%Zr and Al-0.32wt.%Zr alloys after isothermal aging and correlate this information with its Vickers microhardness and with a
theoretical model consisting of equations from solidiication, nucleation and difusional growth that simulate the evolution
of precipitate radii with time.
2. Experimental
The alloys were conventionally cast, using high purity Al (99.8 %) and an Al-10Zr master alloy (all compositions in wt.%). Conventional casting occurred inserting the metals in a kaolin coated SiC crucible and casting in a resistively heated furnace at 1120 K. Subsequently the melt was stirred, degassed with inert gas (Ar) and poured in a water-cooled Cu mold, producing an ingot weighting ~ 600 g.
Table 1 presents the chemical composition of the alloys. The Al-0.22Zr alloy was analyzed in a Bruker Q4 Tasman Optical Mass Spectrometer and the Al-0.32Zr alloy in a Perkin Elmer Optima 8300 Inductively Coupled Plasma Optical Emission Spectrometer.
The samples were isothermally aged using a resistively heated furnace. The temperatures employed were 650 and 700 K, ±1K at the times of 4, 12, 24, 100 and 400 h. The aging temperatures and times were adopted because a study in the literature demonstrated that these parameters promote precipitation hardening in hiperperitectic Al-Zr alloys4. After the treatments, samples were water-quenched
to room temperature.
Vickers microhardness tests were performed in accordance with the ASTM E38422 standard; using a load of 1.96 N
Table 1. Chemical compositions of the studied alloys.
Alloy Zr Fe Si Al
Al-0.22Zr 0.23 0.10 0.05 Balance
Al-0.32Zr 0.32 0.10 0.03 Balance
(200 gf) and a dwelling time of 5 s. 20 microhardness tests were performed at each sample.
The as-cast microstructure of the alloys was investigated using Scanning Electron Microscopy - SEM using Backscattered Electrons - BSE for imaging and Energy Dispersive X-ray Spectroscopy - EDS for analysis of dispersoids and chemical
composition in the matrix.
The microstructures of the specimens were analyzed by Transmission Electron Microscopy - TEM, using a JEOL JEM 1011 microscope, with an accelerating voltage
of 100kV, employing bright-ield, dark-ield and Selected Area Difraction - SADP techniques.
The samples for TEM analysis were grinded to 100 µm thickness discs and thinned to perforation in a Struers Tenupol 5 electropolishing unit, using an electrolyte of 2/3 methyl alcohol and 1/3 nitric acid at the temperature of 276 K ±3 K. After electropolishing, cleaning of the samples occurred by rinsing it three times into methanol and in methyl alcohol, a procedure similar to the one used by Ünlü23.
In the TEM, precipitate radii were measured at the center and periphery of dendrite branches. The former being regions with an apparent higher number density of smaller particles and the latter with an apparent lower number density of bigger particles and also with the presence of rod-like precipitates. Several independent micrographs were recorded to obtain reliable results. Precipitate radii were measured using software
ImageJ, the results were exported to the software R statistical
to remove outliers and to calculate descriptive statistics as precipitate mean radii - 〈r〉. The indexing of the SADPs was realized using the software Web E-MAPS, which simulated
the difraction conditions used in the present study.
3. Modelling Precipitation Kinetics
In the present study, the experimental results of 〈r〉 at the center of dendrite branches were compared with theoretical calculations. The model considers distinct aspects from
solidiication, nucleation and difusional growth.
The irst calculated parameter is the solute content at
the center of dendrite branches, which is obtained from the
Scheil equation for solute distribution during solidiication
- Ce (Eq.1), considering total mixing in the liquid and no difusion in the solid24, where k
0 is the solid/liquid partition
coeicient (Eq.2)24, C
0 the nominal solute concentrations of
the studied alloys, fs the solidiied fraction, Cs = 0.28wt.%Zr the equilibrium solid solubility and CL = 0.11wt.%Zr15 the
equilibrium liquid solubility.
(1)
(2)
As the solidification conditions are distinct from equilibrium, and the local Zr concentration in the ingot at
C
ek C
1
f
s k 0 0 1 0=
-
-Q
V
/
the metal/mold interface may difer from the innermost
regions, both C0 and k0 were itted simulating values from
0.1 to 0.8 wt.%Zr for C0 and from 1.00 to 2.54 for k0. The values that obtained the minimum Residual Sum of Squares - RSS (Eq.3)25 were selected for the next calculation steps. In
Eq.3, Cexp is the Zr concentration measured along the sample and the i superscripts indicate the number of data points.
(3)
As fs varies from 0 to 1, where the former value is the center of dendrite branch and the latter the periphery of dendrite branches. It is considered, for modeling purposes, that the Zr concentration at the center of dendrite branches - Cm is equal to Ce for fs = 0.01.
The next calculation step was the determination of the
critical radius for nucleation - r*, assuming that homogeneous
nucleation occurs at the center of dendrite branches. The values for r* are calculated in Eq. (4)26, where γ = 0.1033
J/m2 27 is the interfacial energy of the Al
3Zr L12 precipitate
with the Al matrix at 650 K, Va is the atomic volume, k = 1.381E-23 J/K is the Boltzman constant28, R = 8,314 kJ/mol
the universal gas constant28, T the absolute temperature
and CL12
a (Eq.5)4 is the Zr concentration in the matrix in
equilibrium with the Al3Zr particle and is calculated from the solvus line of the metastable Al3Zr L12, where CD023
a is
the equilibrium solvus (Eq.6)29.
(4)
(5)
(6)
This calculation step considers that the metastable L12 -structured Al3Zr particle has its stoichiometric composition and no other intermetallic compounds consume Zr from the
matrix. Also, during nucleation, the Zr concentration at the precipitate/matrix interface is equal to the solute concentration in the matrix at the center of dendrite branches26.
The variation of particle radius considering difusion
control - rd is expressed in Eq. (7)30, C
β is the Zr content in the particle, Ω is the dimensionless supersaturation (Eq. 8), D is the difusion coeicient (Eq. (9))31, where D
0 =
7.28x10E-02 m2/s and Q = 241.8 kJ/mol are the pre-exponential factor
and the activation enthalpy for difusion, respectively32 and
t is the time.
(7)
(8)
(9)
RSS
iC
expC
n i e i 1 2
=
R
=Q
-
V
/
ln
/
r
*2
V kT
aC
mC
L12
c
=
Q
aV
.
exp
/
C
L12C
D0230 710
1300
T
$
$
=
a a
Q
V
(
.
/
)
exp
C
D0231180
64 96 10
3RT
$
$
=
-a
r
d2
Dt
1 2
X
=
Q
V
/
C
mC
C
C
GT GT
X
=
Q
-
aV
Q
b-
aV
/
exp
D
=
D
0Q
-
Q RT
V
In Eq. 8, Cm varies with time due to precipitation, because
the particles drain solute from the matrix as they grow - Cm
(t) (Eq.10)33,34, where τ is a temperature-dependent factor
(Eq. 1133) and λ the experimental interparticle spacing. The
variable CGT
a (Eq. 12)35 is the metastable solubility corrected
for capillarity efects, where Vm is the molar volume.
(10)
(11)
(12)
When r* → 0, the variation of r with time can be expressed
using Eq.730 otherwise it is computed considering the sum of
r* (Eq.4) and rd (Eq.7), in Eq.1334,36, where r
m is the particle
radius of the model.
(13)
The main limitations of the model are that: (i) solute gradients along the dendrite branches are not considered; (ii) competitive growth, which might appear after soft
impingement of the difusion ields, is not being modeled.
4 Results and Discussion
4.1 As-cast condition
Samples were studied in the as-cast condition to assess the presence - or not of primary Al3Zr particles formed
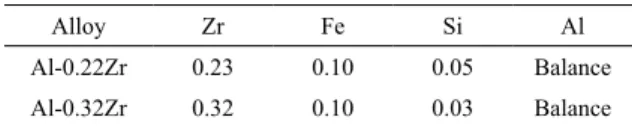
during solidiication. Figure 1a is a TEM micrograph of the
Al-0.22Zr alloy. It is possible to observe the contrast due to
dislocations in the matrix only. Figure 1b is a bright ield
micrograph of the Al-0.32Zr alloy. Again the micrograph
exhibits the presence of dislocations only.
Althougth TEM images of the as-cast samples did not revealed the presence of dispersoids, SEM results (Figure 2) show the presence of both primary eutectic and peritectic phases. In Figure 2a, it is possible to observe globular Al-Fe phases (arrows 1 and 2) and a Al-Al-Fe-Si lamelar phase (arrow 3), as assessed by EDS analysis. These particles are
commonly nucleated during solidiication of Al alloys37.
Figure 2b is a micrograph of the Al-0.32Zr alloy. It is also possible to observe the presence of dispersoids, in this case, possibly primary Al3Zr (arrow 4), due to the presence of Al and Zr only, as indicated by its EDS spectrum in Figure 3a. Arrows 5 and 6 indicate the presence of Al, Zr and Fe (Figure 3b).
It is possible that primary Al3Zr parricles are nucleating
heterogeneously over Al-Fe dispersoids during solidiication,
because there are no equilibrium Al-Zr-Fe phases predicted by the Al rich corner of its ternary diagram. There is a study
(
/ )
exp
C
mt
C
C
C
t
GT m
GT
x
=
a+
-
a-Q
V
Q
V
/
2
/
2
D C
/
C
m2 13
x
=
R
Q
m
V
W
Q
bV
/
exp
C
GTC
L2
V rRT
m
12
c
=
a a
Q
V
1603 Precipitation Evolution and Modeling of Growth Kinetics of L12-structured Al3Zr Particles in Al-0.22Zr and
Al-0.32Zr (wt.%) Alloys Isothermally Aged
Figure 1. Bright-ield TEM micrographs of as-cast samples of (a) Al-0.22Zr and (b) Al-0.32Zr alloys.
Figure 2. SEM micrographs of the as-cast alloys (a) Al-0.20Zr and (b) Al-0.32Zr.
Figure 3. EDS spectrum of arrows 4 (a) and 5 (b) in Fig.2b, with the elements Al, Fe and Zr.
in the literature in an Al-25Zr-12.5Fe alloy obtained with powder metallurgy in which an Al11Fe8Zr6 intermetallic was found38.
The nucleation of primary Al3Zr particles occurs in
Al-Zr alloys when the solidiication cooling rate is bellow
a critical value. If the cooling rate is high enough, there is peritectic suppression, which culminates with the formation of a metastable supersaturated solid solution39. Once the
critical cooling rate for peritectic suppression reduces with lower solute content10, this is possibly the reason why no Zr
rich particles were observed in the Al-0.22Zr alloy.
The Zr content also inluences in the modiication of
the average grain size of the alloys. In the Al-0.22Zr and Al-0.32Zr alloys, the average grain sizes are 127 and 79 µm, respectively, indicating a ~60% decrease in the average grain size due to the presence of Zr.
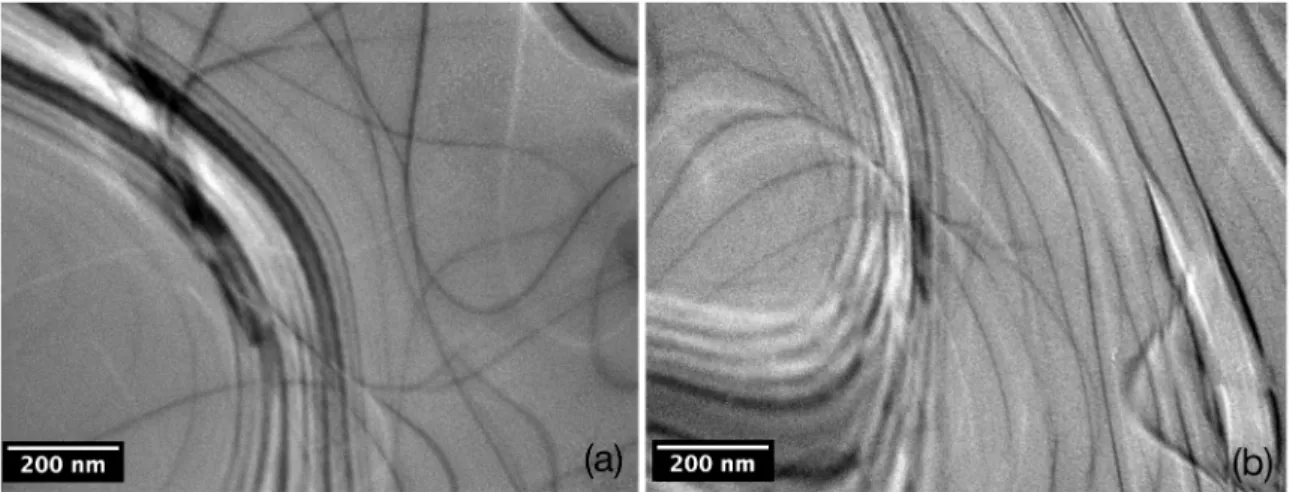
Inside the grains, EDS measurements were performed in order to observe the Zr segregation throughout the microstructure and use the measurements as a part of the input of the modeling process.
Figure 4 exhibits results for the studied alloys. It is possible to
Figure 4. Zr composition along a grain in the (a) Al-0.22Zr and (b) Al-0.32Zr alloys.
Zr concentration is above the nominal solute content of the alloy,
although Zr peaks are expected by the Scheil model other studies
in the literature found similar results26,40.
4.2 Age hardening
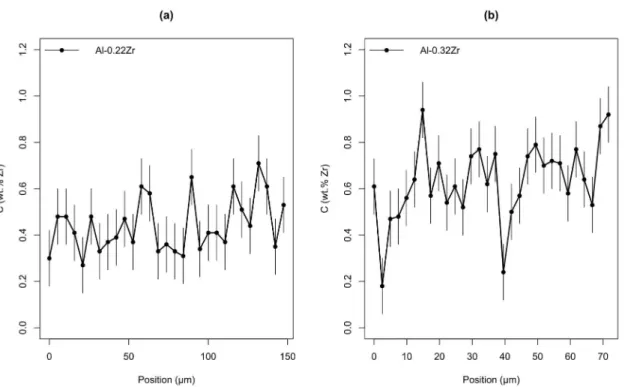
Figure 5 presents the variation of microhardness as a function of aging temperature and time. Considering the
efect of temperature, in the results of the Al-0.22Zr alloy
(Figure 5a), at 650 K, hardening was greater than at 700 K, regardless of the aging time. This happens because the driving force for precipitation is greater at the lower temperature6,
causing the precipitation of particles with smaller radius during aging at 650 K (section 4.3). The same behavior occurs in the Al-0.32Zr alloy (Figure 5b).
Considering the efect of aging time, in the heat-treatment
of the Al-0.22Zr alloy (Figure 5a), the increase in hardness started in 12 h at 650 K, achieving peak strength in 100 h. In 400 h, there is a slight decrease in microhardness. At 700 K, samples started to harden in 24 h, reaching peak-strength in 100 h and maintaining it in 400 h. In the Al-0.32Zr alloy (Figure 5b), microhardness values started to increase at 4 h of aging at 650 K. A steep increase in hardness occurs until 24 h, after which the increment in strength slowed and the alloy achieved peak hardness at 100 h. At 400 h, there is a slight decrease in hardness. At 700 K, similar behavior happens until 24 h, although the microhardness values are lower. The increase in strength was negligible from 24 to 100 h and the decrease in microhardness was greater at 400 h.
In both studied alloys, hardening occurred in shorter
times during aging at 650 K. Although difusion increases
with temperature, hence accelerating precipitation kinetics30,35
it is possible that the number density of precipitates in the earlier times of aging at 700 K is low, provided that no increase in hardness can be observed.
Considering the efect of solute content in Figure 5, for
a given aging temperature or time, microhardness values are greater in Figure 5b 0.32Zr) than in Figure 5a (Al-0.22Zr). The higher solute content in the former alloy led to the formation of precipitates with lower radii than in the latter during aging (section 4.3).
The precipitation kinetics in Figure 5b is similar to the results obtained by Knipling et al.6, which studied an alloy
produced by arc-melting, with similar composition (Al-0.34Zr) and aging temperatures (648 and 698 K), although microhardness values in the present work are ~10 HV 0.2 higher. Ryum11 studied a chill cast Al-0.5Zr alloy aged at
773 K. The alloy presented an increase in hardness of ~ 2 HV 0.3 after aging for 20 - 120 h.
4.3 Microstructural characterization of the aged
alloys
1605 Precipitation Evolution and Modeling of Growth Kinetics of L12-structured Al3Zr Particles in Al-0.22Zr and
Al-0.32Zr (wt.%) Alloys Isothermally Aged
Figure 5. Variation of microhardness values as a function of aging time at the temperatures of 650 and 700K for the (a) Al-0.22Zr and (b) Al-0.32Zr alloys.
Table 2. Particle measurement results.
Alloy Aging condition Region of dendrite
branch < r > (nm) Nº of images Particles counted
Al-0.22Zr
650 K 100 h Center 7 ± 1 10 239
650 K 400 h Center 7 ± 2 3 74
650 K 400 h Periphery 106 ± 21 10 183
700 K 100 h Center 12 ± 1 10 596
Al-0.32Zr
650 K 100 h Center 3 ± 0.4 4 111
650 K 400 h Center 5 ± 1 5 62
650 K 400 h Periphery 19 ± 4 3 43
unimodal distribution of measurements. Figure 6b is a
box-whisker diagram, which is useful in showing the dispersion
of data and identiication of outliers.
4.3.1 Al-0.22Zr Alloy
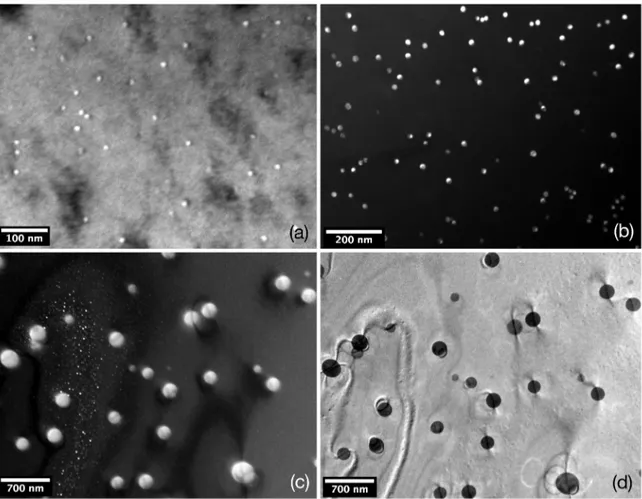
Figure 7 presents TEM images of the Al-0.22Zr alloy
aged at distinct conditions. Figure 7a is a dark-ield image
of the center of a dendritic branch after aging at 650 K for 100 h, with particles presenting 〈r〉 = 7 ± 1 nm. Figure 7b
is a dark-ield image of a sample aged at 700 K for 100 h at
the center of a dendritic branch, with larger particles: 〈r〉 =
12 ± 1 nm. Figure 7c is also a dark-ield image of a sample
aged at 650 K for 400 h. It is possible to observe that there
are iner particles at the center of the dendrite branches, with 〈r〉 = 7 ± 2 nm and larger particles at the periphery of the
dendrite branches, exhibiting 〈r〉 = 107 ± 21nm. Figure 7d is
the bright-ield image of Figure 7c it is possible to observe
the interactions of dislocations and precipitates. At the left corner of the image dislocations are bowing between particles, a process characteristic of the Orowan mechanism41. At the
right corner of the image, precipitates present a straight line, which are possibly due to the interaction of dislocation gliding
in diferent planes with Al3Zr precipitates.
Figure 6. Dispersion of precipitate radii in a sample aged at 650
K for 100 h: (a) frequency histogram and (b) box-whisker plot.
Figure 7. TEM images of an Al-0.22Zr alloy: (a) dark-ield micrograph of sample aged at 650 K for 100h; (b) dark-ield, aged at 700 K for 100 h; (c) dark-ield, aged at 650 K for 400 h; (d) bright-ield image of Fig.7c.
branches, provided that the latter particles are capable of maintaining appreciable hardening. The work of Ness8, in
which an Al-0.18Zr alloy was aged at 733 K for 700 h, did
not reported the presence of diferences between particles at
the center and periphery of dendrite branches even though aging temperatures and times were more elevated than in the
present study. The author reported the continuous growth of
the particles following a difusional growth law from Ham8.
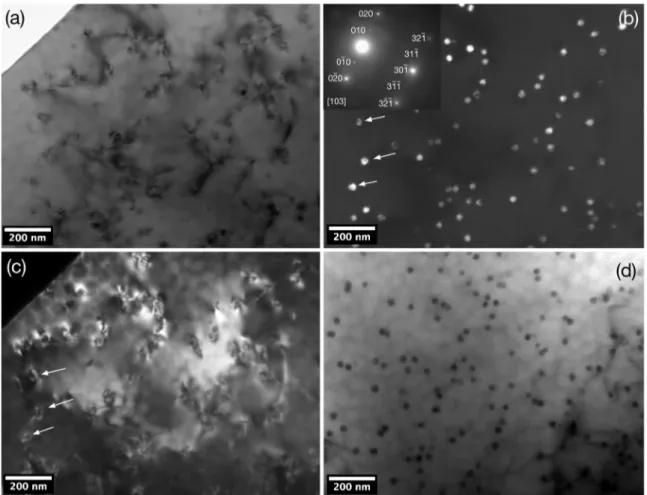
Aged samples presented ine L12-structured Al3Zr
precipitates in its microscructure. Figure 8a is a bright-ield image of a sample aged at 700 K for 100 h. The difraction conditions highlight mostly the Al matrix and dislocations,
which are overlapping precipitates. At the top left of the micrograph, the blank area is the perforation caused by electropolishing.
Figure 8b is a dark-ield image of Figure 8a. It shows
nanometer-scale particles homogeneously distributed through
the matrix. The dark-ield image uses the (010) superlattice relection, which is characteristic of L12-structured Al3Zr
precipitates. At the top left of Figure 8b the SADP of the
image exhibits a [103] zone axis, where {020} relections belong to the Al matrix. Manual indexing of the SADP
and simulations using the WEB-E MAPS software42, were
realized to conirm the structure of the particles. In Figure
8b, arrows indicate precipitates which are also shown in
Figure 8c, a complementary dark-ield image using a (020)
relection, highlighting matrix interactions, possibly due to
dislocations. Precipitate particles in this aging condition present an average mean radius - 〈r〉 = 12 ± 1 nm. Figure
1607 Precipitation Evolution and Modeling of Growth Kinetics of L12-structured Al3Zr Particles in Al-0.22Zr and
Al-0.32Zr (wt.%) Alloys Isothermally Aged
Figure 8. TEM micrographs of the Al-0.22Zr alloy aged at 700 K for 100 h. (a) bright-ield image, (b) complementary dark-ield image of Fig.8a, (c) complementary dark-ield image of Fig.8a and (d) tilted bright-ield image.
using tilting of the sample, thus highlighting precipitate particles only.
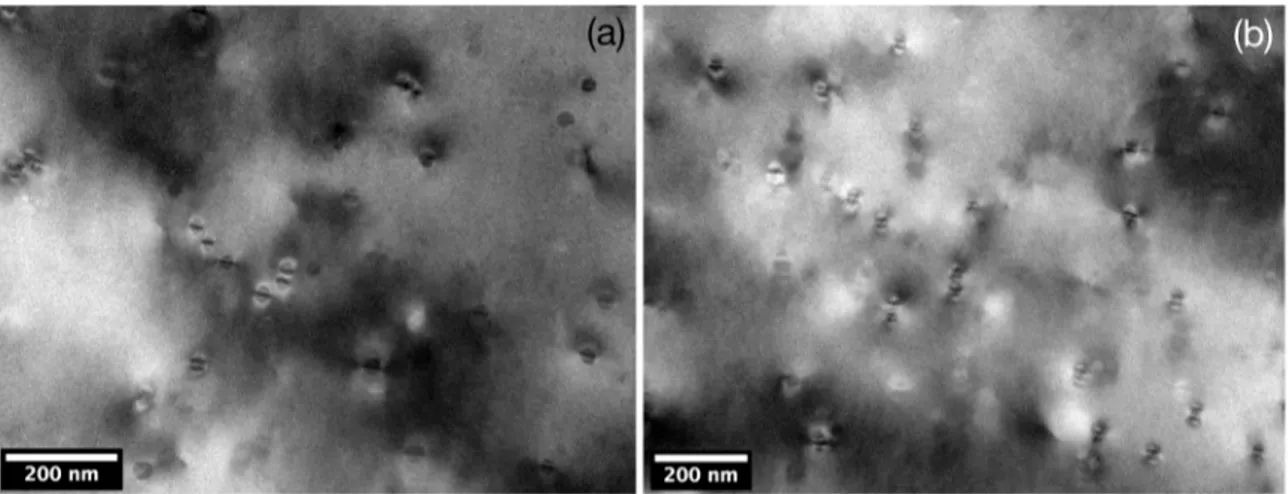
Figures 9 a and b are bright-ield images in difraction
conditions showing the Ashby-Brown contrast, characteristic of coherent particles43. It is possible to qualitatively judge
particle coherency by the loss of symmetry of the coherency
strains between precipitate and matrix, i.e. the straight black
lines along particles transform to a stripped pattern and the upper and lower lobes become asymmetrical6,44, what was
not observed in the present study.
Eq. 148 gives the absolute precipitate/matrix mismatch
- δ, where ɑ0 = 4.0495 Å 45 and ɑ
p=4.08 Å
8 are the lattice
parameters of Al and Al3Zr L12, respectively, resulting in δ =0.75%, a value that indicates elevated coherency5. During
aging, as particles grow there is a threshold size over which, precipitates start to lose coherency. The number of atomic planes necessary for the loss of coherency - n, is in Eq.1530.
Considering the spacing between {200} planes, the Al3Zr
precipitates should remain coherent to n = 130 planes, what corresponds to a radius of 26 nm6, thus indicating that
excluding the particles at the periphery of dendrite branches
in samples aged at 650 K for 400 h, the other particles observed in this study remain coherent.
(14)
(15)
Figure 10a is a bright-ield image of precipitates
along dislocations; Figure 10b presents its complementary
superlattice dark-ield micrograph, using {100} relections.
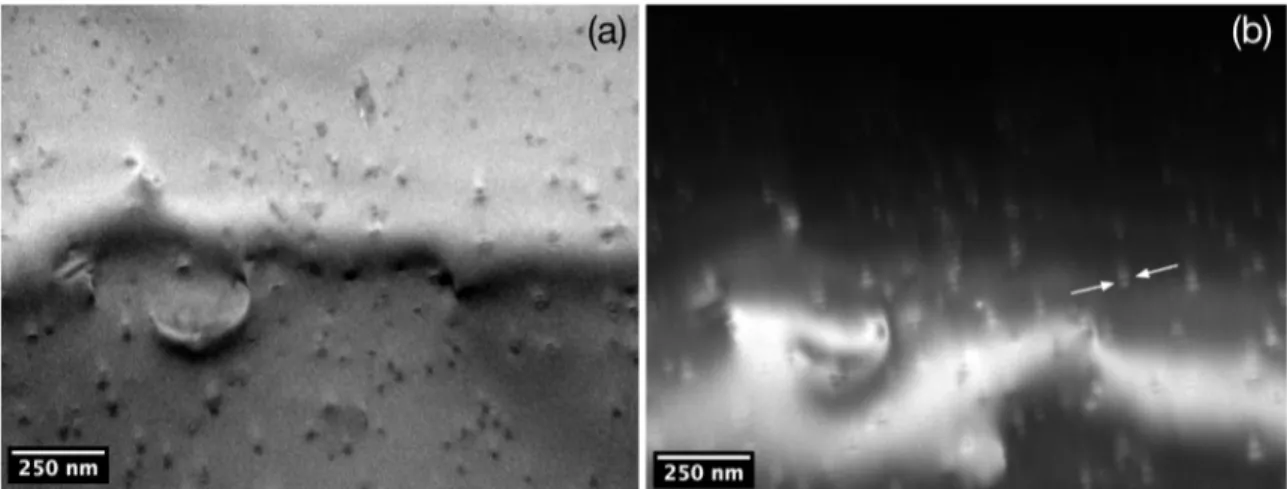
The sample was aged at 700 K for 100 h. It is possible to observe that precipitates present protuberances, possibly due to growth instabilities on solute depleted regions6. In
the studies of Knipling et al.6 and Ness8, instabilities were
observed in solute depleted regions after aging at 698 K and 733 K, respectively.
Growth instabilities do not appear at the center of dendrite branches. This is because this phenomenon occurs
due to solute gradients at the precipitate/matrix interface, as a result of the diference in solid solubility due to the Gibbs-Thomson efect. This diference in solid solubility
occurs when any oscillation (spherical harmonic) perturbs the spherical particle. As at the center of dendrite branches the number density of particles is greater, the overlapping of
its difusion ield reduces solute gradients, thus stabilizing
particle interface30.
/
a
a a
a
2
0 p 0 pd
=
-
+
/
Figure 9. (a) and (b) Bright-ield image of a sample aged at 700 K for 100 h, with Al3Z precipitates, exhibiting the Ashby-Brown
coherency strain contrast
Figure 10. (a) Bright-ield image of an interdendritic region in sample aged at 700 K for 100 h and (b) complementary dark-ield image.
In the present study, no growth instabilities emerged in samples aged at 650 K on particles at the periphery of dendrite branches, as shown in Figure 7c. Aging at lower temperatures is usually associated with the formation of
more interface instabilities, once difusion is slower and the elimination of solute gradients is more diicult30.
4.3.2 Al-0.32Zr Alloy
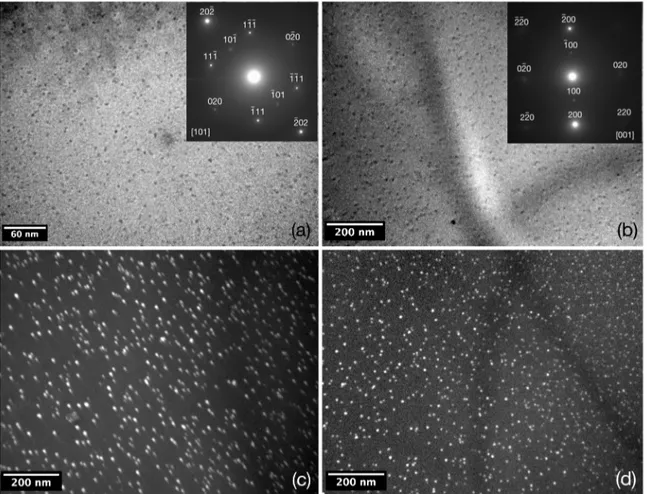
Figure 11a is a bright-ield image of an Al-0.32Zr alloy
aged at 650 K for 100 h. homogeneously distributed spherical Al3Zr precipitates are present, exhibiting 〈r〉 = 3±0.4nm. The SADP of the image indicates the presence of L12-structured Al3Zr particles due to the presence of {110} relections and
the orientation indicates a [110] zone axis. Figure 11b is a micrograph of the center of a dendrite branch of a sample aged at 650 K for 400 h. Its SADP image also indicates the presence of L12-structured Al3Zr precipitates, which exhibit
〈r〉 = 5 ± 1 nm, Figure 11c is its complementary superlattice
dark-ield image, using {100} relections and Figure 11d its axial superlattice dark-ield image with the (100) relection.
The nucleation of Al3Zr particles in the hyperperitectic alloy provided a higher increase in hardening at peak strength condition (100 h at 650K) than in the more dilute alloy, due
to the precipitation of iner particles.
Figure 12a shows the edge of a dendrite branch in sample aged at 650 K for 400 h. It is possible to observe that near the center of the dendrite branch (lower right corner), particles present smaller radius, while towards the edge of the dendrite branch (upper left corner), particles present an increase in radius. Figure 12b, shows the periphery of dendrite branches,
where particles exhibit 〈r〉 = 19 ± 4 nm. In these regions, there are “rod-like” Al3Zr particles, as indicated by arrows. These particles nucleate in solute depleted zones and present L12-structured Al3Zr precipitates6,8.
Figure 13a is a bright-ield micrograph of a sample aged
at 650 K for 400 h at the center of dendrite branches. It is possible to observe L12-structured Al3Zr precipitates near a dislocation. The precipitates present antiphase boundaries - APBs, parallel to each other, as indicated by arrows. Figure
1609 Precipitation Evolution and Modeling of Growth Kinetics of L12-structured Al3Zr Particles in Al-0.22Zr and
Al-0.32Zr (wt.%) Alloys Isothermally Aged
Figure 11. (a) Bright-ield micrograph with SADP of a dendritic region in an Al-0.32Zr alloy aged at 650 K for 100 h and (b) for 400 h, both showing ine Al3Zr L12 precipitates. (c) and (d) are superlattice dark-ield and axial superlattice dark-ield images.
Figure 12. TEM bright-ield micrograph of (a) edge of a dendrite and (b) an interdendritic region in an Al-0.32Zr alloy aged at 650 K for 400 h, exhibiting spherical and rod-like (arrows) Al3Zr L12 precipitates.
also exhibits these structures. Their presence indicates the
beginning of the L12→D023 transition, in which an antiphase
boundary is formed along {100} planes, with a v⃗=a/2〈110〉 dislocation vector14,29,46 and the Al
3Zr precipitate changes its
structure from face centered cubic (metastable) to tetragonal (stable), although its stoichiometry remains unchanged47.
In the present study, no characteristic D023-structured Al3Zr relections were observed in the SADP with APBs,
as {004}, {103} or {105}9. In the work of Knipling et al.6,
Figure 13. Micrographs of an Al-0.32Zr alloy aged at 650 K for 400 h showing precipitates with antiphase boundaries near a dislocation,
(a) bright-ield and (b) dark-ield image (APBs indicated by arrows).
authors identiied the particles as the L12strukturbericht and
the presence of D023 relections is not observed. 4.3.3 Microstructural evolution
Figure 14 summarizes the main measurement results of 〈r〉 for the studied alloys after aging at 650 K. In Figure 14a, there are results for the center of the dendrite branches, while in Figure 14b, the results are from the periphery of the dendrite branches. It is possible to observe that in the later regions 〈r〉 values are bigger than in the former, what is
predicted in Eq 4, using the concentration proiles from Eq.1, which are shown in Figure 15, using the itted values of k0
=1.48 and k0= 1.76 for the Al-0.22Zr and Al-0.32Zr alloys, respectively. It is possible to observe that even in the more dilute alloy, at the center of dendrite branches the predicted composition is almost twice the nominal Zr composition.
Figure 14. Variation of the precipitate mean radii in the studied alloys
at diferent aging conditions in both (a) center and (b) periphery
of dendrite branches.
Figure 15. Solute segregation during solidiication as a function of the solidiied fraction – fs for the Al-0.22Zr and Al-0.32Zr alloys.
The diference in solute content along the dendrite
branches will promote particles with distinct r* (Eq.4).
Results of r* for the Al-0.22Zr and Al-0.32Zr alloys at 650
K are presented in Figure 16. It is possible to observe that at the center of dendrite branches (lower fs values) low r*
occur for both alloys, with the Al-0.22Zr presenting slightly greater r*, resulting from its lower solute content. Towards
the periphery of dendrite branches (higher fs values), r* values
increase progressively reaching values such as 28 nm for the Al-0.22Zr alloy. At a given fs, Zr content is so low, provided no nucleation occurs.
The precipitates at the center of dendrite branches, Al-0.32Zr alloy in Figure 14a, presented an increase in 〈r〉 during aging between 100 and 400 h, although in the Al-0.22Zr alloy precipitate radii remained constant.
Eq.7 shows that the greater Ω, the greater rd for a given temperature and time. As Ω must be greater in the Al-0.32Zr
1611 Precipitation Evolution and Modeling of Growth Kinetics of L12-structured Al3Zr Particles in Al-0.22Zr and
Al-0.32Zr (wt.%) Alloys Isothermally Aged
Figure 16. Critical radius for nucleation at 650 K for the Al-0.22Zr and Al-0.32Zr alloys.
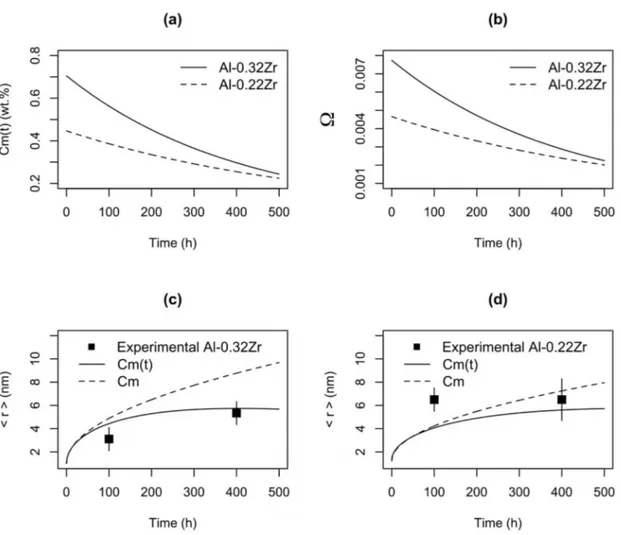
Figure 17. (a) Variation of solute at the center of the dendrite branches during aging at 650 K, (b) variation of Ω during aging, (c) evolution
of precipitate radius in the Al-0.32Zr alloy during aging and (d) variation of precipitate radius with time in the Al-0.22Zr alloy.
in radius is greater than in the Al-0.22Zr alloy at the center of dendritic branches (Figure 14a). In the latter alloy, the
diference in precipitate radii between the center and periphery
of dendrite branches is greater than in the Al-0.32Zr alloy.
Considering the Gibbs-Thomson efect, the solute content in the matrix near the smaller precipitates will be greater than
near the biggest particles30,35. This will create concentration
gradients that lead to solute difusion in the direction of the
largest particles30,35, therefore reducing Ω at the center of
dendrite branches. This diference in solute concentration as a function of particle radius is expressed in Eq. (12)35. This
mechanism is characteristic of coarsening, where volume
difusion controls the process (Lifschitz-Sliozov-Wagner -
LSW theory) (Eq.16), where r0 is the precipitate radius at the onset of coarsening and kr the coalescence rate30,35. In
r
r
k t
rt
30 3
0
-
=
Q
-
V
(16)Figure 17a presents the results for Eq. (10). It is possible to observe that during aging at 650K, the solute content in both the Al-0.32Zr and Al-0.22Zr alloys (full and dashed lines, respectively) decreases with aging time, due precipitation evolution. Besides having a greater Zr concentration, the Al-0.32Zr alloy present a lower interparticle spacing, thus increasing the Zr consumption during aging, for particle growth.
The reduction in Zr content in the matrix, therefore,
reduces the supersaturation at the center of dendrite branches (Figure 17b), reducing the potential for particle growth of the Al-0.32Zr and Al-0.22Zr alloys (Figures 17c and d, respectively).
In Figure 17c, the model (full line, Eq.13) predicts an increase in radius (rm) that is also observed experimentally,
resulting in a low RSS for the Al-0.32Zr alloy (RSS = 1.79). The dashed line Cm is the prediction of particle growth without solute loss due to precipitation. In Figure 17d, the predicted increase in radius is lower than in Figure 17c, largely due to the lower Ω. The experimentally observed precipitate radii presented a negligible increase comparing
with the Al-0.32Zr alloy. The goodness of it reduced due to
the greater residual at 100 h of aging. The RSS in this case is greater: RSS = 7.78. It is possible that in the Al-0.22Zr alloy, the nucleation of larger particles at the periphery of dendrite branches has caused an overall depletion of solute during aging, increasing r*, that, consequently presents a
lower potential for growth.
5. Conclusions
• Microhardness presented greater values after
heat-treatment at 650 K in both alloys, where peak microhardness occurred after 100 h and presented a slight decrease after 400 h. At 650 K
iner L12-structured Al3Zr particles were nucleated,
in comparison with aging at 700K.
• The Al-0.32Zr alloy presented a iner precipitate distribution than the more dilute alloy after aging at 650 K at the center and periphery of dendrite branches; • The diference between 〈r〉 of precipitates at
the center and periphery of dendrite branches is greater in the Al-0.22Zr alloy, due to the lower solute content and greater r* at the periphery of
dendrite branches, this disparity increases during aging possibly due to solute gradients and solute migration in the direction of the larger particles;
• During aging at 650 K of the Al-0.22Zr alloy,
precipitates at the center of dendrite branches presented the same mean precipitate radius at 100 and 400 h, this is because of solute loss for the larger particles at the periphery of dendrite branches that are hindering growth and promoting competitive
growth. At the Al-0.32Zr alloy, both process are possibly occurring, although the supersaturation
is greater, increasing the potential for difusional
growth;
• Due to its sizes, it is possible to infer that L12 -structured Al3Zr precipitates remained coherent until 400 h after aging at 650 or 700 K at the center of dendrite branches, although at the periphery of dendrite branches, after aging at 650 K for 400 h particles presented 〈r〉 = 107 nm, over the threshold value for the loss of coherency;
• The experimental results of the increase in precipitate
radius presented overall goodness of it with the theoretical values for difusional particle growth.
6. Acknowledgments
The authors would like to thank CAPES for the student scholarship, CNPq for the researcher scholarship, CNPq
for inancial support, ALUBAR METAIS E CABOS for materials supply and LCME/UFSC, especially Dr. Eduardo
Isoppo for support in the microstructural analysis.
7. References
1. Booth-Morrison C, Dunand DC, Seidman DN. Coarsening resistance at 400 ºC of precipitation-strengthened Al-Zr-Sc-Er alloys. Acta Materialia. 2011;59(18):7029-7042.
2. Kaufman JG, Rooy EL. Aluminum Casting Alloys. In: Kaufman JG, Rooy EL. Aluminum Alloy Castings: Properties, Processes and Applications. Materials Park: ASM International; 2004. p. 7-20.
3. Zhou WW, Cai B, Li WJ, Liu ZX, Yang S. Heat-resistant
Al-0.2Sc-0.04Zr electrical conductor. Materials Science and Engineering: A. 2012;552:353-358.
4. Knipling KE, Dunand DC, Seidman DN. Nucleation and Precipitation Strengthening in Dilute Al-Ti and Al-Zr Alloys. Metallurgical and Materials Transactions A. 2007;38(10):2552-2563.
5. Knipling KE, Dunand DC, Seidman DN. Criteria for developing castable, creep-resistant aluminum-based alloys - A review. Zeitschrift für Metallkunde. 2006;97(3):246-265.
6. Knipling KE, Dunand DC, Seidman DN. Precipitation evolution in Al-Zr and Al-Zr-Ti alloys during isothermal aging at 375-425 ºC. Acta Materialia. 2007;56(1):114-127.
7. Du XD. Study on ageing and creep of Al-0.1Zr alloy. Materials Science and Engineering: A. 2006;432(1-2):84-89.
8. Ness E. Precipitation of the metastable cubic Al3Zr-phase in
subperitectic Al-Zr alloys. Acta Metallurgica. 1972;20(4):499-506.
9. Ohashi T, Ichikawa R. A new metastable phase in rapidly solidiied
Al-Zr alloys. Metallurgical Transactions. 1972;3(8):2300-2302.
10. Ness E, Billdal H. Non-equilibrium solidiication of hyperperitectic
1613 Precipitation Evolution and Modeling of Growth Kinetics of L12-structured Al3Zr Particles in Al-0.22Zr and
Al-0.32Zr (wt.%) Alloys Isothermally Aged
11. Ryum N. Precipitation and recrystallization in an Al-0.5wt.%Zr-Alloy. Acta Metallurgica. 1969;17(3):269-278.
12. Chaudhury ZA, Suryanarayana C. A TEM study of decomposition behavior of a melt-quenched Al-Zr alloy. Metallography. 1984;17(3):231-252.
13. Knipling KE, Dunand DC. Creep resistance of cast and aged Al-0.1Zr and Al-0.1Zr-0.1Ti (at.%) alloys at 300-400 ºC. Scripta Materialia. 2008;59(4):387-390.
14. Zedalis MS, Fine ME. Precipitation and ostwald rippening in dilute Al Base-Zr-V alloys. Metallurgical Transactions A. 1986;17(12):2187-2198.
15. Hatch JE. Constitution of Alloys. In: Hatch JE, ed. Aluminum: Properties and Physical Metallurgy. Metals Park: American Society for Metals; 1984. p. 25-57.
16. Knipling KE, Dunand DC, Seidman DN. Precipitation evolution in Al-Zr and Al-Zr-Ti alloys during aging at 450-600 ºC. Acta Materialia. 2008;56(6):1182-1195.
17. Zhang Y, Zhou W, Gao H, Han Y, Wang K, Wang J, et al. Precipitation evolution of Al-Zr-Yb alloys during isochronal
aging. Scripta Materialia. 2013;69(6):477-480.
18. Zhang Y, Gao H, Kuai Y, Han Y, Wang J, Sun B, et al. Efects of Y additions on the precipitation and recrystallization of Al-Zr
alloys. Materials Characterization. 2013;86:1-8.
19. Booth-Morrison C, Seidman DN, Dunand DC. Efect of
Er additions on ambient and high-temperature strength of precipitation-strengthened Al-Zr-Sc-Si alloys. Acta Materialia. 2012;60(8):3643-3654.
20. Vlach M, Cizek J, Melikhova O, Stulikova I, Smola B, Kekule T, et al. Early Stages of Precipitation Process in Al-(Mn-)Sc-Zr Alloy Characterized by Positron Annihilation. Metallurgical and Materials Transactions A. 2015;46(4):1556-1564.
21. Lefebvre W, Masquelier N, Houard J, Patte R, Zapolsky H. Tracking the path of dislocations across ordered Al3Zr nano-precipitates in three dimensions. Scripta Materialia. 2014;70:43-46.
22. ASTM International. ASTM E348 - Standard Test Method for Knoop and Vickers Hardness of Materials. West Conshohocken: ASTM International; 2011.
23. Ünlü N. Preparation of high quality Al TEM specimens via a double-jet electropolishing technique. Materials Characterization. 2008;59(5):547-553.
24. Garcia A. Redistribuição de Soluto. In: Garcia A. Solidiicação: Fundamentos e Aplicações. 2ª ed. Campinas: Unicamp; 2007. p. 57-80.
25. Barbetta PA, Reis MM, Bornia AC. Correlação e Regressão. In: Barbetta PA, Reis MM, Bornia AC. Estatística para Cursos de Engenharia e Informática. Florianópolis: Editora UFSC;
2010. p. 308-346.
26. Robson JD, Prangnell PB. Dispersoid precipitation and process modelling in zirconium containing commercial aluminium alloys. Acta Materialia. 2001;49(4):599-613.
27. Clouet E, Nastar M, Sigli C. Nucleation of Al3Zr and Al3Sc
in aluminum alloys: from kinetic Monte Carlo simulation to classical theory. Physical Review B. 2004;69(6):064109.
28. Abbaschian R, Abbaschian L, Reed-Hill RE. Appendices. In: Abbaschian R, Abbaschian L, Reed-Hill RE. Physical Metallurgy Principles. 2nd ed. Stamford: Cengage Learning; 2009. p. 731.
29. Chen YC, Fine ME, Weertman JR. Microstructural evolution and mechanical properties of rapidly solidiied Al-Zr-V alloys at high
temperatures. Acta Metallurgica et Materialia. 1990;38(5):771-780.
30. Doherty RD. Difusive transformations in the solid state. In: Cahn
RW, Haasen P, eds. Physical Metallurgy. 4th ed. Amsterdam: Elsevier
Science; 1996. p. 1363-1505.
31. Porter DA, Easterling KE. Difusion. In: Porter DA, Easterling
KE. Phase Transformations in Metals and Alloys. 2nd ed. London:
Chapman & Hall; 1992. p. 60-109.
32. Hirano K, Fujikawa S. Impurity difusion in aluminum. Journal of Nuclear Materials. 1978;69-70:564-566.
33. Shewmon PG. Difusion Equation. In: Shewmon PG. Difusion in Solids. London: McGraw-Hill; 1963. p. 1-39.
34. Guo Z, Sha W. Quantiication of Precipitation Hardening and Evolution
of Precipitates. Materials Transactions. 2002;43(6):1273-1282.
35. Porter DA, Easterling KE. Difusional Transformations in Solids.
In: Porter DA, Easterling KE. Phase Transformations in Metals and Alloys. 2nd ed. London: Chapman & Hall; 1992. p. 263-313.
36. Medina SF, Ruiz-Bustinza I, Robla J, Calvo J. Theoretical and
Experimental Nucleation and Growth of Precipitates in a Medium
Carbon-Vanadium Steel. Metals. 2017;7(2):45.
37. Allen CM, O'Reilly KAQ, Cantor B, Evans PV. Intermetallic phase selection in 1XXX Al alloys. Progress in Materials Science. 1998;43(2):89-170.
38. Desch PB, Schwarz RB, Nash P. Formation of metastable L12 phases
in Al3Zr and Al-12.5%X-25%Zr (X = Li, Cr, Fe, Ni, Cu). Journal of the Less Commom Metals. 1991;168(1):69-80.
39. Hori S, Saji S, Takehara A. Metastable phase and grain reinement in rapidly solidiied Al-Zr alloys. Journal of Japan Institute of Light Metals. 1981;31(12):793-797.
40. Knipling KE, Seidman DN, Dunand DC. Ambient- and high-temperature mechanical properties os isochronally aged Al-0.06Sc, Al-0.06Zr and Al-0.06Sc-0.06Zr (at.%) alloys. Acta Materialia. 2011;59(3):943-954.
41. Russel AM, Lee KL. Strengthening Mechanisms. In: Russel AM, Lee KL. Structure-Property Relations in Nonferrous Materials. Hoboken: John Wiley & Sons; 2005. p. 28-37.
42. Zuo JM, Mabon JC. Web e-MAPS, On-line Software for Electron
Difraction Analysis. Available from: <http://emaps.mrl.uiuc.edu>.
Access in: 8/8/2017.
43. Fultz B, Howe JM. Difraction Contrast in TEM Images. In: Fultz B,
Howe JM. Transmission Electron Microscopy and Difractometry of Materials. 3rd ed. New York: Springer; 2008. p. 377-422. 44. Iwamura S, Miura Y. Loss in coherency and coarsening behavior
of Al3Sc precipitates. Acta Materialia. 2004;52(3):591-600. 45. Zedalis M, Fine ME. Lattice parameter variation of Al3 (Ti, V,
Zr, Hf) in Al-2AT.% (Ti, V, Zr, Hf) alloys. Scripta Metallurgica. 1983;17(10):1247-1251.
46. Ryum N. Precipitation in an Al-1.78 wt % Hf alloy after rapid