w w w . a j e r . o r g
Page 80
American Journal of Engineering Research (AJER)
e-ISSN : 2320-0847 p-ISSN : 2320-0936
Volume-03, Issue-03, pp-80-90
www.ajer.org
Research Paper Open Access
Influence Of Silicon Addition And Temperature On The Cyclic
Oxidation Behaviour Of Sintered Hot Forged High Density Cu
–
8.5% Al Alloy
1
(Mrs.) S. K. Pandey, &
2K. S. Pandey
1Director, National Institute of Technology, Puducherry, Karaikal-609 605, India.
2
Professor, Department of Metallurgical & Materials Engineering, National Institute of Technology, Tiruchirappalli-620 015, Tamil Nadu, India.
Abstract: - Cyclic oxidation experiments were carried out to generate experimental data for Cu–8.5%Al sintered hot forged high density parts when alloyed with silicon in air at elevated temperatures. Silicon contents were kept at 0.90 and 1.8 per cent respectively. Homogeneously blended powders of Cu-8.5%Al, Cu-8.5% Al– 0.9% Si and Cu–8.5%Al–1.8% Si were used separately to prepare compacts of 1.1 initial aspect ratio with diameter being 19.0 mm in the density range of 85±1 per cent of theoretical by applying pressure in the range of 360±10 MPa and taking pre weighed powder blends. Compacts were sintered in an argon atmosphere at 1223 ±10K and forged to thin discs of 5mm thickness and oil quenched. Discs were machined to 2.10 ± 0.01 mm thickness with 25.0 ± 1 mm diameter. Thoroughly cleaned discs were subjected to cyclic oxidation studies at 573,673 and 773 K respectively. Weight gains were measured at an interval of 30 minutes and the oxidation studies were carried out upto the time till the last three readings showed no weight gains. Experimental data have been critically analyzed for various oxidation mechanisms and were found to conform to a semi-logarithmic equation of the form: Wg = A1 log (A2t +A3) where, „A1‟, A2‟ and „A3‟ are empirically determined
constants and Wg is the weight gain with„t‟ representing time.
Keywords: - Blended,cyclic, elevated, generate, high density, .mechanism, oxidation, weight gains
I. INTRODUCTION
It is well established and universally accepted fact that almost all metals tend to form simple or complex oxides at elevated temperatures in air and other oxidizing environments. However, in industries, machinery components are often exposed to high temperature environments where they get oxidized. Thus, the study of oxidation behaviour of such materials is increasingly becoming important, and, therefore, there is an immense need to invent materials for which the oxidation rates are at the bare minimum. In addition to low rates of oxidation, they are expected to exhibit high strengths at elevated temperatures [1-9]. It is reported [10–14] that the oxidation resistance of aluminium bronze is superior to that of any other copper based alloys and that only a very thin oxide film is formed in air temperatures as high as 773K. Since these alloys have good creep strength and elevated temperature fatigue properties, they are considered to be applicable up to temperatures as high as 673K. Main examples in this field include turbo - compressor blades, electrical heating elements sheaths and valve sheets for high performance petrol engines and clamps for resistance – welding machines.
w w w . a j e r . o r g
Page 81
porous). The formation of protective film largely depends upon various factors such as the rate of flow of oxygen or air in to the reaction chamber, time of exposure of the specimen, temperature at which the oxidation studies are conducted, surface finish of the specimens, pits or surface scratch or other tool marks on the specimen, therefore, the affinity of the metal to oxygen rich environment attacks on the exposed metal surface. Apart from the above, the other parameters such as the presence of impurity, addition of alloying elements and the crystal geometry of the metal do affect the oxidation behaviour of metals/alloys [1-9].
Thickness of the oxide film formed on the metal surface is an important factor to be considered. Based on the thickness of the oxide film, Mott proposed the theory of “Thin Film Formation”, and Wagner proposed the theory of “Thick Film Formation”. Generally, thin films are treated as protective provided they are uniform, continuous and strongly adherent on the surface. However, the thick film formation on the metal surface can result in multiple cracks due to the existence of differential stresses which are generated due to the differing thermal conductivities of the metal and its own oxide. Cracks in the oxide layer expose the interface of the virgin metal to the oxidizing environment beneath the oxide layer [16, 17]. This result in the growth of oxide layer inward and, thus, thickens the oxide film. In the event, the formed oxide layer is porous and is able to permeate oxygen through it, the oxidation process would continue and more and more metal would be oxidized. However, the growth of oxide layer below the first layer would definitely create tensile stresses at elevated temperatures of oxidation due to differential heat conducting capabilities and due to differing coefficients of expansion of the metal and its own oxides. It is, therefore, obvious for the residual stresses to accumulate and once this accumulation approached beyond a certain threshold value, the formed oxide layer would rupture Oxidation behaviour of dense copper products have been comprehensively investigated by various groups of investigators [15-20] and the mechanisms of oxidation have been well established [21-27]. But, the oxidation behaviour of copper based P/M products need to be investigated as the same bears a strong potential for industrial application. A single report on the same exists which is reported elsewhere [1]. Hence, the present investigation has been planed to generate experimental data as a most preliminary research work in this regard on Cu – 8.5% Al with and without the addition of Silicon produced via P/M route to almost 100% dense product.
II. EXPERIMENTAL DETAILS
II.1 Materials Required
Electrolytic grade of copper, aluminum, aluminium-silicon eutectic and reduced silicon powders, each
Table 1 Powder Characteristics of Copper, Aluminium, Al-Si Eutectic and Silicon Powders
in the particle size range of -150 +37 µm were procured from M/S The Metal Powder Company Limited, Thirumangalam, Madurai, Tamil Nadu, India. Purities of copper, aluminium and silicon powders were chemically analyzed and found to correspond to 99.93, 99.71 and 99.5% respectively. The basic characteristics of these powders are listed in Table 1 and sieve size analyses of all required powders are given in Table 2 respectively.
Table 2 Sieve Size Analysis of Copper, Aluminium, Al-Si Eutectic and Silicon Powders Property Copper Aluminium Al- Si Eutectic Silicon
Flow rate , S/100g Very sluggish 63 49 45
Apparent density, g/cc 1.396 1.055 1.310 0.618
Compressibility, g/cc at a
w w w . a j e r . o r g
Page 82
II.2 Compact Preparation
Compacts of 27.5 mm diameter and 9.2mm height of Cu – 8.5%Al, Cu-8.5%Al – 0.9%Si and Cu-8.5%Al-1.8%Si homogeneously blended powders were separately prepared on a 1.0MN capacity hydraulic press using suitable die, punch and bottom insert assembly in a pressure range of 360±10MPa to yield the compact densities in the range of 85±1 per cent of theoretical by taking accurately pre-weighed powder blends for each compact.
II.3 Application of Indigenous Ceramic Coating
Indigenously developed [28] ceramic coating was applied over the entire surfaces of all the compacts and the coating was allowed to dry under ambient conditions for a period of 16 hours. These coated compacts were recoated in the direction of 90º to the previous coating and were allowed to dry once for again for a further period of 16 hours under the aforementioned conditions.
II.4 Sintering and Hot Upset Forging
Ceramic coated compacts were sintered in an electrically heated muffle furnace in the uniform temperature zone in the range of 1223±10K for the period of 100 minutes. Once sintering schedule was completed , the sintered performs of all compositions were hot upset forged to pre – determined height strain so as yield the final theoretical density to the tune of 99.7±0.1 per cent on a 1.0MN capacity friction screw press using the flat hot die assembly. Forged specimens were cooled in still air. Immediately after cleaning the forged discs, the density was measured using Archimedian principle and the same in all cases was found to be 99.7% plus. Procedure for obtaining the density is described elsewhere [29].
II.5 Specimen Preparation for Oxidation Studies
Oxidation studies demand the scratch free specimens as the presence of scratches changes the expected oxidation rates abruptly and thus the oxidation mechanisms get affected adversely. Hence, every possible attempt was made to prepare scratch free specimens. Disc shaped specimens of 14mm dia and 1.75 mm thick were carefully machined and ground to 5μm surface finish. Ground specimens were annealed at 573 K in an organ atmosphere for a period of 45 minutes and cooled to room temperature inside the furnace chamber itself in the stream of argon by switching off the furnaces. Prior to subjecting the specimens to oxidation studies, the entire specimen surfaces were thoroughly cleaned by acetone so as to remove grease and any other unwanted adhered impurities. Measurement of surface area and the weight of each specimen were carried out prior to subjecting them to cyclic oxidation studies.
II.6 Conducting Cyclic Oxidation Experiments
Cyclic oxidation studies were carried out for each of the prepared specimens and weight gains were recorded for a fixed period of exposure at a given temperature. Further experiments on oxidation were stopped once the last three consecutive readings remained consistently constant. Weight measurements were carried out by using Adair and Dutt model A-180 single pan electronic balance of sensitivity of 10-4 g [30]. Oxidation experiments were carried out in an electric muffle furnace where the temperature of oxidation was maintained with in the range of 573 ±10K, 673±10K and 773 ± 10K respectively. Thus, three specimens from each composition were exposed to oxidation studies at the above temperatures separately.
III. RESULTS AND DISCUSSION
Oxidation curves are plotted between (Wt. gain / area, i.e., g/m2) and time in seconds for each composition and temperature of oxidation. Such oxidation curves can be described by a simple or inverse logarithmic, a cubic, a parabolic, a linear or an asymptotic equation/s. Among the above equations which one of them will be governing equation for the relation between weight gain and the time would mainly depend upon the oxide scale thickness formed on to the metal surface at a given time and temperature. However, the changeover from one mechanism to another mechanism is probable, and in such events, oxidation mechanism followed could be represented by two or more than two mechanisms. Hence, extra precautions must be taken while establishing the oxidation mechanism/s.
w w w . a j e r . o r g
Page 83
plots between weight gain (Wg) and time (t) are the most convenient technique to evaluate the exponent (m) of
Wg which acquires the values of 1, 2 and 3 for linear, parabolic and cubic oxidation rates for equations of the
form:
= Km t + Cm --- (1)
Where, Km and Cm are empirically determined constants. But, the scales in such plots get highly compressed with increasing values of „Wg‟ and „t‟. Due to this reason alone, such plots tend to demonstrate a linear
relationship between log10 (Wg) and log10 (t), and, therefore, the changes in rate equations and mechanisms are
not identified distinctly. Hence, such plots demand great care to be exercised while interpreting the rate equations from double logarithmic plots. Therefore, such plots must be drawn only to confirm the results obtained by other types of graphical representations. Such plots are extremely good to summarize data covering large temperature ranges and time intervals and not for establishing the oxidation mechanisms.
III.1 Characteristic Nature of Oxidation Curves
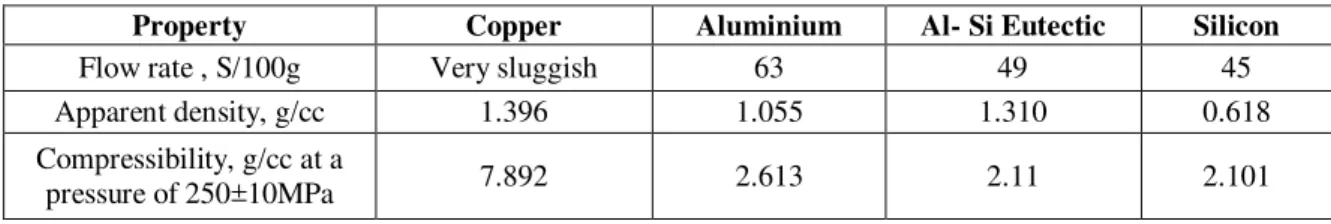
Oxidation data obtained at 573, 673 and 773K for Cu-8.5%Al, Cu-8.5%Al-0.9%Si and Cu-8.5%Al-1.8%Si
Figure 1 Effect of Oxidizing Temperature on the Relationship between Weight Gain (Wg/m2) and Time (t) for Cu-8.5% Al With and Without Silicon Addition.
are plotted in figs. 1(a), 1(b) and 1(c) respectively. Curves in these plots are characteristically quite similar in nature to each other except the rates of oxidation at elevated temperatures had been quite pronounced. Since none of these curves conformed to straight line configuration and, therefore, oxidation rates did not conform to a linear mechanism.
w w w . a j e r . o r g
Page 84
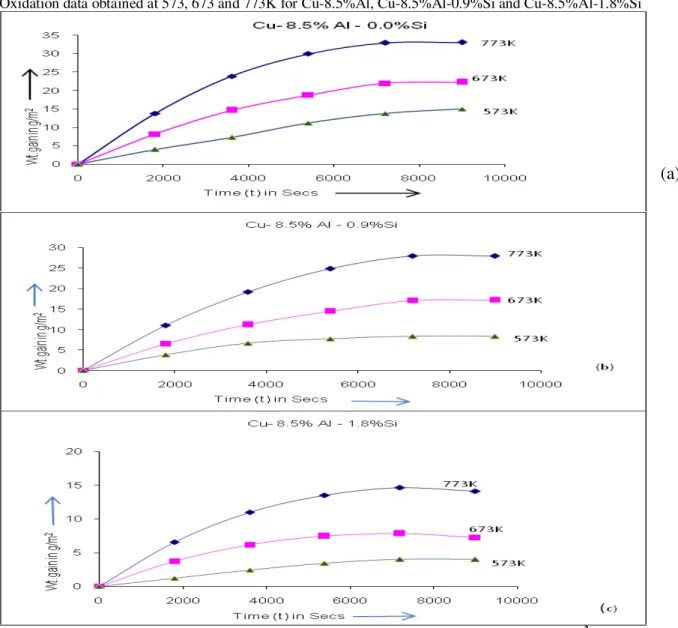
III.3 Effect of Silicon Addition on Oxidation Behaviour:
Figs. 2(a), 2(b) and 2(c) are drawn between weight gain(g/m2) and time (t in Secs) to exhibit the effect of silicon addition up to 1.8 per cent in Cu-8.5%Al alloy on oxidation behaviour. These figures drawn at 573, 673 and
Figure 2 Effect of Silicon Addition on the Oxidation behaviour of Cu-8.5%Al Sintered Hot Forged (99.7%Th.Dense)
and 773K shows that the rate of oxidation was decreased as the silicon content was raised up to 1.8 per cent irrespective of the temperature of oxidation. However, the base alloy Cu-8.5%Al exhibited the least resistance to oxidation compared to the other alloys containing silicon. Presence of silicon in Cu-8.5%Al alloys promotes the formation of thin and smooth oxide layer which was found to be highly protective and quite adherent to specimen surfaces. This fact was evident on two grounds-firstly, the weight gain per unit area had been on lower side compared to the weight gain per unit area for Cu-8.5%Al alloys, and, secondly, the oxidation in later stages had proceeded in a very much reduced rate and finally the oxidation ceased for all practical purposes. Therefore, the oxidation studies carried out for a same length of time at any given tested temperature must have formed
(a)
(b)
w w w . a j e r . o r g
Page 85
Wg2 for 0% Si
0 200 400 600 800 1000 1200
0 2000 4000 6000 8000 10000
Time in Secs
Wg
2 in
g
2 /m
4
773K
673K
573K
Wg2
for 0.9% Si
0 100 200 300 400 500 600 700 800 900
0 2000 4000 6000 8000 10000
Time in Secs
Wg
2 in
g
2 /m
4
773K
673K
573K
Wg2
for 1.8% Si
0 50 100 150 200 250
0 2000 4000 6000 8000 10000
Time in Secs
Wg
2 in
g
2 /m
4
673K
573K
Figure 3 Relationship between weight gain square and time (t) for Cu-8.5%Al with or without silicon addition for sintered hot forged (close to Th. density) at different temperatures
lower amounts of oxides in case of silicon added 8.5%Al alloys compared to no silicon contained Cu-8.5%Al alloys and hence providing a direct logical evidence that the oxide formed is thin layer protective and strongly adherent to the metal surface and hence, it is, established that the silicon addition in Cu-8.5%Al alloys is highly effective and beneficial induce oxidation resistance to the aforesaid alloys. These findings are in conformity with other research reports described elsewhere [15, 18].
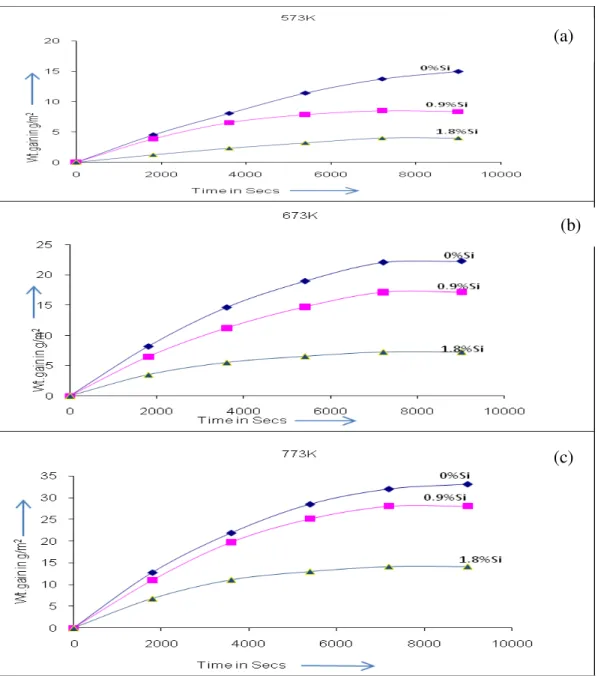
Figs. 3(a), 3(b) and 3(c) are drawn between the square of weight gain per unit area as Wg2 (g2/m4) and time„t‟ in seconds for all the three compositions and all the three temperatures of oxidation with or without the addition of silicon. Figs 3(a), 3(b) and 3(c) show the curves corresponding to Cu-8.5%Al, Cu-8.5%Al-0.9%Si and Cu-8.5%Al-1.8%Si respectively and none of the curves in these plots exhibit a linear behaviour and hence the oxidation mechanism could not be conformed to a parabolic rate law.
(a)
(b)
w w w . a j e r . o r g
Page 86
573K 0 5 10 15 20 25 30 353 3. 5 4 4. 5
lo g (t)
W g in g /m 2
0. 0% S i
0. 9% S i
1. 8% S i
673K
0 5 10 15 20 25 30 353 3. 5 4 4. 5
lo g (t)
W
g
in
g
/m
20. 0% S i 0. 9% S i 1. 8% S i
773K
0 5 10 15 20 25 30 353 3. 5 4 4. 5
lo g (t)
W
g
in
g
/m
20. 0% S i 0. 9% S i 1. 8% S i
Figure 4 Relationships between Weight Gain Vs Log (t)
Fig. 4 has been drawn between weight gain (g/m2) and log10 (t) for all the alloys investigated in the
present study. The plots are drawn in figures 4(a),4(b) and 4(c) respectively. The curves drawn in these figures are found to be represented as straight lines in one segment. Thus, it is, obvious that the rate equation followed is well represented by the logarithmic nature of equation of the form.
Wg=A1log10 (A2t+A3) --- (2)
Where, A1, A2 and A3 are empirically determined constants. These constants are found to depend upon the
compositions of the system and the temperatures of oxidation considered.
In the present investigation two significant methods have been employed to evaluate these constants, namely, A1, A2 and A3 respectively.
III.4 Evaluation of Logarithmic Constants
Method-I
Since at time t = 0, Wg = 0, and, therefore, irrespective of the value of constant A1, the constant A3 = 1, so as to
fulfill the conditions, i.e., log10 (1) =0. The calculated constants are reported in Table-II.
(a)
(b)
w w w . a j e r . o r g
Page 87
Table 3 Logarithmic Rate Constant by Using Method
Systems
Temp. of oxidation
, K
Time Int. of Validity, S.
Rate Constants Wg(m)
g/m2
Wg(c)
g/m2 % error A1 A2*10-3 A3
Cu-8.5%Al 0.0%Si
573 0-9000 19.15 0.54754 1.0 15.0 14.85844 -0.944 673 0-9000 21.429 1.0574 1.0 14.65 14.611 +0.278 773 0-9000 28.125 1.7685 1.0 32 31.936 -0.200
Cu-8.5Al-0.9%Si
573 0-9000 6.48 2.58932 1.0 7.55 7.617775 -0.89765 673 0-9000 15.0 10.0385 1.0 14.01 13.78553 -1.60 773 0-9000 26.56 1.4988 1.0 28.01 28.46014 +1.610
Cu-8.5Al-1.8%Si
573 0-9000 4.687 0.9284 1.0 4.01 4.1509 +3.513 673 0-9000 3.125 28.879 1.0 7.25 7.2494947 -0.00073 773 0-9000 6.896 13.76 1.0 14.13 13.692223 -3.0982
Wg (m) = Measured Weight; Wg (c) = Calculated Weight, and, % error = [(Wg(c)-Wg (m))/Wg(c)]*100
Method-II
The characteristic curves are well represented by the logarithmic equation of the form: Wg= A1log10 (A2t+A3) --- (2)
It is, quite possible that in situations where A3 cannot be taken to unity and also cannot be conveniently adjusted
to this value, then the following approach is likely to lead to the evaluation of these constants A1, A2 and A3
respectively. Now differentiating equation (2) w.r.t., time„t‟, the following can be obtained.
(Wg) = (A1A2) / (A3t+A2) --- (3)
Hence, [1/( Wg)] = (t/A1) +(A3/A1A2) ---(4)
Or, {1/( (Wg))} = Qt + R --- (5)
Where, Q = (1/A1) and R = (A3/A1A2).However, the oxidation rates at various exposure times are possible to be
determined from the empirical oxidation time curves. The reciprocals 1/ (d/dt) Wg of these oxidation rates can
be plotted against the corresponding exposure times, t‟ and from these linear plots the values of „Q‟ and „R‟ are
determined. Utilizing the values of „Q‟ and „R‟, the rate constant values of „A1‟, „A2‟ and „A3‟ are calculated. Several pairs of „Wg‟ and time„t‟ can be read from oxidation time curves and a value of A3 is determined from
each pair and is averaged out. Calculation of A3 is done as under:
log10 (K3) = Wg Q+ log10 (Q/R+1) --- (6)
From the mean value of A3, A2 is found out by:
A2 = (Q/R) A3 --- (7)
Using the mean values of A2 and A3, A1 can be empirically determined and same are reported in Table 4.
III.5 Determination of Rate Constants
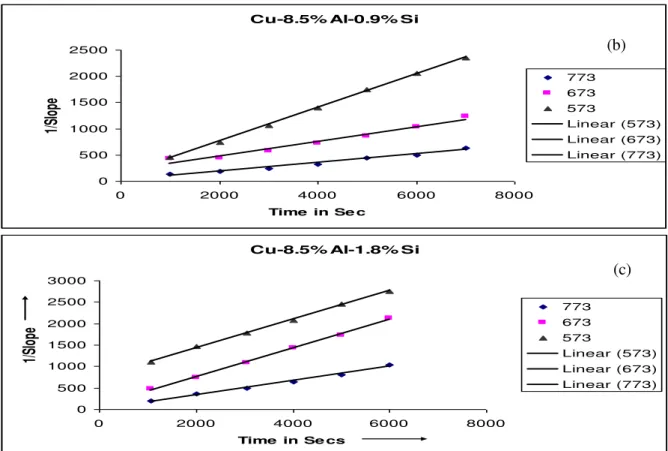
Figs. 5(a), 5(b) and 5(c) are drawn between [1/(dWg/dt)] and time ,t for Cu-8.5%Al,
Cu-8.5%Al-0.9%Si and Cu-8.5%Al-1.8%Si respectively. These plots are basically drawn to evaluate the desired constants, A1, A2 and A3 slops
Cu-8.5%Al
0 200 400 600 800 1000 1200
0 2000 4000 6000 8000
Time in Se cs
1/S
lop
e
773 673 573
Linear (773) Linear (673) Linear (573)
w w w . a j e r . o r g
Page 88
Cu-8.5% Al-0.9% Si0 500 1000 1500 2000 2500
0 2000 4000 6000 8000
Time in Se c
1/
Sl
op
e
773
673 573
Linear (573) Linear (673)
Linear (773)
Cu-8.5% Al-1.8% Si
0 500 1000 1500 2000 2500 3000
0 2000 4000 6000 8000
Time in Se cs
1/
Sl
op
e
773 673
573
Linear (573)
Linear (673) Linear (773)
Figure 5 plots between slope inverse and time (t) during oxidizing of cu-8.5%Al alloys with and without silicon addition at different temperatures
of these lines provided different values of 1/A1 for a given composition and the temperature of
oxidation where as the intercepts yielded the values of A3/A1A2 and the values of A3 was calculated from
equation(6). The values of these constants A1, A2 and A3 are listed in Table 4. Once an appropriate constant are
fed into the logarithmic rate equation, the exact empirical relationships for each of these alloys can be obtained. However , the addition of silicon to Cu-8.5%Al alloys had the beneficial effects on oxidation mechanisms of sintered and hot forged high density copper based P/M alloys even in environments where oxidizing conditions prevail.
Comparing tables 3 and 4 carefully, it is found that method-I is quite sound compared to method-II in estimating the logarithmic rate constants, A1, A2 and A3. This fact is validated by the fact that in couple of
instances only, the error recorded was beyond 5% where as method-II involved errors in many cases beyond 5%. Therefore, method-I is found to be more appropriate in evaluating the logarithmic rate constants, i.e., A1, A2
and A3 respectively.
Table 4 Logarithmic Rate Constants Using Method-II
w w w . a j e r . o r g
Page 89
Wg(m) = Measured weight in g/m2
Wg(c) = Calculated weight in g/m2
%error = [(Wg (m) - Wg(c)/ Wg (m)]*100
IV. CONCLUSIONS
Based upon the experimental data, calculated parameters and various plots drawn assess the mechanism of oxidation of Cu-8.5%Al with and without silicon addition (maximum up to 1.8%), the following major findings have emerged:
1.Basic characteristic features of the oxidation curves for Cu-8.5%Al with and without silicon addition (0.0%, 0.9% and 1.8% are quite similar to each other in the temperature range of 573 to 773K. the rate of oxidation was found to increase initially, but in the final stages of oxidation, the oxidation has ceased as the oxide layers formed acted as protective and impermeable, and, hence, no oxidation.
2.Addition of silicon content (0.0% to 1.8%) in Cu-8.5%Al alloys was beneficial as the same offered as it formed strongly adherent, impermeable to oxygen and thus protective oxide layer over the alloy surfaces when exposed to elevated temperature in the air atmosphere.
3.None of the investigated systems exhibited linear or parabolic rate equations at any of the oxidizing temperatures, namely, 573, 673 and 773K respectively.
4.Experimental data obtained on oxidation behaviour of Cu-8.5%Al-1.8%Si alloy at all temperatures of oxidation conformed to the rate equation of the form; Wg = A1log10(A2t+A3) where , A1, A2 and A3 are found
to be logarithmic constant which are empirically determined. Further Wg is the weight gain at time„t‟.
However, the oxidation mechanisms at all temperatures for Cu-8.5%Al and Cu-8.5%Al-0.9%Si though followed the semi-logarithmic rate equations and altered only after a certain length of time even through the mechanism remained represented by the semi-logarithmic rate equation.
5.Two different techniques of evaluating logarithmic rate constants were employed and it was established beyond any doubt that the first method was more effective compared to the second method because the error involved was well within the limits of ± 2.5% leaving aside exceptional cases where error percentage reached was beyond 5 per cent. However, the second method even though yielded errors on the higher side is recommended to be used when the first method virtually fails to accept the value of A3 =1.0.
Summarizing the results and subsequent analysis, it is, established beyond any doubt that the Cu-8.5%Al-1.8%si alloy can be safely employed in air environment in the temperature range of 573K to 773K due to its highly protective, adherent and impermeable nature of the oxide layers formed on the alloy surface, and, hence, this alloy can be used as a component for equipment etc. which might be subjected in the above temperature range.
REFERENCES
[1] G.P.Maheswari, T.Srinivasa Rao and K.S.Pandey, “Oxidation Behaviour of Sintered Deformed Copper
and Aluminium Admixed Copper Performs in Air”, Quarterly Int. J. of Powder Metall., Sci. and
Technology, Vol.2, No.2, 1991, pp.43 – 52.
[2] S.K.Sridhar, R.Nagalakshmi and K.S.Pandey, “High Temperature Cyclic Oxidation of AISI 301 and 304
Stainless Steels in Air”, Engineering Today, Vol. 4, No. 1, January 2002, pp.16-19.
[3] O.Grinder and U.Ericson, “Low Temperature Oxidation of Inert Gas Atomized Steel Powder”, Mod. Dev. in Powder Metall., Ed. By Edward N. Aqua and Charles I. Whitman 1984, Vol.10, pp.295- 330. [4] I.D.Kazarinova, V.A.Arlanmbekov and K.M.Gorbunova, “High Temperature Oxidation of Silicon”, -
High Temperature Corrosion and Methods of Its Control – Part II, High Temperature Oxidation of Metals and Alloys, Ed. By A.V.Byalobzhe Skin, Yu. N.Golovanav, 1986, pp.77-89.
[5] P.Aravindan and K.S.Pandey, “Effect of Silicon Addition on the Oxidation Mechanism of Cu - 6.7%Al
Sintered But Hot Forged Alloys in Air”, Adv. in Powder Metall., & Particulate Materials, 1998, Vol.3, Part – 9, pp. 9.79 – 9.94.
[6] Haroum Hindan and David P.Whittle, “Amelioration of Alloy Oxidation Behaviour of Minor Additions
of Oxygen Active Elements”, Corrosion, Microstructure and Metallographic, Ed. By Derek
O.Northwood, William E.White and Gearge F.Vander Voort, Microstructural Science, Vol.12, 1985, Proceedings of the 16th Annual Technical Meeting of Int. Metallographic Society, pp. 203 – 230.
[7] R.C.Lobb and H.E.Evans, “Truncation of the Distribution Function of Pit Depths during High
Temperature Oxidation of a 20Cr Stainless Steel,” Plant Corrosion, Ed. by J.E. Struff and J.R.Nicholls,
1987, 275-288.
[8] V.F.Zelenskii and I.A. Petel‟s guzov, “The Kinetics and Mechanism of Oxidation of Magnesium -
w w w . a j e r . o r g
Page 90
[9] S. K. Pandey and K.S. Pandey, “Oxidation Behaviour of Sintered High Density Cu-2.5 % Al Alloys,” Engineering Today, Vol.4, No.1, Jan 2002, pp.12-15.
[10] P.J. Macken and A.A Smith, “The Aluminium Bronzes Properties and Production Process,” Published by Copper Dev, Association, London School Edition, 1986, No.31.
[11] H.Okamoto, “Metal Hand Book Alloy and Phase Diagram”, 1992.
[12] J.H. Cairns, “Technology of Heavy Non-Ferrous Metals and Alloys,” Published by London George Newnes Limited, 1967, pp. 192-207.
[13] ASM Committee on Copper and Copper Alloys, “Introduction to Copper and Copper Alloys,” Metals Hand Book, The Material Section, Vol.2, 1990, pp. 239-245.
[14] L.L. Shreir, “Copper and Copper Alloys.” Corrosion, Vol.1, Metal/Environment Reactions, 1979, pp. 4.33-4.67.
[15] J.Sienko Michell and A. Robert Plane, “Chemistry,” McGraw Hill Int. Book Company, Fifth Edition, 1984.
[16] T.N. Rohdin, J. of American Chemical Society, Vol.72, 1950. p. 5102. [17] T.N. Rohdin, J. of American Chemical Society, Vol.73, 1951 p. 3143.
[18] D.P. White, D.J.Evan, D.B.Scully and G.C. Wood, Actamet, Vol.15, 1967 p.14. [19] R.F. Tycote, J. of Metals, Vol.78, 1950, p. 259.
[20] R.F. Tylcote, J. of Institute of Metals, Vol.81, 1953, p. 681.
[21] A.Ronquist and H.Fischemeister, J. of Metals, Vol.89, 1960, p. 681.
[22] F.W.Young, J.V. Catchart and A.T. Gwathmey, Acta Metall., Vol.5, 1957, p. 574. [23] E.A. Gulbransen and W.S. Wysong, J. of Physical Chemistry, Vol.51, 1947, p. 1087. [24] H. Nishmma, J. of Minerals and Metall., Vol.9, 1938, p. 655.
[25] C.G. Wood and F.H. Science and Technology, Vol.3, 1987, p. 519.
[26] D.W. Bridge, J.P. Baur and W.M. Fassel, J. of Electrochemical Society, Vol.103, 1956, p. 475. [27] W.E. Cambell and U.B. Thomas, Trans. Electrochemical Society, Vol.81, 1942, p. 305.
[28] K.S.Pandey, “Indigenously Developed Ceramic Coating,” Regional Engg., College, Tiruchirappalli-620015, TamilNadu, India.
[29] K.H. Moyer, Int. J. on Powder Metall., and Powder Technology, Vol.15, 1979, p.33.