Investigating atmospheric corrosion behavior
of carbon steel in coastal regions of Mauritius
using Raman Spectroscopy
B. Yashwansingh R. Surnam1, Cheng-Wei Chui2 Huaping Xiao2,Hong Liang2
1
Mechanical and Production Engineering Dept., Faculty of Engineering, University of Mauritius, Reduit, Mauritius e-mail: [email protected]
2
Mechanical Engineering Dept.,Texas A&M University, USA.
e-mail: [email protected]; [email protected]; [email protected]
ABSTRACT
Low carbon steel was exposed at two sites in Mauritius, namely Port Louis and Belle Mare. The site at Port Louis is basically an industrial marine one whereas the one at Belle Mare is a purely marine site. Though the corrosion loss trend at both sites follow the power law, the corrosion loss at Port Louis was found to be higher than that at Belle Mare. This study has been performed to investigate the surface characteristics of the rust layers of the samples exposed at the two sites, through Raman spectroscopy and SEM, so as to get a better insight into the mechanism of the atmospheric corrosion process. For Port Louis, it was observed that there was not much change in the corrosion products in the rust layer over the 3 years period. The structure was less compact than that at Belle Mare with the presence of lepidocrocite and akaganeite as commonly observed corrosion products. The corrosion rate at Port Louis is, therefore, expected to follow the same trend over the long term. For Belle Mare, the corrosion products changed significantly after 3 years of exposure. Though lepidocrocite and akaganeite were observed on the surface after 0.2 years of exposure, magnetite was the most probable corrosion product in the more compact rust layer after 3 years of exposure. This compactness of the rust layer is expected to have reduced the corrosion rate as compared to that of Port Louis. Significant changes in the corrosion rate at Belle Mare are, therefore, expected over the medium and the long term.
Keywords: Raman spectroscopy, atmospheric corrosion, industrial-marine atmosphere, Mauritius Island.
1. INTRODUCTION
Carbon steel is a commonly used metal worldwide, for a wide variety of applications. However, it is prone to atmospheric corrosion especially when used outdoors. This is a situation of much concern and, as a result, much research work has been performed in the field of atmospheric corrosion monitoring and prevention, especially for carbon steel.
Table 1: Name, composition and crystal system of corrosion products [4]
COMPOSITION NAME
Fe3O4 Magnetite*
γ-Fe2O3 Maghemite
α-Fe2O3 Haematite
α-FeOOH Goethite*
γ-FeOOH Lepidocrocite[a]
β-FeOOH Akaganeite
δ-FeOOH Feroxyhyte
γ-Fe.OH.OH Reduced lepidocrocite
Fe(OH)2 Ferrous hydroxide
Fe(OH)3 Ferric hydroxide
[a] indicates the most common species.
Lepidocrocite is a semiconductor and electro-chemically active. Geothite is insulating and non-active. Magnetite, although a good conductor, is considered protective because of its compactness and thermodynamic stability. Other iron compounds that can develop on the surface are [4]:
• Green rusts- which are hydroxyl salts of Fe(II/III); And in urban or industrial atmospheres:
• Iron (II) sulphate heptahydrate (melanterite), tetrahydrate (rozentite) or monohydrate;
• Iron (III) sulphate; In marine atmospheres:
• Iron(II) chloride- FeCl2 (lawrencite);
• Iron (II) chloride tetrahydrate;
• Iron (III) chloride hexahydrate.
In general, the rust layer will consist of lepidocrocite and goethite together with several amorphous phases, such as amorphous ferric oxyhydroxide or feroxyhyte (d-FeOOH) [5,6]. In less than a few years of exposure, lepidocrocite and the amorphous phase are of roughly equal abundance. After several years the amorphous phase dominates. After several decades of exposure, goethite is the dominant phase [5]. A number of authors mention magnetite as a second-order constituent, most often in rust developed in marine atmospheres. When magnetite forms it is usually near the metal substrate, where the lower oxygen availability favours its development. Its presence is normally associated with a low protective efficiency of the rust layer formed. Akaganeite, on the other hand, is a typical component of rust developed in marine atmospheres.
Characterization of the corrosion products can lead to the determination of the atmospheric corrosion mechanism which would be essential for a robust long term prediction of corrosion allowance. The characterization of the corrosion products can be performed through chemical analysis. X-ray diffraction (XRD) and Raman spectroscopy are two very powerful methods that are used for this purpose [7,8]. Reflective Fourier Transform Infrared spectroscopy (FTIR) and Mossbauer spectroscopy have also been used for the same purpose [9,10]. Valuable information on the formation of the rust layer can also be given through techniques meant for analyzing surface topography such as the Scanning Electron Microscopy (SEM), Scanning Tunneling Microscopy (STM) and the Atomic Force Microscopy (AFM). Corrosion studies at the nanometer and sub-nanometer scale has been performed through scanning probe microscopies such as STM and AFM. The nano-structural aspects of anodic dissolution, protection by corrosion inhibitors, passivation and passivity breakdown and localised corrosion are some of the fields in which these techniques have been very useful.
1.1 Raman spectroscopy
• The Raman bands usually have narrower band widths and are therefore more characteristic and helpful in the analysis of mixtures.
The measured spectrum extends to lower frequencies (~200 cm-1) compared with that recorded on many routine IR spectrometers.
• Sample preparation is minimal, commonly none is required.
The main peaks for Raman tests, with respect to the corrosion products formed on the rust surface is shown Table 2.
In addition, when Raman spectroscopy is used supported with other techniques, such as the Scanning Electron Microscopy (SEM), deeper analysis can be performed, based on corrosion products and the morphology of the rust layer, to explain the corrosion behaviour of carbon steel.
SEM has also been used extensively in analyzing the morphology of the rust layer. Although basic information on the spatial distribution of corrosion attacks[5] and the porosity of the rust layer can be easily obtained through this technique, detailed information can also be obtained on the presence and formation of corrosion product phases on the metal surface. This information is essential for the accurate prediction of the atmospheric corrosion degradation on steels.
Table 2: Peaks for corrosion products using Raman spectroscopy
CORROSION
PRODUCT PEAK(cm
-1
) REFERENCES
Fe3O4 -
Magnetite 308, 542, 550, 560, 553, 650- 676, 690, 1322
[7],[13],[14], [15], [16],[17], [18], [19], [20]
γ-Fe2O3- Maghemite
345, 510, 645, 660- 680, 710- 720, 1198, 1412, 1425, 1440
[7],[13],[14], [15], [16],[17], [18], [19]
α-Fe2O3- Haematite
225-227, 245,292-295, 412-415, 500-501, 612-615, 1312, 1320
[7],[13],[14], [15], [16],[17], [18], [19],[20]
α-FeOOH- Goethite
245-248, 293-303, 348, 386-397, 420, 480-485, 549-554, 675-686, 1002-1004, 1120, 1295
[7],[13],[14], [15], [16],[17], [18], [19],[20]
γ-FeOOH- Lepidocrocite
248-255, 218, 374, 380, 528, 654-660, 695, 1054,
1300-1311 [7],[20],[21],[22] β-FeOOH-
Akaganeite
309-314, 330, 384, 380-388, 396, 400-415, 535-538,
722-745, 1389 [20],[21],[22],[23], [24]
δ-FeOOH- Feroxyhyte 220, 295, 385, 400, 495, 655, 670-680, 1350 [13], [14], [15], [16], [17], [18], [19] Fe(OH)2
-Ferrous hydroxide
460, 550 [13], [14], [15], [16], [17], [18], [19]
Fe(OH)3 395, 696, 692, 1335 [13], [14], [15], [16], [17], [18], [19]
Green rust 219, 269, 424, 433, 505, 511 [22]
SO42- 400-490, 965-1035 [12]
SO32- 970-990 [12]
ClO3 -
480-490, 930-940 [12]
ClO4 -
450-475, 1145-1180, 935-955 [12] Numbers in bold represent the main peaks recorded
1.2 Atmospheric corrosion in coastal regions in Mauritius
purely marine site with the samples exposed 50m from the sea shore. The metal samples were of size 150mm x 100mm x 3mm.
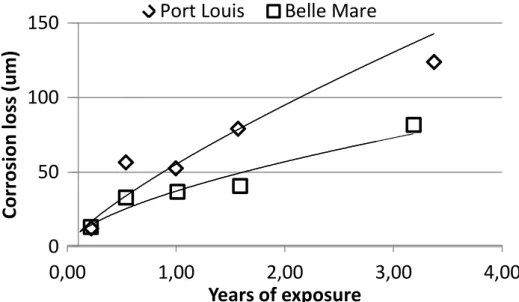
The weight loss method was used to determine the mass loss in the carbon steel samples according to BS 7545 [26]. These mass loss values were then converted to average thickness losses (µm) and would, henceforth, be referred to as corrosion losses. The results for the average corrosion loss, in µ m, calculated from the mass loss results, over a 3 years period, are shown in Figure 1.
Figure 1: Graph of corrosion loss against years of exposure for carbon steel samples
It was observed that the corrosion loss at both sites considered correlate well with the power law (shown by the trendcurves in Figure 1). As expected from the environmental parameters, the corrosion loss at Port Louis was found to be higher than that of Belle Mare. The corrosivity of the Port Louis atmosphere was found to fall in the C4 category, whereas that of Belle Mare was confirmed in category C3.
The behaviour of low carbon steel in these atmospheres, involving the corrosion products formed, needs to be understood in order to determine the corrosion mechanisms and to be able to predict atmospheric corrosion at these sites and at other sites in Mauritius. This is also important because there are many steel buildings and other major steel structures that are being erected in the harbour area and the neighbouring regions of Port Louis. Moreover, Port Louis and Belle Mare have a peculiar environment with low levels of airborne salinity and sulphur dioxide levels. The corrosion behavior of carbon steel in this type of tropical environment has not been extensively studied.
2. MATERIAL AND METHODS
As described, carbon steel samples were exposed at two sites in Mauritius, according to BS EN ISO 8565, namely Port Louis and Belle Mare, as shown in Figure 2.
0
50
100
150
0,00
1,00
2,00
3,00
4,00
C
o
rr
o
si
o
n
l
o
ss
(
u
m
)
Years of exposure
Figure 2: Exposure of carbon steel samples on exposure racks
The percentage composition by weight of the alloying elements of the carbon steel is shown in Table 3. The environmental parameters at the sites considered are shown in Table 4.
Table 3: Composition of carbon steel exposed
Alloying elements wt-%
Carbon 0.246
Sulphur 0.0269
Manganese 0.238
Phosphorus 0.000
Silicon 0.004
Nickel 0.024
Chromium 0.026
Copper 0.033
Table 4: Environmental parameters at sites considered
SITE AV E RAG E CHL O RI D E DE P O S IT IO N RAT E ( m g /m 2 .d) CHL O RI DE CL A S S ACCO RDI NG T O I S O 9223 S UL P HUR D IO IX ID E CO NCE NT RAT IO N L E V E L ( µ g /cm 3 ) SO 2 CL AS S ACCO RDI NG T O I S O
9223 TT
IM E O F W ET N ES S PER Y EA R (h rs ) TI M E O F W E TN E S S C LA S S ACCO RDI NG T O I S O 9 2 2 3
Port Louis 6.8 S1 12.3 P1 1957 T3
Belle Mare 5.3 S1 >2.6 P0 3634 T4
0.5, 1.0, 1.5 and 3 years, as shown in Figure 1. 5 samples were removed from the exposure racks, for each removal and at each site. 4 of them were cleaned for weight loss analysis. The remaining one was used for Raman and SEM tests in order to explain the corrosion behaviour of the carbon steel at the two sites.
3. RESULTS AND ANALYSIS
Based on Figure 1, from the power law behaviour, the corrosion rate is expected to be high initially and it is expected to decrease with an increase in the time of exposure. It should be noted that for severe atmospheres, such as marine-industrial and severe marine ones, the corrosion loss follows closely the power law. However, in less corrosive atmospheres, such as urban and rural ones, the metal may corrode in two steps [23].
3.1 Belle Mare
For Belle Mare, the results for the Raman and SEM tests performed after 0.2, 1.0 and 3 years of exposure are shown in Figures 3 to 7. The results are expected to give a very good insight into the short to medium term atmospheric corrosion degradation of the metal.
Figure 3: The Raman test results for carbon steel samples exposed for 0.2 years showing the presence of
lepidocrocite (γ-FeOOH) and akaganeite (β-FeOOH) with peaks at 255 cm-1 and 700 cm-1 and 330 cm-1 respectively.
Figure 5: Raman spectra after 1 year of exposure showing the presence of akaganeite (β-FeOOH)
Figure 7: Raman spectra for samples exposed for 3 years showing the presence of a combination of magnetite (Fe3O4) and maghemite (γ-Fe2O3)
For the Raman tests, it should be noted that all samples analysed showed a peak at 1090 cm-1. For 0.2 year of exposure, peaks at 255 cm-1, 330 cm-1 and 700 cm-1 show the presence of lepidocrocite and akaganeite in the corrosion products. Akaganeite is a corrosion product commonly formed in marine atmospheres [4]. It has been suggested that OH- and Cl- react concurrently with Fe3+ complexes to yield lepidocrocite and akaganeite respectively [7].
SEM micrographs of the surface confirm the results of the Raman tests. As observed in Figure 3, sandy crystals of lepidocrocite [27, 28] and cigar-like crystals of akaganeite can be observed on the surface.
The Raman test for 1 year of exposure is shown in Figure 5. The main peaks at 330 cm-1 and 400 cm-1 suggest that akaganeite is a major corrosion product in the rust layer. Smaller peaks could be observed at 260 cm-1, 435 cm-1, 615 cm-1, 630 cm-1 and 780 cm-1. Peaks at 260 cm-1 and 630 cm-1 still suggest the presence of lepidocrocite in the rust layer. However, as observed in Figure 6, the rust layer is more compact and this is expected to lead to a decrease in the corrosion rate.
A typical Raman spectra of the samples removed after 3 years of exposure is shown in Figure 7. Akaganeite could not be observed in the spectra. The main peaks could be observed at 630 cm-1, 655 cm -1, 665 cm-1 and 730 cm-1. These peaks show the presence of a combination of magnetite and maghemite. The presence of magnetite is due to the fact that akaganeite is gradually transformed to magnetite on contacting the steel surface [4, 29]. Maghemite has also been observed in atmospheric corrosion studies in various types of environments [4]. A change in the mechanism of the atmospheric corrosion process is, therefore, expected in the medium or the long term, leading to a significant change in the corrosion rate [6].
3.2 Port Louis
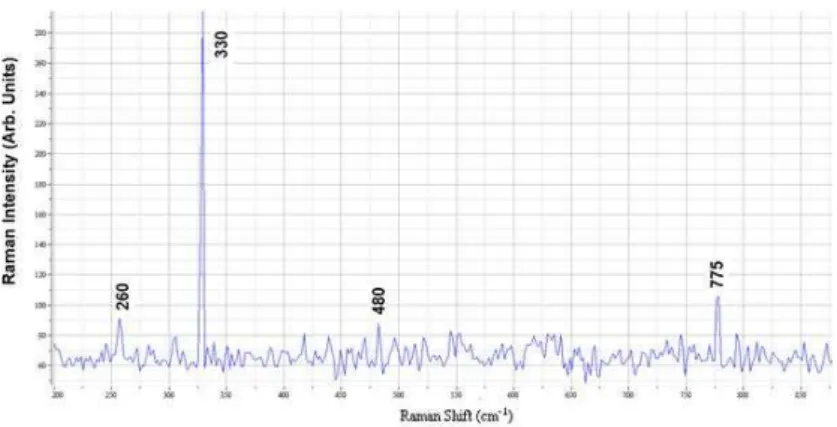
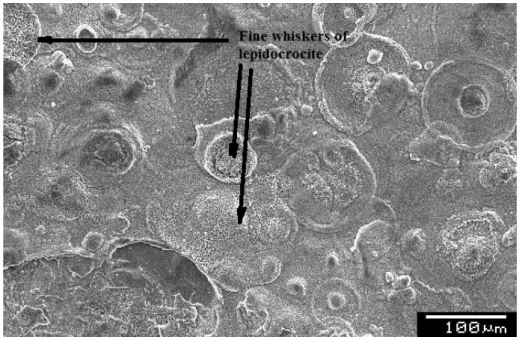
After 0.2 year of exposure, from the Raman test as shown in Figure 8, the peaks at 260 cm-1 and 330 cm-1 indicate the presence of lepidocrocite and akaganeite on the rust layer. This can be confirmed from the SEM micrographs in Figure 9. Fine whiskers of lepidocrocite [26, 28] were observed on the surface which consisted of a loose structure that led to a high initial corrosion rate [29].
Figure 9: SEM micrographs for samples exposed at Port Louis after 0.2 year of exposure
After 1 year of exposure, the same peaks at 260 cm-1 and 330 cm-1 were observed, as shown in Figure 10. Together with the peak at 630 cm-1, the formation of lepidocrocite and akaganeite could be expected. The peaks at 420 cm-1 and 435 cm-1 could be due to the formation of sulphate ions, resulting from the polluted atmosphere of Port Louis. The rust layer, as observed from the SEM micrographs in Figure 11, was found to be more compact. However, the formation of cracks in the rust layer was observed on the surface which could have kept the corrosion rate at a significant value.
Figure 11: SEM micrograph of samples exposed for 1 year at Port Louis
Figure 12: Raman spectra after 3 years of exposure at Port Louis showing little difference with those obtained from previous removals
After 3 years of exposure, the Raman spectra, as shown in Figure 12, did not change significantly. In fact, the 3 Raman spectrum observed at Port Louis did not show much difference, apart from the intensity of the peaks. Even the spectra at 780 cm-1 was observed on all the spectrum recorded. The intensity of the main peak for akaganeite, at 330 cm-1, remained the same. However, the intensities for the smaller peaks, especially the one for lepidocrocite at 260 cm-1, increased. This suggests that there has been a change in ratio of the oxy-hydroxides present in the rust layer, with an increase in the lepidocrocite content. This can be explained by the fact that akaganeite is more liable to reduction than lepidocrocite [29]. A change in the ratio of the oxy-hydroxides is expected during atmospheric corrosion processes [2]. However, taking into consideration the unprotective nature of these oxy-hydroxides, the gradual decrease in the corrosion rate with time may be attributed to mainly an increase in rust layer thickness. This decrease is expected to continue even in the long term [6].
3. CONCLUSION
in the corrosion products formed in the rust layer. After 3 years of exposure, the rust layer is more compact with the most probable formation of magnetite. Hence, a change in the trend of the corrosion thickness loss is expected over the medium or the long term.
4. BIBLIOGRAPHY
[1] COLE, I.S., PATERSON, D.A, GANTHER, W.D., “Holistic model for atmospheric corrosion Part 1 – Theoretical framework for production, transportation and deposition of marine salts”, Corros. Eng., Sci. and Tech., v. 38, n. 2, 2003.
[2] HOERLE, S., MAZAUDIER, F., DILLMAN, PH., et al.,
“
Advances in understanding atmospheric corrosion of iron. II. Mechanistic modelling of wet-dry cycles, Corros. Sci., v. 46, n. 6, 2004.[3] TAMURA, H., “The role of rusts in corrosion and corrosion protection of iron and steel”, Corros. Sci., v. 50, n. 7, 2008 .
[4] MORCILLO, M., FUENTE, D., DIAZ, I., CANO, H.,
“
Atmospheric corrosion of mild steel”, Revista de Metallugicia, v. 47, n. 5, 2011.[5] GRAEDEL, T., LEYGRAF, C., Atmospheric corrosion, Wiley-Interscience, 2000.
[6]DE LA FUENTE, D., DÍAZ, I., SIMANCAS, J., et al.,
“
Long-term atmospheric corrosion of mildsteel”, Corros. Sci., v. 53, n. 2, 2011.
[7] XIAO, K., DONG, C.-F., LI, X., et al.,
“
Corrosion products and formation of mechanism duringinitial stage of atmospheric corrosion of carbon steel”, Journal of Iron and Steel Research, International, 15, 5, 2008.
[8] LEGODI, M.A., DE WAAL, D., Dyes and Pigments, v. 74, n. 1, 2007.
[9] JAÉN, J.A., MUÑÓZ, A., JUSTAVINO, J., et al., Proceedings of the International Symposium on
the Industrial Applications of the Mössbauer Effect (ISIAME 2008), Budapest, Hungary, 17–22 August, pp 553-561, 2008.
[10] COOK, D.C., “Spectroscopic identification of protective and non-protective corrosion coatings on steel structures in marine environments”, Corros. Sci., v. 47, n. 10, 2005.
[11] MONNIER, J., BELLOT-GURLET, L., BARON, D., et al., “A methodology for Raman structural quantification imaging and its application to iron indoor atmospheric corrosion products”, Journal of
raman spectroscopy, 42, 2, 2011
[12] DEGEN, I.A., NEWMAN, G.A., “Raman spectra of inorganic ions”, Spectrochimica Acta , v. 49A, n. 5/6, 1993.
[13] GUI, J., DEVINE, T.M., Proc. Of the 12th Int. Corrosion Congress, Nace International, Houston, pp 2052-2063, 1993.
[14] DUNNWALD, J., OTTO, A., “An investigation of phase transitions in rust layers using Raman spectroscopy”, Corros. Sci.,v. 29, n. 9, 1989.
[15] OHTSUKA, T., KUBO, K., SATO, N.,
“
Raman Spectroscopy of Thin Corrosion Films on Iron at 1000 to 15000 C in Air Corrosion”, Corrosion , v.42, n.8, pp.476-481, 1986.[16] OHTSUKA, T., “Raman Spectra of passive films of iron in neutral borate solution”, Materials Transactions, v. 37, n. 1, 1996.
[17] BOUCHERIT,N., DELICHER, P., JOIRET, S., et al., Materials Science Forum, v. 51, n.44, 1989. [18] THIERRY, D., PERSSON, D., LEYGRAF, C., et al.,
“
In‐Situ Raman Spectroscopy Combined with X‐Ray Photoelectron Spectroscopy and Nuclear Microanalysis for Studies of Anodic Corrosion Film Formation on Fe‐Cr Single Crystals”, J. Electrochem. Soc., v.135, n.2, 1988.[19] THIBEAU, R.J., BROWN, C.W., HEIDERSBACH, R.H., “Raman spectra of possible corrosion products of iron, Appl. Spectroscopy”, Appl. Spectroscopy, v.32, n.6, 1978.
[20] BALASUBRAMANIAM, R., RAMESH KUMAR A.V., DILLMANN, P., “Characterization of rust on ancient Indian iron”, Current Science, n. 85, v. 11, 2003.
[21] DUNN, D.S., BOGART, M.B., BROSSIA C.S., et al., “Corrosion of Iron Under Alternating Wet and Dry Conditions”, Corrosion, 56, 5, 2000.
[23] DUNN, D.S., BOGART, M.B., BROSSIA, C.S., et al, “Corrosion of iron under alternating wet and dry conditions”, Corrosion 99, San Antonio, Paper 223.
[24] REGUER, S., NEFF, D., REMAZEILLES, C., et al., “Desalinisation of iron archaeological artefacts: understanding of chlorine removal mechanisms of the corrosion layers supported by characterisation techniques”, In: Proc. of the Metal07 Conf., 17th - 21st Sept. Amsterdam, The Netherlands, pp 60-68, 2007.
[25] BS EN ISO 8565, “Metals and alloys: Atmospheric corrosion testing”. General requirement for field tests, 1995.
[26] BS 7545, “Method of removal of corrosion products from corrosion tests specimens of metals and alloys”, 1991.
[27] ANTUNES, R.A., COSTA, I., FARIA, D.L.A., “Characterization of Corrosion Products Formed on Steels in The First Months of Atmospheric Exposure”, Materia Revista, v. 8,n. 1, 2003.
[28] ANTUNES, R.A., ICHIKAWA, R.U., MARTINEZ, G. L., et al, “Characterization of Corrosion Products on Carbon Steel Exposed to Natural Weathering and to Accelerated Corrosion Tests”, International Journal of Corrosion, 2014, 2014.
![Table 1: Name, composition and crystal system of corrosion products [4] COMPOSITION NAME Fe 3 O 4 Magnetite* γ -Fe 2 O 3 Maghemite α -Fe 2 O 3 Haematite α -FeOOH Goethite* γ -FeOOH Lepidocrocite[a] β -FeOOH Akaganeite δ -FeOOH Feroxyhyte](https://thumb-eu.123doks.com/thumbv2/123dok_br/18874319.420960/2.892.243.651.150.348/composition-composition-magnetite-maghemite-haematite-lepidocrocite-akaganeite-feroxyhyte.webp)