A high-fructo se die t induce s change s
in pp1 8 5 pho spho rylatio n in m uscle
and live r o f rats
1Departamento de Planejamento Alimentar e Nutrição,
Faculdade de Engenharia de Alimentos, and
2Departamento de Clínica Médica, Faculdade de Ciências Médicas,
Universidade Estadual de Campinas, Campinas, SP, Brasil M. Ueno1, R.M.N. Bezerra1,
M.S. Silva1, D.Q . Tavares1,
C.R. Carvalho2
and M.J.A. Saad2
Abstract
Insulin stimulates the tyrosine kinase activity of its receptor resulting in the tyrosine phosphorylation of pp185, which contains insulin receptor substrates IRS-1 and IRS-2. These early steps in insulin action are essential for the metabolic effects of insulin. Feeding animals a high-fructose diet results in insulin resistance. However, the exact molecular mechanism underlying this effect is unknown. In the present study, we determined the levels and phosphorylation status of the insulin receptor and pp185 (IRS-1/2) in liver and muscle of rats submitted to a high-fructose diet evaluated by immunoblotting with specific antibodies. Feeding fructose (28 days) induced a discrete insulin resistance, as demonstrated by the insulin tolerance test. Plasma glucose and serum insulin and cholesterol levels of the two groups of rats, fructose-fed and control, were similar, whereas plasma triacyl-glycerol concentration was significantly increased in the rats submit-ted to the fructose diet (P<0.05). There were no changes in insulin receptor concentration in the liver or muscle of either group. However, insulin-stimulated receptor autophosphorylation was reduced to 72 ± 4% (P<0.05) in the liver of high-fructose rats. The IRS-1 protein levels were similar in both liver and muscle of the two groups of rats. In contrast, there was a significant decrease in insulin-induced pp185 (IRS-1/2) phosphorylation, to 83 ± 5% (P<0.05) in liver and to 77 ± 4% (P<0.05) in muscle of the high-fructose rats. These data suggest that changes in the early steps of insulin signal transduction may have an important role in the insulin resistance induced by high-fructose feeding.
Co rre spo nde nce M.J.A. Saad
Departamento de Clínica Médica FCM, UNICAMP
13081-970 Campinas, SP Brasil
Fax: + 55-19-239-3114
E-mail: msaad@ head.fcm.unicamp.br
Research supported by FAPESP and CNPq.
Received November 30, 1999 Accepted September 13, 2000
Ke y wo rds
·Fructose
·Insulin receptor
·pp185 Phosphorylation
Insulin secretion tightly regulates glucose homeostasis by stimulating the peripheral use of glucose and inhibiting hepatic glucose output. The insulin receptor ß-subunit, which contains an intrinsic tyrosine kinase, under-goes tyrosyl autophosphorylation and is
phospho-protein called pp185 was identified in many cells and tissues (2). One component of pp185, designated insulin receptor substrate 1 (IRS-1), was purified and its cDNA from several sources cloned (3). More recently another constituent of pp185 termed IRS-2 was also purified and its cDNA sequence determined (4). The tyrosine phosphorylat-ed pp185 (IRS-1 and IRS-2) binds to various effector molecules including the regulatory subunit of phosphoinositol (PI) 3-kinase via src homology 2 domains (1). Recruitment of the catalytic subunit results in activation of PI 3-kinase, which is necessary for insulin action on glucose transport, glycogen syn-thesis, protein synsyn-thesis, anti-lipolysis, and suppression of hepatic gluconeogenesis by regulation of phosphoenolpyruvate carboxy-kinase (PEPCK) gene expression (5).
Impairment of insulin action (insulin re-sistance) is involved in many diseases such as non-insulin-dependent diabetes mellitus, obesity, hypertension, and cardiovascular disease (6). High-fructose rats are consid-ered to be an animal model of insulin resis-tance associated with hyperinsulinemia, hy-pertriglyceridemia (7,8) and hypertension (9). Although it has been shown that a high-fructose diet alters the activity of several enzymes regulating hepatic carbohydrate me-tabolism, leading to hepatic insulin resis-tance (10,11), the mechanisms by which ex-cess fructose produces these effects are un-known. The role of the phosphorylation of insulin receptors and pp185 in vivo has not yet been examined in insulin resistance in-duced by a high-fructose diet. In the present study, we investigated the levels and phos-phorylation status of the insulin receptor and pp185 in the liver and muscle of Wistar rats submitted to a high-fructose diet.
Male Wistar-Hannover rats 5 weeks old and weighing approximately 120 g were ran-domly divided into two diet groups (control and high-fructose) for 28 days. The control diet was standard rodent chow (Nuvilab-Nuvital, Curitiba, PR, Brazil) containing (%
calories) 64% vegetable starch, 9.5% fat as vegetable oil, and 26.5% animal protein (beef and fish flours). The high-fructose diet con-tained (% calories) 66% fructose, 12% fat as vegetable oil, and 22% animal protein (ca-sein). The mineral and vitamin mix used in the experimental diet met the criteria specified by the American Institute of Nutrition -AIN93 (12). The rats were maintained under standard conditions (20-22o
C and a 12-h light/dark cycle) with free access to food and tap water, and were weighed weekly in order to record their body weight gain.
For characterization of this animal mo-del, after a 6-h fast, the fructose- and stan-dard chow-fed rats were anesthetized with sodium thiopental (80 mg/kg body weight, ip) and blood samples were collected by cardiac puncture. After centrifugation, the serum was utilized for the determination of triacylglycerol and cholesterol concentration by the enzymatic method using Labtest Diagnostica kits (Lagoa Santa, MG, Brazil), and of insulin concentration by double-anti-body radioimmunoassay using a specific rat kit from Diagnostic Products Corp. (Los Angeles, CA, USA). The effect of fructose feeding on the ability of insulin to stimulate glucose disposal was estimated by the intra-venous insulin tolerance test. After a 14-h fast, the animals were anesthetized with so-dium thiopental (80 mg/kg body weight) and tail blood samples were drawn before, and at 0 (basal), 4, 8, 12, and 16 min after insulin injection (60 µg) for the determination of glucose levels using an enzymatic method and a Labtest Diagnostica kit. The rate con-stant for plasma glucose disappearance (Kitt) was calculated using the formula 0.693/t1/2.
The plasma glucose t1/2 was calculated by the
slope of the least square analysis of the plasma glucose concentration during the lin-ear decay phase (13).
and corneal reflexes were assured. The ab-dominal cavity was opened, the portal vein exposed, and 60 µg insulin was injected. Within 30 s, the liver was removed, minced coarsely and immediately homogenized in 10 volumes of solubilization buffer A, pH 7.4 (1% sodium dodecyl sulfate (SDS), 100 mmol/l tris[hydroxymethyl]aminomethane (Tris), pH 7.4, 10 mmol/l sodium pyrophos-phate, 100 mmol/l sodium fluoride, 10 mmol/l ethylenediaminetetraacetic acid, and 10 mmol/l sodium vanadate) in a water bath maintained at 100oC, using a polytron PTA
20S generator (model PT 10/35, Brinkmann Instruments, Westbury, NY, USA) operated at maximum speed for 20 s. The homogenate was boiled for 10 min and then cooled in an ice bath for 40 min. Approximately 90 s after insulin injection, hindlimb muscle samples were excised and homogenized as described above. The tissue extracts were centrifuged at 16,000 g at 4o
C for 20 min, and the super-natant was used as the sample. In some experiments, the tissues were extracted at 4o
C with homogenization buffer B (same as buffer A except that 1% Triton X-100 re-placed 1% SDS and 2 mmol phenylmethyl-sulfonyl fluoride and 0.1 mg/ml aprotinin was added) and the supernatant was used for immunoprecipitation with anti-insulin recep-tor antibody and protein A-Sepharose 6 MB. The samples were treated with Laemmli buf-fer containing 100 mmol/l dithiothreitol and heated in a boiling water bath for 4 min. For total extracts, aliquots of samples containing 200 µg of protein were submitted to 6% SDS-polyacrylamide gel electrophoresis (SDS-PAGE). Electrotransfer of proteins from the gel to the nitrocellulose membrane was performed for 90 min at 120 V (con-stant) in a BioRad miniature transfer appara-tus (Mini-Protean). The nonspecific protein binding was reduced by preincubating the filter for 2 h at 22o
C in blocking buffer, pH 7.4 (5% nonfat dry milk, 10 mmol/l Tris, 150 mmol/l NaCl, and 0.02% Tween 20). The nitrocellulose blot was incubated for 4 h at
22o
C with antiphosphotyrosine antibody, anti-insulin receptor antibody (anti-IR) or anti-IRS-1 antibody diluted in blocking buf-fer, pH 7.4 (3% nonfat dry milk, 10 mmol/l Tris, 150 mmol/l NaCl, and 0.02% Tween 20). Antibodies were from Santa Cruz Bio-technology (Santa Cruz, CA, USA). The blots were incubated with 2 µCi of [125
I]-protein A (30 µCi/µg) in 10 ml of blocking buffer (1% nonfat dry milk) for 1 h at 22o
C and washed again as described above. [125
I]-Protein A bound to antibodies was detected by autoradiography using preflashed Kodak XAR film with a Cronex Lightning Plus intensifying screen at -80o
C for 12-48 h. Band intensities were quantitated by optical densitometry (model GS 300; Hoefer Scien-tific Instruments, San Francisco, CA, USA) of the developed autoradiographs that were used at exposures in the linear range.
Experiments were always performed by analyzing samples from the fructose-fed rats parallel to the control group. Different groups of rats were used for tissue sampling and for the biochemical assays. The unpaired Stu-dent t-test was used for comparisons and the significance level was P<0.05.
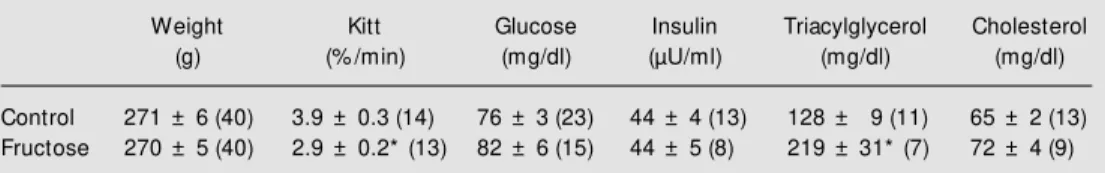
At the end of the 4-week experimental period there were no significant differences between control and fructose-fed rats in total body weight, or in the basal serum glucose, cholesterol and insulin concentration. How-ever, the serum triacylglycerol concentra-tion was significantly higher in the group eating fructose than in the control (fructose: 219 ± 31 vs control: 128 ± 9 mg/dl). In order to demonstrate that the fructose-fed rats were insulin resistant, the animals from both groups were submitted to an insulin tolerance test. The glucose disappearance rate (Kitt) during this test was significantly lower in fructose-fed than in control rats, thus demonstrating a moderate state of insulin resistance (Table 1).
determined by immunoblotting with anti-IR and anti-IRS-1 antibodies. However, after stimulation with insulin, in samples previ-ously immunoprecipitated with IR anti-body and immunoblotted with antiphospho-tyrosine antibody there was a clear decrease in insulin-stimulated receptor autophospho-rylation to 72 ± 4% in fructose-fed animals compared to controls (P<0.05; Figure 1c). In anti-phosphotyrosine blots of whole tissue extracts, a broad protein band migrating be-tween 165 and 185 kDa was detectable after insulin stimulation (Figure 1d). This band is known as pp185 and contains IRS-1 and IRS-2 (4). The phosphorylation of pp185 in the fructose-fed group was reduced to 83 ± 5% (P<0.05) compared to control. As ob-served for the liver, the fructose diet pro-duced no change in insulin receptor or IRS-1 protein levels in rat skeletal muscle (Figure 2a and b). In contrast to the results observed in the liver, following stimulation with insu-lin, phosphorylation of the insulin receptor did not change in the fructose-fed rats com-pared to control (Figure 2c). However, there was a decrease to 76 ± 5% (P<0.05) in pp185 phosphorylation in muscle of fructose-fed rats compared to control (Figure 2d).
The insulin resistance described in an animal model involving a high-fructose diet is associated with glucose intolerance, in-creased serum triacylglycerol and insulin concentration and decreased insulin sensi-tivity (7-9,11). Our results showed a moder-ate insulin resistance stmoder-ate in the fructose-fed animals, demonstrated by a decreased
glucose disappearance rate after insulin in-fusion, and an increase in plasma triacyl-glycerol concentration. The discrepancies in the degree of insulin resistance and in the metabolic parameters (plasma glucose and serum insulin levels) of our study compared to previous reports may be related to the duration of fructose feeding and to the lipid content and type of the diets (7,8).
Despite the normal number of insulin receptors in the liver and muscle of fructose-fed rats, there was a reduction in insulin receptor autophosphorylation in the liver af-ter insulin stimulation in vivo. The reduction observed in our study may be of biological significance, since a decrease in receptor phosphorylation has been correlated with insulin resistance in different animal models (14,15). The results of the present study demonstrated that there is a significant de-crease in the level of hepatic and muscle pp185 (IRS-1/IRS-2) tyrosine phosphoryla-tion. A decreased insulin ability to suppress hepatic glucose production has been impli-cated as one of the elements of insulin resis-tance in this model (7,8). The 1 or IRS-2/PI 3-kinase association induced by insulin is necessary and in some cases sufficient to elicit many of the insulin effects on glucose metabolism in liver and muscle (16). The PEPCK is a regulatory enzyme for gluconeo-genesis. Recent reports demonstrated that inhibitors of PI 3-kinase are able to block the effects of insulin on PEPCK gene transcrip-tion in liver cells (5), suggesting that the control of insulin over PEPCK is mediated
Table 1 - Body w eight, insulin tolerance test, fasting plasma glucose, insulin, triacylglycerol and cholesterol after 4 w eeks of dietary manipulation.
The results are reported as the mean ± SEM . The number of animals in each group is show n in parentheses. * ' P< 0.05 vs control group (unpaired Student t-test).
Weight Kitt Glucose Insulin Triacylglycerol Cholesterol
(g) (% /min) (mg/dl) (µU/ml) (mg/dl) (mg/dl)
Control 271 ± 6 (40) 3.9 ± 0.3 (14) 76 ± 3 (23) 44 ± 4 (13) 128 ± 9 (11) 65 ± 2 (13)
Figure 1 - Effects of a high-fructose diet on protein levels of insulin receptor (IR) (a) and IRS-1 (b), and tyrosine phosphorylation levels of IR (c) and pp185 (d) in rat liver. The proteins w ere isolated as described in M aterial and M ethods. Aliquots w ith the same amount of protein w ere loaded onto 6% SDS-polyacrylamide gel, transferred to a nitrocellulose membrane, and im-munoblotted w ith IR (a), IRS-1 (b), and anti-phosphotyrosine (d) antibodies. In some samples from control (C) animals not treated w ith insulin, control animals treated w ith insulin, fructose (F)-fed animals not treated w ith insulin and fructose-fed animals treated w ith insulin, the supernatants w ere immuno-precipitated w ith IR and immunoblotted w ith anti-phosphotyrosine (c). Figure 1d show s a broad band migrating betw een 115-130 kDa in phosphotyrosine blots of liver extracts. The changes in tyrosine phos-phorylation levels of this band after insulin stimulation are not consistent and classically there is no insulin receptor substrate migrating in this band. A represen-tative autoradiograph from six experiments is show n. Scanning densitometry w as performed on autoradio-grams to determine IR and IRS-1 concentrations for tyrosine phosphorylation of proteins. Values are re-ported as mean ± SEM of six experiments. * P<0.05 vs
control (unpaired Student t-test).
Figure 2 - Effects of a high-fructose diet on protein levels of insulin receptor (IR) (a) and IRS-1 (b), and tyrosine phosphorylation levels of IR (c) and pp185 (d) in rat muscle. The proteins w ere isolated as described in M aterial and M ethods. Aliquots w ith the same amount of protein w ere loaded onto 6% SDS-polyacryl-amide gel, transferred to a nitrocellulose membrane, and immunoblotted w ith anti-IR (a), anti-IRS-1 (b), and antiphosphotyrosine (d) antibodies. In some samples from control (C) animals not treated w ith insulin, con-trol animals treated w ith insulin, fructose (F)-fed ani-mals not treated w ith insulin and fructose-fed aniani-mals treated w ith insulin, the supernatants w ere immuno-precipitated w ith IR and immunoblotted w ith anti-phosphotyrosine (c). A representative autoradiograph from six experiments is show n. Scanning densitometry w as performed on autoradiograms to determine IR and IRS-1 concentrations for tyrosine phosphorylation of proteins. Values are reported as mean ± SEM of six experiments. * P<0.05 vs control (unpaired Student
t-test). C F IR A rb it ra ry u n it s 120 100 80 60 40 20 0 A rb it ra ry u n it s 120 100 80 60 40 20 0 C F IRS-1 C F pp185 Insulin: C F IR Insulin: A rb it ra ry u n it s 120 100 80 60 40 20 0 A rb it ra ry u n it s 120 100 80 60 40 20 0 - + - + - + - + * a b c d C F IR A rb it ra ry u n it s 120 100 80 60 40 20 0 A rb it ra ry u n it s 120 100 80 60 40 20 0 C F IRS-1 C F pp185 pp120 Insulin: IR Insulin: A rb it ra ry u n it s 120 100 80 60 40 20 0 A rb it ra ry u n it s 120 100 80 60 40 20 0 - + - + - + - + * * a b
by pp185 phosphorylation (IRS-1/IRS-2) and PI 3-kinase. There is a previous study dem-onstrating that PEPCK activity is increased in a high fructose-fed animal model (11). Taking these previous studies together with our results, we may speculate that the reduc-tion in pp185 phosphorylareduc-tion can induce changes in IRS-1 and IRS-2/PI 3-kinase as-sociation/activation in the liver of fructose-fed rats, and this effect may have a role in the insulin resistance of this animal model.
Parallel to the reduced tyrosine phospho-rylation level in the muscle of fructose-fed rats, pp185 showed a decreased electropho-retic mobility in SDS-PAGE. This reduced tyrosine phosphorylation may be due to the activation of tyrosine phosphatase(s) and/or to serine/threonine phosphorylation. IRS-1 and IRS-2 contain many potential serine/ threonine phosphorylation sites in motifs recognized by various kinases such as pro-tein kinase C (PKC), and mitogen-activated protein kinases (3,17). Serine phosphoryla-tion may play a role in the regulaphosphoryla-tion of IRS-1 and IRS-2 signaling. It is known that in-creased phosphorylation of the insulin re-ceptor and IRS-1 in serine and threonine residues reduces insulin-mediated receptor phosphorylation in tyrosine, and inhibits the insulin-dependent tyrosine kinase activity of the receptor (18). The enhanced synthesis of triacylglycerol observed in the high-fructose diet model is associated with the increase of
1,2-sn-diacylglycerol and the increased ex-pression of one PKC isoenzyme in these rats (19). Thus, it is possible that an increase in PKC activity, probably by increasing serine phosphorylation of insulin receptors and pp185, may play a role in the alteration in tyrosine phosphorylation level of pp185 (IRS-1/IRS-2) observed in this study. In agree-ment with this hypothesis, there was a de-crease in electrophoretic mobility of pp185 in muscle, probably related to an increase in serine/threonine phosphorylation of this band, as previously described (20).
In muscle, pp185 tyrosine phosphoryla-tion and PI 3-kinase activaphosphoryla-tion are essential steps in insulin-induced glucose transport (1). The decrease in insulin-induced pp185 tyrosine phosphorylation in muscle from fruc-tose-fed rats observed by us may also contri-bute to the insulin resistance of this animal. This study has shown that a reduction in the phosphorylation of pp185 (IRS-1/IRS-2) in the liver and muscle of fructose-fed rats may contribute to explaining some aspects of insulin resistance in this animal model.
Ackno wle dgm e nts
The authors wish to thank Vêpe Indústria Alimentícia Ltda. (São Bernardo do Campo, SP, Brazil) for kindly providing the fructose, and also Mr. L. Janeri, Ms. C. da Silva and Ms. Y. Fagnani for technical assistance.
Re fe re nce s
1. White M F (1997). The insulin signaling system and the IRS proteins. Diabetolo-gia, 40: S2-S17.
2. White M F, M aron R & Kahn CR (1985). Insulin rapidly stimulates tyrosine phos-phorylation of a Mr-185,000 protein in intact cells. Nature, 318: 183-186. 3. Sun XJ, Rothenberg PA & Kahn CR (1991).
Structure of the insulin receptor substrate IRS-1 defines a unique signal transduc-tion protein. Nature, 352: 73-77. 4. Sun XJ, Wang LM , Zhang Y, Yenush L,
M yers Jr M G, Glasheen EM , Lane WS,
Pierce JH & White M F (1995). Role of IRS-2 in insulin and cytokine signaling. Na-ture, 377: 173-177.
5. Sutherland C, O’Brien RM & Granner DK (1995). Phosphatidylinositol 3-kinase, but not p70/p85 ribosomal S6 protein kinase, is required for the regulation of phospho-enolpyruvate carboxykinase (PEPCK) gene expression by insulin. Journal of Biologi-cal Chemistry, 270: 15501-15506. 6. O’Doherty R, Stein D & Foley J (1997).
Insulin resistance. Diabetologia, 40: B10-B15.
7. Zavaroni I, Sander S, Scott S & Reaven GM (1980). Effect of fructose feeding on insulin secretion and insulin action in the rat. M etabolism, 29: 970-973.
8. Tobey TA, M ondon CE, Zavaroni I & Reaven GM (1982). M echanism of insulin resistance in fructose-fed rats. M etabo-lism, 31: 608-612.
9. Thorburn AW, Storlien LH, Jenkins AB, Khouri S & Kraegen EW (1989). Fructose-induced in vivo insulin resistance and el-evated plasma triglyceride levels in rats.
1155-1163.
10. Tuovinen CGR & Bender AE (1975). Some metabolic effects of prolonged feeding of starch, sucrose, fructose and carbohy-drate-free diet in the rat. Nutrition and M etabolism, 19: 161-172.
11. Blakely SR, Hallfrisch J, Reiser S & Prather E (1981). Long-term effects of moderate fructose feeding on glucose tolerance pa-rameters in rats. Journal of Nutrition, 111: 307-314.
12. Reeves PG, Nielsen FH & Fahey Jr GC (1993). AIN-93 purified diets for labora-tory rodents: report of the American Insti-tute of Nutrition ad hoc w riting commit-tee on the reformulation of the AIN-76 rodent diet. Journal of Nutrition, 123: 1939-1951.
13. Bonora E, M oghetti P, Zancanaro C, Cigolini M , Querena M , Cacciotori V, Corgnati A & M uggeo M (1989). Esti-mates of in vivo insulin action in man: comparison of insulin tolerance tests w ith
euglycemic and hyperglycemic glucose clamp studies. Journal of Clinical Endocri-nology and M etabolism, 68: 374-378. 14. Saad M JA, Folli F, Kahn J & Kahn CR
(1993). M odulation of insulin receptor, in-sulin receptor substrate-1, and phosphati-dylinositol 3-kinase in liver and muscle of dexamethasone-treated rats. Journal of Clinical Investigation, 92: 2065-2072. 15. Carvalho CRO, Brenelli SL, Silva AC,
Nunes ALB, Velloso LA & Saad M JA (1996). Effect of aging on insulin receptor, insulin receptor substrate-1, and phospha-tidylinositol 3-kinase in liver and muscle of rats. Endocrinology, 137: 151-159. 16. Shepherd PR, Withers DJ & Siddle K
(1998). Phosphoinositide 3-kinase: the key sw itch mechanism in insulin signalling.
Biochemical Journal, 333: 471-490. 17. M othe I & Obberghen EV (1996).
Phos-phorylation of insulin receptor substrate-1 on multiple serine residues, 612, 632, 662, and 731, modulates insulin action.
Journal of Biological Chem istry, 271: 11222-11227.
18. Stadtmauer L & Rosen OM (1986). In-creasing the cAM P content of IM -9 cells alters the phosphorylation state and ki-nase activity of the insulin receptor. Jour-nal of Biological Chemistry, 261: 3402-3407.
19. Donnelly R, Reed M , Azhar S & Reaven GM (1994). Expression of the major isoen-zym e of prot ein kinase-C in skelet al muscle, nPKCq, varies w ith muscle type and in response to fructose-induced insu-lin resistance. Endocrinology, 135: 2369-2374.