Standardization of an isolated pig heart
preparation with parabiotic circulation:
methodological considerations
Departamento de Cirurgia Cardíaca, Universidade Estadual de Campinas, Campinas, SP, Brasil
O. Petrucci Júnior, P.P.M. Oliveira, M.R. Carmo, R.W. Vieira and D.M. Braile
Abstract
In the present study we standardized an experimental model of parabi-otic circulation of isolated pig heart. The isolated heart was perfused with arterial blood from a second animal as support and submitted to regional ischemia for 30 min, followed by total ischemia for 90 min and reperfusion for 90 min. Parameters for measurement of ventricu-lar performance using different indices measured directly or indirectly from intraventricular pressure were defined as: maximum peak pres-sure, final diastolic prespres-sure, pressure developed, first derivative of maximum pressure (dP/dtmax), first derivative of minimum pressure (dP/dtmin), systolic stress of the left ventricle (ss), and maximum
elastance of the left ventricle. Isolated hearts subjected to regional and global ischemia presented significant worsening of all measured parameters. Less discriminative parameters were dP/dtmax and dP/ dtmin. Elastance was the most sensitive parameter during the reperfu-sion period, demonstrating an early loss of ventricular function during reperfusion. The model proved to be stable and reproducible and permitted the study of several variables in the isolated heart, such as ischemia and reperfusion phenomena, the effects of different drugs, surgical interventions, etc. The model introduces an advantage over the classical models which use crystalloid solutions as perfusate, because parabiotic circulation mimics heart surgery with extracorpo-real circulation.
Correspondence
O. Petrucci Júnior
Departamento de Cirurgia Cardíaca Universidade Estadual de Campinas Rua João Baptista Geraldi, 135 13085-852 Campinas, SP Brasil
Fax: 19-3249-0051 E-mail: [email protected]
Publication supported by FAPESP.
Received August 20, 2002 Accepted January 8, 2003
Key words ·Isolated heart ·Ischemia
·Parabiotic circulation ·Reperfusion ·Model
Introduction
Oscar Langendorff was the first to de-scribe a method to investigate mechanical activity in isolated mammalian hearts (1). According to Döring (2), the method pro-posed by Langendorff at the end of the nine-teenth century was widely accepted for the mechanical, coronary and metabolic study of
isolated mammalian hearts.
applicability(4-7).
Although the Langendorff isolated heart preparation with parabiotic circulation is substantially more complex than the classi-cal preparation with the crystalloid solution, its scientific utility has greatly increased. A 10-year survey of the English scientific lit-erature revealed that few references have been made to the standardization of blood-perfused isolated porcine heart models, the anesthesia of the support animal, mainte-nance of the model or the perfusion time achieved. Thus, the objective of the present study was to describe the standardization of an isolated porcine heart model with parabi-otic circulation.
Material and Methods
Animal model
Pigs aged on average 15 weeks were used because of their similarity to humans in terms of anatomy and ischemic response (8,9). Each experiment utilized two animals; the heavier animal weighing approximately 40 kg was the support animal and the lighter animal weighing approximately 20 kg sup-plied the isolated heart.
Support animal. Preanesthetic
medica-tion applied intramuscularly consisted of 1 mg atropine and 25 mg/kg ketamine. An intravenous injection containing 12.5 µg/kg fentanyl, 15 mg/kg pentobarbital and 8 mg pancuronium bromide was then performed. A 12.5-mg/kg dose of ketamine was applied hourly and a 1-mg dose of pancuronium bromide whenever needed (10). An orotra-cheal tube was inserted and the animal was placed on volume mechanical ventilation.
Animal donor. The preanesthetic
medi-cation applied intramuscularly contained 1 mg atropine and 25 mg/kg ketamine. A dose of 20 mg/kg pentobarbital was administered after establishing a venous access. An orotra-cheal tube was inserted and the animal was placed on pressurized mechanical ventilation.
Surgical technique
Support animal. Bilateral cervicotomy
was performed to cannulate the left internal jugular vein (venous access), the left carotid (to monitor mean arterial pressure), the right internal jugular (perfusion system venous return), and the right carotid (perfusion sys-tem arterial blood). Heparin (500 IU/kg) was injected into the left internal jugular.
Animal donor. Median sternotomy. A
dose of 500 IU/kg heparin was injected into the right atrium. The inferior and superior venae cavae were occluded and the heart was rapidly excised. The largest possible portion of the right atrium was removed, with preservation of the right coronary ar-tery. The mitral valve was destroyed by sec-tioning the chordae tendineae and flaps and the mitral ring were closed with 2.0 polyes-ter purse string sutures. A needle thermom-eter was inserted into the interventricular septum and a previously prepared latex bal-loon was inserted into the left ventricular cavity, which was then fixed to a plastic support and tied to the mitral ring. During this procedure, the apex of the left ventricle was perforated to permit drainage of blood from the Thebesian system of the left ven-tricle. A cannula was inserted into the as-cending aorta and tied with a 3.0 polyester polyfilament to allow coronary perfusion via the aorta. The anterior interventricular coro-nary artery was dissected to permit place-ment of the minivascular clip at the appro-priate time. A cannula was connected to the aorta with a previously prepared perfusion system and infusion of the aorta was started.
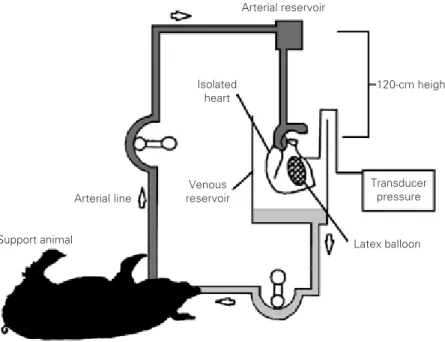
Perfusion system. The system was
planned so that it would permit continuous retrograde perfusion of the isolated heart at a constant pressure, independent of the sup-port animals arterial pressure (Figure 1).
Experimental methodology
was initiated and the myocardial septum tem-perature was expected to reach 36ºC. In case of ventricular fibrillation, 5-joule shocks were applied to reestablish orderly electrical ac-tivity of the isolated heart. The model was stabilized for 20 min while the intraventricu-lar pressure was measured. This was fol-lowed by the induction of myocardial re-gional ischemia, which was standardized by dissecting the anterior interventricular branch before the first diagonal branch and occlud-ing it for 30 min.
After 30 min of regional ischemia, the microvascular clip was withdrawn, the heart was subjected to global ischemia for 90 min and reperfusion was initiated. The heart was defibrillated when the septal temperature reached 36ºC and the pressure measured every 30 min for a period of 90 min.
Atrial pacemakers with a frequency of 160 bpm were used to stimulate all the iso-lated hearts. At the end of this procedure, the support animal was sacrificed. The isolated heart as well as the right ventricular wall, the atria and blood vessels were dissected ac-cording to the technique of Brooks et al. (11), and the left ventricle was weighed on an analytical scale to obtain its wet weight.
Method for the measurement of intraventricular pressure
The balloon introduced through the mi-tral ring after the destruction of the valve had a plastic support 1.5 cm in diameter. This plastic support permitted two catheters hav-ing an internal diameter of 2 mm to commu-nicate with the balloon in such a way that during infusion of volume the pressure de-veloped by the balloon in the left ventricle was also measured. The balloon was specif-ically designed to hold a volume of 60 ml without an increase in its internal pressure.
After stabilizing the isolated heart for 20 min, 5 ml saline was injected into the balloon at 1-min intervals to stabilize the intraven-tricular pressure. The largest possible
vol-ume of the balloon that maintained the dia-stolic pressure at 0 mmHg was determined. This volume was denoted V0 and was then
increased 2 ml at a time until the pressure developed by the left ventricle reached its maximum value. This volume was denoted Vmax. This method, described by Strömer et
al. (12), utilized the Vmax to normalize the
ventricular volume used for plotting and com-paring data.
Two functional points of the volume pres-sure curve, 50 and 100% of Vmax, were used
to compare the results.
In addition, the following intraventricu-lar pressure data were obtained: maximum peak pressure, final diastolic pressure, pres-sure developed, first derivative of maximum pressure (dP/dtmax), first derivative of
mini-mum pressure (dP/dtmin), systolic stress of
the left ventricle (ss), and maximum elastance
of the left ventricle (Emax).
Systolic stress of the left ventricle was
120-cm height
Transducer pressure
Latex balloon Support animal
Arterial line
Isolated heart
Arterial reservoir
Venous reservoir
obtained using the measurements of ventric-ular pressure, balloon volume, and weight of left ventricle (11).
The radius of the left ventricle, R1, was
calculated using the formula: R11/3 = Vb/4/
3 p, where Vb = volume of the
intraventricu-lar balloon assuming that the shape of the left ventricle is spherical.
The volume of the left ventricle is the total volume of the balloon plus the volume of the left ventricle wall. The formula for determining the volume of the left ventricle is: volume of the left ventricle wall = weight of left ventricle/1.05, where 1.05 is the spe-cific density of the myocardium. Volume of the ventricle (VL) = 4/3 p (R1 + h)3 and h =
(Vb/4/3 p)1/3 - R1, where h is the thickness of
the left ventricle wall.
Systolic stress was calculated according to the Laplace Law as described by Mirsky (13): ss = Ps[(R12
/h)/(2R1 + h)], where Ps is
the maximum systolic pressure, R1 is the
radius of the left ventricle with a determined volume in the balloon, and h is the thickness of the left ventricle wall.
Emax was calculated by linear regression
of the maximum systolic curves obtained for intraventricular volume as described by Suga (14).
Statistical analysis
Data are reported as means ± 2 SEM. The Student t-test was used to compare data ob-tained before and after global ischemia in the samples studied. Analysis of variance (ANOVA) was used to assess variations in the gasometric parameters and the Dunnett test to identify the differences between groups.
ANOVA was also used to evaluate elastance and compliance and the Dunnett test to identify the differences between groups.
The statistical package Graph Pad Prism 3.0 version for Windows (Graph Pad Software, San Diego, CA, USA, www.graphpad.com) was used for all statis-tical calculations, with the level of signifi-cance set at P<0.05.
Results
Perfusion parameters
The initial hematocrit of perfused blood was 32.00 ± 3.70% (95% CI, 28.58 to 35.42%), with variations during the experi-ment as demonstrated in Figure 2. The mean hematocrit value of perfused blood was 31.30 ± 3.40% (95% CI, 28.14 to 34.43%). No significant differences were observed for any of the intervals studied. The oxygen supply to the isolated heart remained constant, never reaching values of less than 300 mmHg (Fig-ure 2).
Isolated heart after regional and global ischemia
Reperfusion of the hearts was performed after 30 min of regional ischemia and 90 min of global ischemia, and intraventricular pres-sure and its derivatives were observed every 30 min.
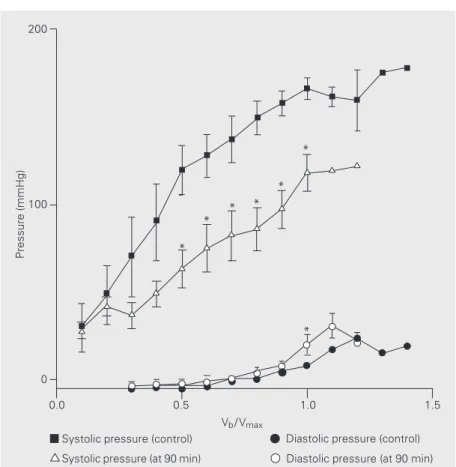
Figure 3 illustrates the values obtained with 90 min of reperfusion for systolic and
Figure 2. Perfusion parameters of the isolated heart. Hematocrit was constant without transfusions. The mean hematocrit (Ht, triangles) value of perfused blood was 31.30 ± 3.40% (95% CI, 28.14 to 34.43%). No significant differ-ences were observed for any of the intervals studied. The oxygen supply to the isolated heart remained constant (PaO2, squares), never reaching values of less than 300 mmHg. Data are reported as means ± 2 SEM.
37.5
PaO
2
(mmHg)
500
400
300
200
Beginning Final
Time
35.0
32.5
30.0
27.5
diastolic pressure in comparison with values obtained during the control period. Diastolic pressure did not differ significantly from control at the 30- and 60-min reperfusion periods, but at the 90-min period a signifi-cant difference was observed compared to control.
Table 1, which shows 100% Vmax values,
demonstrated that systolic pressure was a differentiating factor that indicated deterio-ration for all the periods studied that was significantly different from the control group. The pressure developed during all peri-ods showed a significant reduction com-pared to control (Figure 4).
There was a significant reduction in dP/ dtmax compared to control for all periods
studied and a significant reduction in dP/ dtmin compared to control for only two
peri-ods of study (Figure 5).
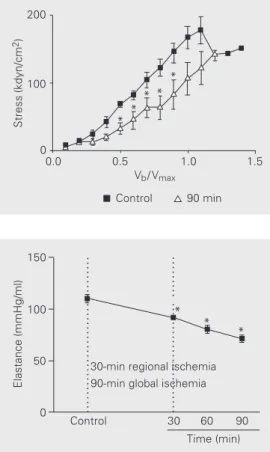
There was a significant reduction in sys-tolic stress (ss) compared to control for all
periods studied (Figure 6). The elastance values decreased significantly in compari-son with the control at 30, 60 and 90 min of reperfusion (Figure 7).
Discussion
Support animal
A smaller animal donor was a better op-tion because a large heart was not needed to obtain the parameters required for this study and the costs of the experiment were re-duced.
The mean time required for the removal of the heart and for initiating perfusion of the isolated heart was 815.7 ± 109 s, similar to literature data regarding similar experiments conducted on cats and rats (15-17).
The mean weight of the donor animals was 22.00 kg, which was an adequate size for manipulating the heart, especially when the maximum volume of the latex balloon installed within the left ventricle was stan-dardized. Therefore, the utilization of smaller
Figure 3. Systolic and diastolic pressure during the control period and after 90-min reperfu-sion. Data are reported as means ± 2 SEM. *P<0.05 compared to respective control (Student t-test).
Pressure (mmHg)
200
Systolic pressure (control)
Systolic pressure (at 90 min)
Diastolic pressure (control)
Diastolic pressure (at 90 min) 100
0
0.0 0.5 1.0 1.5
Vb/ Vmax *
* * * *
*
Table 1. Values with 100% Vmax.
Parameters Control Reperfusion (N = 7)
30 min (N = 7) 60 min (N = 7) 90 min (N = 6)
Ps 163.30 ± 6.21 131.70 ± 4.60* 131.70 ± 8.24* 100.70 ± 9.62*
Pd 7.43 ± 1.56 11.14 ± 4.73 14.00 ± 5.95 19.50 ± 4.73*
Pdev. 156.30 ± 5.71 121.90 ± 8.79* 116.60 ± 0.85* 100.00 ± 9.67*
dP/dtmax 1418.00 ± 71.15 1188.00 ± 93.70* 1159.00 ± 93.30* 1027.00 ± 31.40*
dP/dtmin -889.00 ± 73.45 -858.10 ± 86.21 -768.90 ± 63.04 -710.80 ± 60.79 ss 161.60 ± 4.45 102.70 ± 14.02* 110.70 ± 6.90* 101.00 ± 0.18*
Observe that with 30, 60 and 90 min reperfusion, all parameters, except dP/dtmin, were
significantly different compared to 100% Vmax. Vmax: maximum value; Ps: maximum peak
pressure; Pd: final diastolic pressure; Pdev.: pressure developed; dP/dtmax and dP/dtmin: first
derivative of maximum and minimum pressures, respectively; ss: systolic stress of the left ventricle.
*P<0.05 compared to control values (Student t-test)
animals does not seem to be a limiting factor. The use of smaller hearts in the preparation of the working heart type may be more
Figure 5. First derivative of maxi-mum (dP/dtmax, A) and minimum (dP/dtmin, B) pressures during the control period and after 90-min reperfusion. Data are re-ported as means ± 2 SEM. *P<0.05 compared to control (Student t-test).
dP/dt
max
(mmHg/s)
1500
1000
500
0
0.0 0.5 1.0 1.5
Control
90 min Control90 min
0
-500
-1000
-1500
0.0 0.5 1.0 1.5
dP/dt
min
(mmHg/s)
Vb/ Vmax Vb/ Vmax
A B
with any phase of the experiment. Since none of the cases required therapeutic trans-fusion, there was no need for blood typing. The use of a large support animal and a small volume of crystalloid solution were initially effective in maintaining almost normal hem-atocrit levels. Vasoactive drugs were not needed to maintain the support animal, which was an important factor since these drugs could cause secondary problems in the iso-lated heart, involving the inclusion of an-other variable in the protocol or the use of another vasoactive group of drugs.
Perfusion circuit
The perfusion circuit of the isolated heart with a conventional cardiotomy reservoir placed at a height of 120 cm was very prac-tical. The perfused heart model at constant pressure excluded the variations in the per-formance of an isolated heart dependent on the perfusion pressure.
Perfusion of the heart with different pres-sures produces a varied performance of ven-tricular function. Hence, when the perfusion pressure is approximately 50 mmHg, the performance is inferior to that at 90-mmHg pressure (20). Another reason for using con-stant pressure was to avoid conflicting re-sults when using a constant perfusion flow model. The models that use a constant flow in coronary perfusion present perfusion pres-sure variations due to their high or low resis-interesting because the cardiac output
devel-oped will be proportional. This means less blood circulating in the system and less dam-age to blood components.
Porcine models were chosen because the coronary anatomy and circulatory system of these animals are similar to those of man (8,9). The collateral coronary system is also similar because both species have few pre-existing collateral coronary arteries, although they have the capacity to develop a collateral circulatory system after myocardial infarc-tion (18). Although the myocardial collat-eral circulation in humans is heterogeneous, the porcine heart can be used as a highly sensitive model for the study of therapeutic interventions (19). A big difference in the porcine and human vascular anatomy is the hemiazygous vein that drains directly into the coronary sinus, but this did not interfere
* *
* *
* Control
90 min 200
100
0
Pressure (mmHg)
0.0 0.5 1.0 1.5
Vb/ Vmax *
* * * * * Figure 4. Pressure developed
tance. This could result in a better or poorer ventricular performance and also in changes in myocardial oxygen consumption second-ary to the Gregg phenomenon (21). This phenomenon has been discussed in the lit-erature and some points are cited below:
1) Hypoperfusion: the best performance is secondary to an increase in coronary per-fusion pressure resulting from an initial hy-poperfusion of the myocardium. This is a pathological explanation of the Gregg phe-nomenon as a nonphysiological fact (22).
2) It has been suggested in the literature that the Gregg phenomenon only occurs in a nonworking heart (23). However, this sug-gestion is not often supported in the litera-ture. Other investigators have observed this phenomenon in the working heart (24), which contradicts the findings by Ross Jr. et al. (23).
3) Distention of the coronary arteries as proposed by Lochner et al. (25): an increase in coronary perfusion pressure produces dis-tension, which causes distention of the sur-rounding myocardial fibers resulting in im-proved cardiac performance secondary to the Frank-Starling mechanism.
4) Oxygen flow and supply: according to Abel and Reis (26), in the absence of previ-ous ischemia, an increased cardiac perfor-mance in the Gregg phenomenon is second-ary to an increase in the flow and supply of oxygen. In this case, the Gregg phenomenon would only be a physiological response.
Hence, it seems reasonable to conclude that the Gregg phenomenon occurs and can be observed in working and nonworking heart preparations as long as they are not grossly hypoperfused and the coronary cir-culation remains intact. Another finding re-lated to the Gregg phenomenon is the Anrep effect.
Knowlton and Starling (27), in 1912, observed that a rapid increase in aortic pres-sure increased resistance to the flow in iso-lated heart-lung preparations, causing a posi-tive inotropic effect on the isolated heart,
which results in a gradual reduction of the diastolic volume of the left ventricle after a transitory dilation. In 1912, Anrep (28) also described this phenomenon. This slow im-provement in cardiac function, a few sec-onds after an increase in aortic pressure, was called the Anrep phenomenon (29).
According to Monroe et al. (30), this is due to momentary subendocardiac ischemia and redistribution of the secondary flow. Although the Anrep effect on working or nonworking hearts with constant flow or constant pressure as proposed by Monroe et al. (30) is debatable, no study has been con-ducted to test this hypothesis (29). Based on the data cited above, we opted for a model with constant pressure in order to avoid vari-able performance related to the Gregg phe-nomenon and the Anrep effect and not to interventions in the isolated heart.
The chamber prepared to receive the ef-fluent blood proved to be adequate as it accommodated the isolated heart well and
Figure 7. Values of elastance of the left ventricle for the different periods of reperfusion and con-trol. Data are reported as means ± 2 SEM. *P<0.05 compared to control (ANOVA).
Figure 6. Systolic stress of the left ventricle. Data are reported as means ± 2 SEM. *P<0.05 compared to control (Student t -test).
Control 90 min
Stress (kdyn/cm
2)
200
100
0
0.0 0.5 1.0 1.5
Vb/ Vmax
Elastance (mmHg/ml)
150
100
50
0
... ... ... ... ... ... ... ... ... ... ...
... ... ... ... ... ... ... ... ... ... ...
* *
*
Control 30 60 90
Time (min) 30-min regional ischemia 90-min global ischemia
had an efficient heat exchanger that warmed the blood returning to the support animal.
Polyvinyl tubes measuring 1/4 inch in internal diameter were used so that the initial filling volume was small, as shown by the minimum hematocrit variation of the sup-port animal.
The same system but with smaller reser-voirs and tubes with small internal diameters may be used for smaller animals.
Perfusion parameters to the isolated heart
Characterization of the perfusion of the isolated heart is important as it guarantees the control of variables such pH, electrolytes and hematocrit.
Although Heymans and Kochmann (3) described parabiotic circulation in 1904, it was only recently that the procedure started to be used more frequently. Pasini et al. (5) recently described the characterization of this model with regard to the response of the support animal to anesthesia, heparinization and parabiotic circulation. Anesthetic induc-tion and maintenance did not interfere with the arterial pressure of the support animal. Hemodynamic stability was good and in ac-cordance with the findings of Pasini et al. (5). There was no need for transfusion since the hematocrit level of the support animal remained stable, also in agreement with Pasini et al. (5) and Budrikis et al. (31). This is mainly because only a small volume was needed to fill the perfusion system and to return all the blood to the support animal. Saline (0.9%) was chosen to fill the system because it was easily available and did not contain potassium, with consequent reduced costs.
The partial pressure of oxygen supplied to the isolated heart was always above 300 mmHg, without a statistically significant variation. These data agree with those ob-tained by Budrikis et al. (31) who used para-biotic circulation in pigs with the PaO2
al-ways above 300 mmHg. Li et al. (20) utilized
parabiotic circulation during 6 h of perfu-sion with the PaO2 always higher than 200
mmHg and obtained results very similar to those obtained in the present study.
In our study, we did not measure the circulating catecholamines but Pasini et al. (5) showed that they increased after anesthe-sia and surgical manipulation, an event closely similar to the situation to which a patient is submitted during extracorporeal circulation.
Monroe et al. (15)demonstrated the role of the support animal in relation to the sup-ply of catecholamines and its possible action in clearance produced by the isolated heart in dogs with parabiotic circulation. In their experiment, they excluded the support ani-mal after stabilization and perfused the iso-lated heart with an isoiso-lated lung. There was a reduction in the effluent catecholamines in parallel to a fall in cardiac performance. On returning perfusion to the support animal, the catecholamines again increased and the performance also improved, regaining origi-nal values.
varia-tions in perfusion pressure. This indicated that preparations using blood had greater applicability in therapeutic interventions.
Isolated hearts respond differently to therapeutic intervention depending on whether the perfusion is done with blood or crystalloid solutions. When blood prepara-tions are utilized, the responses of the heart are more similar to those observed in clinical practice than in the case of crystalloid-per-fused hearts (6).
This demonstrates the utility of the mo-del used in this study, which is ideal for the study of cardiac performance under differ-ent perfusion conditions using differdiffer-ent sub-strates, drugs and surgical interventions, etc.
Methodology for the measurement of ventricular parameters
Langendorff type preparations have of-ten been used to measure contractile func-tion (12). Nevertheless, a common problem is comparing different hearts in different situations. The hearts may vary in size, de-gree of hypertrophy or dilation.
Heart rate, temperature and perfusion parameters can be normalized but the intra-ventricular volume cannot be fixed.
Various strategies have been described. Brooks et al. (11)studied hypertrophied hearts and set a reference volume of 0.025 ml/kg for the donor animal, which is used for com-paring different hearts. Eberli et al. (33), Feldman et al. (34), and Lorell et al. (35) studied hearts with concentric ventricular hypertrophy and fixed the ventricular vol-ume for a diastolic pressure of 10 mmHg. Glass et al. (36) used the necessary intraven-tricular volume (Vmax) to compare maximum
peak pressure developed. This strategy is very similar to the methods used to study papillary muscles, whereby the investigator measures the length of the longest papillary muscle (Lmax) to determine the highest
de-veloped tension. As Lmax standardizes the
other values, it is possible to compare
vary-ing lengths of papillary muscles (12). In the present study, the ventricular vol-ume was incremented and standardized by Vmax and the curves obtained for each
read-ing were compared with 50 and 100% Vmax
situations.
According to Strömer et al. (12), 50% Vmax was sufficient to determine the
differ-ences when conducting any kind of study on hearts. The authors emphasized the stan-dardization of intraventricular volume fol-lowed by a comparison of the hearts in terms of the same physiological factor.
In the present study, the physiological factors were assessed with 50 and 100% Vmax, and it was observed that 100% Vmax
had a greater capacity to demonstrate differ-ences and therefore was the most discerning factor.
The hemodynamic parameters studied were parameters commonly used (2). The physiological aspect at 100% Vmax
demon-strated significant differences throughout the reperfusion periods in terms of systolic pres-sure, developed pressure and dP/dtmax.
Diastolic pressure presented a gradual increase during the reperfusion process with a significant difference only at 90 min of reperfusion. This occurrence may have been due to very similar values or a greater diffi-culty in demonstrating alterations in the dia-stolic function of damaged hearts. As the dP/ dtmin did not demonstrate statistically
signifi-cant alterations, it was not a sensitive param-eter for diastolic function in this study.
Systolic stress was the only variable that showed statistically significant differences in all the reperfusion periods at 50 and 100% Vmax. According to Brooks et al. (11),it is a
highly sensitive measure of the cardiac con-tractile condition.
elastance is a highly sensitive indicator for demonstrating deterioration of the myocar-dial contractile condition. There was a re-duction in Emax 30 min after the beginning of
perfusion, which deteriorated during its course and reached its maximum fall at 90 min of perfusion. During the reperfusion of the hearts, it was observed that maximum elastance permitted early detection of the ventricular function alterations that occurred during reperfusion of the hearts. This index, which is independent of the preload and afterload, has proved to be highly sensitive to changes in the contractile condition and is in accordance with the findings of Suga (14), Sagawa et al. (37), Burkhoff and Sagawa (38)and Ko et al. (39).
Blood-perfused hearts present smaller
variations in coronary blood flow because of viscosity and oncotic properties (12). Al-though blood flow was not measured in this experiment, we believe that it was very close to clinical reality.
In summary, the model presented is eas-ily executable, provides a heart with control-lable variables that help develop different methods of study, but the team involved in the study should undergo a period of train-ing. Further studies using this preparation will achieve greater proximity to clinical reality because of the above cited peculiari-ties and will provide a powerful tool for the clinical investigation of new drugs and sur-gical interventions, as well as for studies on ischemia and myocardial reperfusion.
References
1. Döring HJ & Dehnert HD (1987). The isolated perfused warm-blooded heart according to Langendorff. In: Köberlein K (Editor), Methods in Experimental Physiology and Pharmacology. English edn. Biomesstechnik-Verlag March GmbH, Freiburg, Germany. 2. Döring HJ (1990). The isolated perfused heart according to
Langen-dorff technique - Function - Application. Physiologia Bohemoslo-vaca, 39: 481-504.
3. Heymans JF & Kochmann M (1904). Une nouvelle méthode de circulation artificielle à travers le coeur isolé de mammifère. Ar-chives Internationales de Pharmacodynamie et de Thérapie, 13: 531-538.
4. Masuda M, Chang-Chun C, Cho BC & Flameng W (1994). Coronary reserve and contractile reserve in crystalloid and blood perfused rabbit hearts. Heart and Vessels, 9: 175-182.
5. Pasini E, Solfrini R, Bachetti T, Marino M, Bernocchi P, Visioli F & Ferrari R (1999). The blood perfused isolated heart: characterization of the model. Basic Research in Cardiology,94: 215-222.
6. Qui Y & Hearse DJ (1992). Comparison of ischemic vulnerability and responsiveness to cardioplegic protection in crystalloid-perfused ver-sus blood-perfused hearts. Journal of Thoracic and Cardiovascular Surgery, 103: 960-968.
7. Walters III HL, Digerness SB, Naftel DCI, Waggoner III JR, Blackstone EH & Kirklin JW (1992). The response to ischemia in blood-perfused vs crystalloid-perfused isolated rat heart prepara-tions. Journal of Molecular and Cellular Cardiology, 24: 1063-1077. 8. Sack WO (1982). Essentials of pig anatomy. In: Maughan L (Editor),
Veterinary Textbooks. Ithaca, New York, NY, USA.
9. Peng CF, Kane JJ & Jones EM (1983). The adverse effect of sys-temic hypertension following myocardial reperfusion. Journal of Surgical Research, 34: 59-67.
10. Flecknell PA (Editor) (1996). Anaesthetic management. In: Labora-tory Animal Anaesthesia. A Practical Introduction for Research Work-ers and Technicians. Academic Press, San Diego, CA, USA.
11. Brooks WW, Healey NA, Sem S, Conrad CH & Bing OHL (1993). Oxygen costs of stress development in hypertrophied and failing hearts from the spontaneously hypertensive rat. Hypertension, 21: 56-64.
12. Strömer H, Cittadini A, Szymanska G, Apstein CS & Morgan JP (1997). Validation of different methods to compare isovolumic car-diac function in isolated hearts of varying sizes. American Journal of Physiology, 272: H501-H510.
13. Mirsky I (1979). Elastic properties of the myocardium: a quantitative approach with physiological and clinical applications. In: Handbook of Physiology. The Cardiovascular System. The Heart. Section 2. Vol. 1. Chapter 14. American Physiology Society, Bethesda, MD, USA, 497-531.
14. Suga H (1971). Left ventricular time-varying pressure/volume ratio in systole as an index of myocardial inotropism. Japanese Heart Jour-nal, 12: 153-160.
15. Monroe RG, La Farge CG, Gamble WJ, Hammond RP & Gamboa R (1966). Left ventricular performance and blood catecholamine levels in the isolated heart. American Journal of Physiology, 211: 1248-1254.
16. Gamble WJ, Conn PA, Kumar E, Plenge R & Monroe RG (1970). Myocardial oxygen consumption of blood-perfused, isolated, sup-ported, rat heart. American Journal of Physiology, 219: 604-612. 17. Werner JC, Whitman V, Fripp RR, Schuler HG & Morgan HE (1981).
Carbohydrate matabolism in isolated, working newborn pig heart. American Journal of Physiology, 241: E364-E371.
18. Swindle MM & Bobbie DI (1986). Anatomic and anesthetic consider-ations in experimental cardiopulmonary surgery in swine. Laboratory Animal Science, 36: 357-361.
myocardial function after 6-hour preservation with blood cardiople-gia. Annals of Thoracic Surgery, 65: 115-124.
21. Gregg D (1963). Effect of coronary perfusion pressure or coronary flow on oxygen usage of the myocardium. Circulation Research, 13: 497-500.
22. Buckley NM, Porter EP & Jedeikin LA (1970). Effect of varying coronary perfusion on ventricular function in isolated dog hearts. American Journal of Physiology, 218: 1399-1405.
23. Ross Jr J, Kolcke F, Kaiser G & Braunwald E (1963). Effect of alteration of coronary blood flow on the oxygen consumption of the working heart. Circulation Research, 13: 510-513.
24. Arnold G, Morgenstern C & Lochner W (1970). The autoregulation of the heart work by the coronary perfusion pressure. Pflügers Archiv, 321: 34-55.
25. Lochner W, Arnold G, Kosche F, Miessner E & Neitzer A (1968). The importance of the perfusion pressure in the coronary arteries for the contractility and the oxygen consumption of the heart. Pflügers Archiv, 299: 339-356.
26. Abel RM & Reis RL (1970). Effects of coronary blood flow and perfusion pressure on left ventricular contractility in dogs. Circula-tion Research, 27: 961-971.
27. Knowlton FP & Starling EH (1912). The influence of variations in temperature and blood pressure on the performance of the isolated mammalian heart. Journal of Physiology,44: 206-219.
28. Anrep GV (1912). On the part played by the suprarenals in the normal vascular reactions of the body. Journal of Physiology,45: 307-317.
29. Feigl E (1983). Coronary physiology. Physiological Reviews, 63: 1-161.
30. Monroe RG, Lafarge CG, Gamble WJ, Rosenthal A & Honda S (1968). Left ventricular pressure volume relations and performance as affected by sudden increases in developed pressure. Circulation Research, 22: 333-334.
31. Budrikis A, Bolys R, Liao Q, Ingemansson R, Sjoberg T & Steen S (1998). Function of adult pig hearts after 2 and 12 hours of cold cardioplegic preservation. Annals of Thoracic Surgery, 66: 73-78. 32. Stahl LD, Weiss HR & Becker LC (1988). Myocardial oxygen
con-sumption, oxygen supply/demand heterogeneity and microvascular patency in regionally stunned myocardium. Circulation, 4: 865-872. 33. Eberli FR, Apstein CS, Ngoy S & Lorell BH (1992). Exacerbation of
left ventricular ischemic diastolic dysfunction by pressure-overload hypertrophy. Circulation Research, 70: 931-943.
34. Feldman AM, Weinberg EO, Ray PE & Lorell BH (1993). Selective changes in cardiac gene expression during compensated hypertro-phy and the transition to cardiac decompensation in rats with chronic aortic banding. Circulation Research, 73: 184-192.
35. Lorell BHL, Wexler S, Momomura S, Weinberg E & Apstein CS (1986). The influence of pressure overload left ventricular hypertro-phy on diastolic properties during hypoxia in isovolumically contract-ing rat hearts. Circulation Research, 58: 653-663.
36. Glass MG, Fuleihan F, Liao R et al. (1993). Differences in cardiopro-tective efficacy of adrenergic receptor antagonists and Ca2+ channel antagonists in an animal model of dilated cardiomyopathy. Effects on gross morphology, global cardiac function, and twitch force. Circulation Research, 73: 1077-1089.
37. Sagawa K, Suga H, Shoukas AA & Bakalar K (1977). End systolic pressure volume ratio: a new index of contractility. American Jour-nal of Cardiology, 40: 748-753.
38. Burkhoff D & Sagawa K (1986). Ventricular efficiency predicted by an analytical model. American Journal of Physiology, 250: R1021-R1027.