Amyotrophic lateral sclerosis
Prospective study on respiratory parameters
Sara Regina Meira Almeida1,Luciano Bruno C. Silva2, Carlos Alberto M. Guerreiro3, Anamarli Nucci4
ABSTRACT
Objective: To verify how efficient respiratory parameters are in the follow-up of subjects with amyotrophic lateral sclerosis (ALS) and to observe possible correlations between respiratory and nutritional functions. Method: Sixteen patients with probable or defined ALS were selected and evaluated over eight months using the following respiratory parameters: spirometry, maximum inspiratory pressure (MIP), maximum expiratory pressure (MEP), arterial gasometry and pulse oximetry; and nutritional parameters such as body mass index (BMI) and percentage weight loss. Results: PaCO2 was a significant parameter to
follow up disease evolution (p=0.051). There was significant correlation between MIP and MEP (r: 0.83); BMI and MIP (r: 0.70); BMI and MEP (r: 0.72); pulse oximetry and forced vital capacity (r: 0.57). Conclusion: PaCO2 wasshown to be an efficient and significant parameter
in the measurement of respiratory impairment; the correlations among MIP, MEP and BMI indicated that these are significant parameters for periodic clinical evaluation.
Key words: amyotrophic lateral sclerosis, maximum inspiratory pressure, maximum expiratory pressure, body mass index.
Esclerose lateral amiotrófica: estudo prospectivo de parâmetros respiratórios
RESUMO
Objetivo: Verificar a eficácia dos parâmetros respiratórios na evolução de indivíduos com esclerose lateral amiotrófica (ELA) e identificar possíveis correlações entre função respiratória e nutricional. Método: 16 pacientes com diagnóstico provável ou definido de ELA foram selecionados por critérios definidos e avaliados, durante 8 meses, através de parâmetros respiratórios: espirometria, pressão inspiratória máxima (PIM), pressão expiratória máxima (PEM), gasometria arterial e oximetria de pulso; e parâmetros nutricionais: índice de massa corporal (IMC) e porcentagem de perda de peso. Resultados: PaCO2 foi um parâmetro significativo para acompanhar a evolução da doença (p=0.051).
Houve correlação significante entre PIM e PEM (r: 0.83); IMC e PIM (r: 0.70); IMC e PEM (r: 0.72); oximetria de pulso e capacidade vital forçada (r: 0.57). Conclusão: PaCO2 foi
marcador eficaz e significante para medir o comprometimento respiratório; correlações entre PIM, PEM e IMC indicaram ser bons parâmetros nas avaliações clínicas periódicas. Palavras-chave: esclerose lateral amiotrófica, pressão inspiratória máxima, pressão expiratória máxima, índice de massa corporal.
Correspondence Anamarli Nucci
Departamento de Neurologia Universidade de Campinas, UNICAMP 13083-970 Campinas SP - Brasil E-mail: [email protected]
Support
The study had the support of CAPES (Comissão de Aperfeiçoamento de Pessoal de Nível Superior)
Received 15 September 2009 Received in final form 26 October 2009 Accepted 10 November 2009
1MSc, Physiotherapist, Department of Neurology, School of Medical Sciences, University of Campinas (UNICAMP), Campinas
SP, Brazil; 2PhD, School of Food Engineering, University of Campinas (UNICAMP), Campinas SP, Brazil. Professor at Federal
University of Alfenas (UNIFAL), Alfenas MG, Brazil; 3Full Professor, Department of Neurology, School of Medical Sciences,
University of Campinas (UNICAMP), Campinas SP, Brazil; 4Associate Professor, Department of Neurology, School of Medical
Sciences, University of Campinas (UNICAMP), Campinas SP, Brazil. Amyotrophic lateral sclerosis (ALS) is a degenerative disease that afects mo-tor neurons in the brain and spinal cord. Clinical characteristics include limb
weak-ness, diiculties in swallowing, speaking and breathing1.
motor nuclei, increases the risk of aspiration pneumonia, aggravating the respiratory function, which is sometimes already impaired. Swallowing dysfunction leads to nutri-tional deiciency and consequently to a morbid spiral that increases respiratory muscle fatigue2. Nutritional status
is aggravated unless it is routinely monitored in order to identify when a patient shows weight loss and malnutri-tion3. Early intervention helps to delay morbidity.
his study was aimed at evaluating how eicient re-spiratory parameters are in the assessment of ALS evo-lution, as well as observing possible correlations between respiratory and nutritional functions.
METHOD
Patients with deined or probable ALS, according to the revised El Escorial, 19984, were followed up at the
out-patient clinic for Neuromuscular Diseases of the Universi-ty of Campinas (UNICAMP), and participated in a cross-sectional study with respiratory and nutritional evalua-tion (irst evaluaevalua-tion) and a longitudinal prospective study for eight months, during which respiratory parameters were observed. All the patients were in use of Riluzole and were sporadic cases. hose patients requiring assist-ed mechanical ventilation or with a nasogastric tube or gastrotomy at the beginning of the study were excluded. he ethics committee of the School of Medical Sci-ences - UNICAMP approved the study and all patients signed an informed consent form (protocol 347/2006).
In the initial evaluation, named the irst evaluation, patients were assessed using spirometry; maximum in-spiratory pressure (MIP), maximum expiratory pressure (MEP), gasometry and pulse oximetry. hree subsequent evaluations every two months included the same tests, except for spirometry.
Spirometry was carried out in the seated position, and included measurement of forced vital capacity (FVC) and peak expiratory low (PEF) expressed as percentages of the predicted value, according to sex and age.
Maximum inspiratory pressure and maximum expira-tory pressure: MIP and MEP measurements were carried out, in accordance with Black and Hyatt, and based on the residual volume and total pulmonary capacity, respective-ly, at three consecutive moments, with a 30-second inter-val between maneuvers. he highest inter-value was considered.
Arterial gasometry: partial arterial oxygen pressure (PaO2) <83 mmHg and partial arterial carbonic gas pres-sure (PaCO2) >45 mmHg were considered abnormal6.
Pulse oximetry was measured using a Moryia 1001 model oximeter.
Symptoms of respiratory muscle weakness: dyspnoea on exertion, morning headaches, fatigue, disturbed sleep (insomnia, excessive daytime somnolence, nocturia, impatience)7..
Body mass index (BMI): BMI=body mass kg/height m2; a
value between 18.5 and 24.9 kg/m2 was considered normal 8. Percentage weight loss (WL%) was determined by comparing usual and current patient weight. Weight loss of 10% indicated malnutrition and above 10% indicated severe malnutrition9.
Body mass index and percentage of weight loss were measured in the irst evaluation.
Statistical analysis
In order to compare the evolution of continuous vari-ables, the analysis of variance (ANOVA) was used for re-peated measurements with Rank transformation. Correla-tions between variables were found using Spearman’s co-eicient. Values were classiied as: 0 to 0.19 – weak corre-lation; 0.2 to 0.39 – mild correcorre-lation; 0.4 to 0.59 – moder-ate correlation; 0.6 to 0.79 – important correlation; 0.8 to 1 – almost perfect correlation10. he Statistical Analysis
System (version 9.1.3) and Microcal Origin software (ver-sion 5.0) were used. A signiicance level was p≤0.05.
RESULTS
Table 1 shows the demographic data of the patients; four cases (2, 5, 6 and 9) had predominant bulbar ALS and 12 had predominant appendicular ALS. hirteen male pa-tients and three females were within normal range of pul-monary function test parameters, pulse oximetry and ar-terial gasometry. he MIP reached 49% of what was ex-pected, according to the patients’ sex and age and the MEP was 34.7%, indicating restrictive muscle impairment.
he mean BMI for patients subjected to the test (n=10) was 22.54, which is within normal range, although WL% indicated that three patients were nutritionally at-risk, ive had severe malnutrition and two had gained body mass (patients 1 and 8, Table 1). he mean WL% was 13.3%.
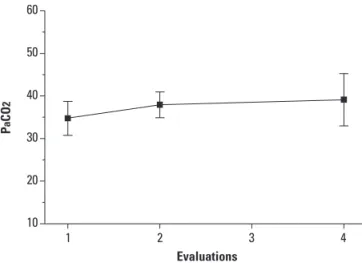
Five out of 16 patients evaluated for PaCO2 succeed-ed in carrying out the tests on a continuous basis in the irst, second and fourth evaluations. In these patients, the mean values of PaCO2 ranged between 34.74 in the irst evaluation and 39.12 mmHg in the last one, with statisti-cal relevance (p=0.0513) (Figure). he mean PaO2 of these patients ranged between 87.16 in the irst evaluation and 89.18 mmHg in the last one, with no statistical relevance (p=0.7504).
Maximum inspiratory pressure was evaluated four times in 15/16 patients and MEP in 14/16. he MIP mean ranged between –65.67 cmH2O (irst exam) and –64.33 cmH2O (fourth exam); this decrease was not signiicant (p=0.7764). he MEP mean ranged between 74.29 cmH2O and 71.79 cmH2O, also with no signiicance (p=0.7671). The MIP and MEP values showed high variability and great standard deviation.
vari-ation in the 16 patients: 95.25% in the irst evaluvari-ation and 95.13% in the last one, with no signiicant statistical vari-ance (p=0.1816).
Strong correlation between MIP and MEP was ob-served (r: 0.83500; p=0.0002). Body mass index strongly
Table 1. Descriptive variables in the irst evaluation.
Cases Age Sex MIP MEP Oxi%
Spirometry Gasometry
BMI %WL
FVC% PEF% PaO2 PaCO2
1 59 M –55 50 97 98 114 93.1 34.6 25.1 –15.4
2 40 F –10 nap 95 nap nap 91.2 37.2 18.2 14.3
3 49 M –45 40 94 60 59 102 38.4 18.1 26.4
4 46 M –135 130 96 109 103 61 29.1 24.2 14.6
5 32 F –10 10 86 54 47 134 29 19.5 7.4
6 42 M –45 30 97 nap nap 79 37 19.9 21.8
7 53 M –110 95 98 87 78 85.7 30.2 27 2.1
8 44 M –100 80 99 96 104 89.6 35.8 24.4 –1.2
9 37 M –35 45 97 nap nap 92 38 21.3 8.7
10 36 M –60 80 94 80 95 73 36 27.7 11.1
11 52 M np np 96 np np 70.7 38.6 – –
12 62 F –70 60 92 80 92 75.1 33.6 – –
13 41 M –30 60 96 52 49 75 42 – –
14 49 M –110 125 96 91 86 86.9 39.5 – –
15 43 M –45 85 96 102 102 109 33 – –
16 35 M –125 150 95 76 73 np np – –
Mean 45 – 65.66 74.28 95.25 82.08 83.5 87.82 35.46
SD 8.4 – 40.78 40.32 2.97 18.82 22.45 17.89 3.87
Median 44.5 – 55 70 96 52 47 86.9 36
Min 32 – 10 10 86 83.5 89 61 29
Max 62 – 135 150 99 109 114 134 42
M: male; F: female; MIP: maximum inspiratory pressure; MEP: maximum expiratory pressure; Oxi: Pulse oximetry; FVC%: percentage of forced vital capacity; PEF%: peak expiratory low percentage; PaO2: partial arterial oxygen pressure; PaCO2: partial arterial carbonic gas pressure; BMI: body mass index; %WL: percentage
weight loss; nap: not able to perform the test; np: test not performed.
1 2 3 4 10
20 30 40 50 60
P
a
C
O
2
Evaluations
Figure. Mean and standard deviation of PaCO2 evolution in the three evaluations. ANOVA Test, p-value=0.0513.
Table 2. Spearman’s correlation coeicient between respiratory and nutritional parameters
BMI %WL MIP MEP
PaO2 –0.527 –0.224 –0.50222 –0.44904
PaO2 0.117 0.53 0.0672 0.1237
n 10 10 14 13
PaCO2 –0.418 –0.491 –0.26549 –0.15152
PaCO2 0.229 0.15 0.3589 0.6212
n 10 10 14 13
Oxi 0.443 –0.474 0.23863 0.13887
Oxi 0.2 0.166 0.3917 0.6359
n 10 10 15 14
MIP 0.70123 –0.17683 – 0.83500
MIP 0.0239 0.6250 – 0.0002
n 10 10 – 14
MEP 0.72804 –0.23431 – –
MEP 0.0262 0.5440 – –
n 9 9 – –
PaO2: partial arterial oxygen pressure; PaCO2: partial arterial carbonic gas
correlated with MIP (r: 0.7012; p=0.0239) and with MEP (r: 0.7280; p=0.0262), with no signiicance in other com-parisons (Table 2).
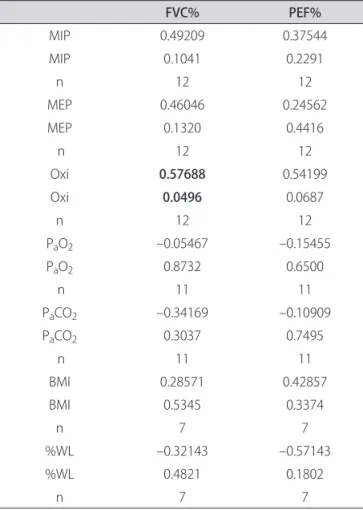
here was moderate signiicance in correlation between pulse oximetry and FVC values (r: 0.5768; p=0.0496), with no signiicance in other comparisons (Table 3).
DISCUSSION
PaCO2 proved to be an eicient indicator in the eval-uation of respiratory impairment throughout the eight months. here was an increase in the mean values, even though they remained within the normal range, that is, lower than 45 mmHg. Lyall et al.11 reported that P
aCO2 is one of the main parameters used as an indication for starting noninvasive mechanical ventilation in ALS, al-though it is not very sensitive due to the late manifesta-tion of hypercapnia. It can be supposed that as the dis-ease evolves, hypercapnia may trigger a vicious cycle of pulmonary function worsening and the necessity of ven-tilation support.
Lyall et al.11 recruited 81 patients with ALS to
evalu-ate their hypercapnia as a respiratory function complica-tion prognosticator. he PaCO2 mean was 41.7 mmHg and only 18% of the subjects had hypercapnia. he au-thors reported that in the presence of a mild weakness, PaCO2 drops below normal levels and hyperventilation occurs to compensate for alveolar hypoxemia.
According to the American Academy of Neurology there is a lack of evidence of the best parameter to detect respiratory failure. here are no previous studies that eval-uate the relationship between respiratory muscle strength and ventilation failure in large samples of ALS patients12.
In this study, arterial gasometry and pulse oximetry values remained normal during the eight-month follow-up. he MIP and MEP values were 60% below what was expected after the irst evaluation, which already indicates the beginning of respiratory muscle impairment 5 even
though the data was not statistically signiicant.
It is a common belief that PaCO2, together with pul-monary hypoventilation signs, may indicate a respirato-ry impairment throughout time, and that it is an indica-tor for preventive procedures such as, for instance, the use of noninvasive ventilation support7.
Vital capacity is one of the most used clinical tests to monitor pulmonary function13. Patients with severe
restrictive ventilation impairment resulting from neu-romuscular diseases show a more signiicant reduction of pulmonary volume than maximum pressures. here-fore, vital capacity is a more sensitive measurement in the evaluation of respiratory muscle strength in the advanced stage of these diseases14 .
Jackson et al.15, in their studies on pulmonary function
in ALS, reported that most of the patients, even though their FVC was 70% above expected, had MIP lower than 60 cm H2O, which may relect an early respiratory in-suiciency. Our study corroborates that, since the FVC mean was 82% of the expected value and the MIP mean was 49% of what was expected.
Pulse oximetry was carried out during outpatient clin-ical evaluations, and it was not possible to monitor our patients during nights. Even so, there was a positive cor-relation between oximetry and FVC, demonstrating the importance of evaluating respiratory parameters on a reg-ular basis.
Dysfunction of inspiratory, expiratory and bulbar mus-cles may result in oxygen desaturation due to hypercapnia, coughing dysfunction and excessive aspiration of saliva. In those conditions, noninvasive ventilation support helps to normalize PaCO2 values and oxygen desaturation16.
here was no correlation between pulse oximetry and arterial gasometry, probably because patients had not yet shown severe respiratory impairment, with hypercapnia and symptoms of respiratory muscle weakness such as dyspnea on efort, fatigue, morning headache or sleep
dis-Table 3. Spearman’s correlation coeicient between spirometry and other variables.
FVC% PEF%
MIP 0.49209 0.37544
MIP 0.1041 0.2291
n 12 12
MEP 0.46046 0.24562
MEP 0.1320 0.4416
n 12 12
Oxi 0.57688 0.54199
Oxi 0.0496 0.0687
n 12 12
PaO2 –0.05467 –0.15455
PaO2 0.8732 0.6500
n 11 11
PaCO2 –0.34169 –0.10909
PaCO2 0.3037 0.7495
n 11 11
BMI 0.28571 0.42857
BMI 0.5345 0.3374
n 7 7
%WL –0.32143 –0.57143
%WL 0.4821 0.1802
n 7 7
MIP: maximum inspiratory pressure; MEP: maximum expiratory pressure; Oxi: pulse oximetry; PaO2: partial arterial oxygen pressure; PaCO2: partial arterial
orders. Constant measurement of oxygen saturation is assumed to be necessary to decide what is the ideal mo-ment to start noninvasive mechanical ventilation when a patient complains of what is evidence of nocturnal pul-monary hypoventilation.
Lyall et al.11 demonstrated signiicant correlation
be-tween PaCO2 and MIP and MEP. he low values obtained in respiratory muscle strength tests led to hypercapnia. Hypercapnia occurs when weakness becomes severe, lead-ing to ventilation failure. As no correlation between these parameters was found, it is assumed that weakness of re-spiratory muscles in our patients was mild to moderate.
Just like Lechtzin17, we assume it is a wise procedure
to measure PaCO2 when spirometry is unable to explain symptoms of respiratory complications in patients or if they report sleeping diiculties.
he most signiicant correlation of BMI and respiratory parameters was between MIP and MEP, in which patients with greater weakness and reduced body mass showed re-duced respiratory muscular strength. here was no corre-lation between BMI and spirometry since the patients pre-sented with normal values for FVC and spirometry. his is probably because spirometry is not sensitive enough to evaluate ventilation function in initial or moderate stages of respiratory discomfort, as reported by Schoesmith et al.18.
he results found in this study corroborate those ob-tained by Silva et al.19 who also found correlation
be-tween BMI and FVC and bebe-tween BMI and MEP in pa-tients who presented with bulbar ALS. he correlation was strong, even considering MIP and MEP indicators are not a sensitive measure in the evaluation of the respi-ratory function in these patients, due to oro-pharyngeal weakness, as described by Fitting et al.20.
Desport et al. 21 evaluated nutritional status through
the use of BMI in ALS patients. In their study, the surviv-al rate time was shorter in msurviv-alnourished patients when compared to the group considered as normal. he nu-tritional status was a decisive factor for survival, as a vi-tal capacity 60% higher than the expected value. Howev-er, both measurements were considered as independent prognostic values.
In the patients that had BMI assessed, the FVC mean was 83.4% of the predicted value. Only two out of the 10 patients who had their BMI evaluated in the irst visit had values below normal. When evaluated by WL%, ive pa-tients showed severe malnutrition, in other words, a loss greater than 10%, according to Mahan and Stump9
val-ues. Rio and Cawadias3 suggest that body weight to
eval-uate nutritional status in ALS patients should not be un-derestimated; however, impaired mobility may be a lim-itation in the measurement of this parameter. Nutrition-al support may delay weight loss and muscular atrophy. Studies have demonstrated that body weight loss
associ-ated with bulbar changes (dysphagia and breathing) re-quires early and speciic nutritional support22.
he intervention of the multidisciplinary team, such as physicians, physiotherapists, nutritionists and speech therapists, is necessary to evaluate the patient as a whole. A more comprehensive healthcare protocol allows the pa-tient an improved quality of life.
In conclusion, PaCO2 wasshown to be an eicient and signiicant parameter to in the measurement of respira-tory impairment. he correlations among MIP, MEP and BMI indicated that these are signiicant parameters for periodic clinical evaluation.
REFERENCES
1. Orrell RW. Understanding the causes of amyotrophic lateral sclerosis. New Eng J Med 2007;357:822-823.
2. Hardiman O. Symptomatic treatment of respiratory and nutritional failure in amyotrophic lateral sclerosis. J Neurol 2000;247:245-251.
3. Rio A, Cawadias E. Nutritional advice and treatment by dietitians to patients with amyotrophic lateral sclerosis/motor neurone disease: a survey of current practice in England, Wales, Northern Ireland and Canada. J Hum Nutr Diet 2007;20:3-13.
4. El Escorial revisited: revisited criteria for the diagnosis of ALS - World Feder-ation of Neurology research group on motor diseases. A consensus confer-ence held at Airlie House. Worrenton 1998:2-4.
5. Black LF, Hyatt RE. Maximal respiratory pressures: normal values and relation-ship to age and sex. Am Rev Respir Dis 1969;99:696-702.
6. Terzi RGG. Equilíbrio ácido-básico e transporte de oxigênio. São Paulo: Ed Manole, 1992.
7. Leigh PN, Abrahams S, Al-Chalabi A, et al. The management of motor neu-rone disease. J Neurol Neurosurg Psychiatry 2003;74:32-47.
8. Organizacion Mundial de la Salud. Necesidades de energia y proteínas. Informe de uma reunion consultiva conjunta FAO/OMS/UNU de expertos. Genebra, 1985. 9. Mahan K, Stump SE. Krause: alimentos, nutrição e dietoterapia. 11ª Ed. São
Paulo: Roca, 2005:535-569.
10. Landis JR, Koch GG. The measurement of observer agreement for categori-cal data. Biometrics 1977;33:159-174.
11. Lyall RA, Donaldson N, Polkey MI, Leigh PN, Moxham J. Respiratory muscle strength and ventilatory failure in amyotrophic lateral sclerosis. Brain 2001; 124:2000-2013.
12. Miller RG, Rosenberg JA, Gelinas DF, et al. Practice parameter: the care of the patient with amyotrophic lateral sclerosis (an evidence-based review): report of the Quality Standards Subcommittee of the American Academy of Neu-rology. Neurology 1999;52:1311-1323.
13. ATS/ERS. American Thoracic Society/European Respiratory Society. ATS/ ERS statement on respiratory muscle testing. Am J Respir Crit Care Med 2002; 166:518-524.
14. Perez T. Neuromuscular disorders: assessment of the respiratory muscles. Rev Neurol 2006;4:437-444.
15. Jackson CE, Rosenfeld J, Moore DH, et al. A preliminary evaluation of a pro-spective study of pulmonary function studies and symptoms of hypoventi-lation in ALS/MND patients. J Neurol Sci 2001;191:75-78.
16. Bach JR, Bianchi C, Auiero E. Oximetry and indications for tracheotomy for amyotrophic lateral sclerosis. Chest 2004;126;1502-1507.
17. Lechtzin N. Respiratory efects of amyotrophic lateral sclerosis: problems and solutions. Respir Care 2006;51:871-881.
18. Shoesmith CL, Findlater K, Rowe A, Strong MJ. Prognosis of amyotrophic lateral sclerosis with respiratory onset. J Neurol Neurosurg Psychiatry 2007;78:629-631. 19. Silva LBC, Mourão LF, Silva AA, et al. Amyotrophic lateral sclerosis: com-bined nutritional, respiratory and functional assessment. Arq Neuropsiquia-tr 2008;66:354-359.
20. Fitting JW, Paillex R, Hirt L, Aebischer P, Schluep M. Snif nasal pressure: a sen-sitive respiratory test to assess progression of amyotrophic lateral sclerosis. Ann Neurol 1999;46:887-893.
21. Desport JC, Preux PM, Truong TC, Vallat JM, Sautereau D, Couratier P. Nu-tritional status is a prognostic factor for survival in ALS patients. Neurology 1999;53:1059-1063.