Bio che m ical pro file o f am nio tic fluid
fo r the asse ssm e nt o f fe tal and re nal
de ve lo pm e nt
1Divisão de Medicina Materno-Fetal,Departamento de O bstetrícia e Ginecologia,
and 2Divisão de Nefrologia, Departamento de Medicina Interna,
Hospital de Clínicas de Porto Alegre, Universidade Federal do Rio Grande do Sul, Porto Alegre, RS, Brasil
F.R. O liveira1,
E.G. Barros2 and
J.A. Magalhães1
Abstract
Creatinine plays a key role in the function and maturation of fetal kidneys throughout pregnancy. It is important to identify other mark-ers that may help in the diagnosis of renal dysfunction. Our aim was to determine the profile of and the correlation between biochemical markers to be used to assess renal function and maturation of the fetus in the amniotic fluid during pregnancy and to determine the distribu-tion of normal values for creatinine, N-acetyl-ß-D-glucosaminidase (NAG), ß2-microglobulin, glucose, urea, sodium, potassium, phos-phorus, calcium, uric acid, albumin, and osmolality in three gesta-tional age groups. This was a cross-section study that assessed 115 samples of amniotic fluid during three different periods of pregnancy, i.e., 13 to 20, 27 to 34, and 36 to 42 weeks. Concentrations of creatinine, NAG, urea, potassium and uric acid increased during pregnancy (P<0.05). ß2-Microglobulin, glucose, sodium, phospho-rus, calcium, and albumin concentration and osmolality decreased (P<0.05), whereas ß2-microglobulin, glucose and uric acid presented significant correlations with gestational age and creatinine, respec-tively (r>0.6, P<0.05). Urea, potassium and phosphorus showed mild correlations with both (r>0.5, P<0.05). NAG, sodium, albumin and osmolality did not show significant correlations (r<0.5, P<0.05). These tests confirmed the important role of creatinine in terms of correlation with gestational age. ß2-Microglobulin, glucose and uric acid were significant as markers of function and maturation of fetal kidneys, whereas NAG did not demonstrate a useful role for the assessment of renal maturation.
Co rre spo nde nce
F.R. O liveira
Rua Dr. Florêncio Ygartua, 300/301 90430-010 Porto Alegre, RS Brasil
Fax: + 55-51-3222-9074 E-mail:
fernando@ equipemedica.com.br
Received July 6, 2001 Accepted November 14, 2001
Ke y words
•Fetal renal maturation •Normal pregnancy •Amniotic fluid •Creatinine •ß2-Microglobulin •Glucose
•Uric acid
Intro ductio n
A normal volume of amniotic fluid was initially considered as the only index of fetal kidney development, but the origin and con-centration of many biochemical substances later began to be investigated (1,2). Many advances in diagnostic methods during the
Grupe (4) and Shackelford et al. (5), the sonographic findings were not sufficient to assess renal function.
Analysis of creatinine and urea in amni-otic fluid permits an evaluation of renal matu-ration and functionality throughout preg-nancy (6-9). Creatinine values in the amni-otic fluid that best represent fetal maturity are 1.5 to 2.0 mg/dl (6,10). A creatinine concentration of 1.75 mg/dl or more corre-lates significantly with a gestational age of 37 weeks or more (11). Other biochemical markers such as N-acetyl-ß-D-glucosamini-dase (NAG) (12) and ß2-microglobulin (13) have been used as an index of renal maturity. In cases of malformations such as ob-structive uropathy, the concentrations of so-dium, ß2-microglobulin and the osmolality of the fetal urine are important to evaluate fetal impairment and the necessity of cath-eter placement (14). The aim of the present study was to determine amniotic fluid changes evaluated by biochemical renal markers in three gestational age groups of normal pregnancies.
Patie nts and Me thods
In a cross-section study we selected 115 pregnant patients from the Hospital de Clínicas de Porto Alegre, from January 1998 to December 1999. The pregnant women were divided into groups corresponding to three different periods of pregnancy, i.e., 13 to 20 weeks (group 1), 27 to 34 weeks (group 2) and more than 36 weeks (group 3). Gesta-tional age was determined on the basis of the last menstrual period and by timing sono-grams. The amniotic fluid samples of group 1 were drawn by amniocentesis from preg-nant women who were attended at Hospital de Clínicas de Porto Alegre for cytogenetic evaluation. Group 2 and 3 samples were drawn by amniocentesis from pregnant women who presented fetal risk or by cesar-ean section indicated only for obstetrical reasons.
The exclusion criteria were as follows: pregnant women with serum creatinine >0.9 mg/dl, oligohydramnios, chorioamnionitis, chromosomal abnormalities, congenital de-fects, use of nephrotoxic drugs during preg-nancy, pregnant women with unreliable ges-tational age, hypertension or diabetes, and Rh-sensitized and pregnant women who had a cesarean section for newborns with fetal distress or Apgar score below 7 in the first minute. If subsequent cytogenetic study pre-sented any anomaly, patients were also ex-cluded. Maternal blood was drawn by veni-puncture without anticoagulants at the same time as the amniotic fluid sample. All am-niocenteses were performed by the transab-dominal route using a 22-gauge spinal needle or during a cesarean section after hystero-tomy, with removal of approximately 10 to 20 ml of amniotic fluid. Samples containing blood or meconium were discarded. Amni-otic fluid and maternal blood samples were stored at -20ºC if not analyzed on the same day and a reading was carried out within two weeks at the Biochemistry and Radioimmu-noassay Laboratories of Hospital de Clínicas de Porto Alegre.
Creatinine, NAG, ß2-microglobulin, glu-cose, sodium, potassium, urea, phosphorus, calcium, uric acid and albumin concentra-tions, and osmolality were determined in amniotic fluid and maternal serum. Some samples of amniotic fluid were too small to analyze all markers. Creatinine, urea, uric acid, calcium, glucose, phosphorus and al-bumin are reported as mg/dl, osmolality as mOsm/l, and sodium and potassium as mEq/l. Creatinine, urea, uric acid, glucose, cal-cium, phosphorus, albumin and osmolality were all determined with an automatic ana-lyzer (“Mega Kits Merck Diagnostic”). NAG analysis was performed in Ul/min by colori-metry using substrates such as 4-phenyl-N-acetyl-glucosamine and nitrate buffer. ß2-Microglobulin was determined by the Im-mulite technique and is reported as ng/ml.
Committee of Hospital de Clínicas de Porto Alegre. All samples were obtained after the patients were informed about the potential risks and the objectives of the study and gave written consent to participate.
Statistical analysis
A data base was created using the Epi-Info 6.04 program (CDC, Atlanta, GA, USA). Statistical analysis was carried out using the SPSS 8 program. All data are reported as means ± SD and range of measured levels. Differences in mean concentrations of the variables among the three selected amniotic fluid periods were analyzed by one-way anal-ysis of variance (ANOVA). Nonparametric Kruskal-Wallis tests were applied when vari-able distribution did not adjust to the normal curve. The Duncan test was used when ANOVA or Kruskal-Wallis identified any difference among the three gestational peri-ods. We used a formula based on a 95% confidence interval and standard error to determine the normal values of the results. Linear regression analysis and Pearson’s or Spearman’s correlation coefficient (r) were
used to determine significant relationships between the biochemical variables. Statisti-cal significance was established at P<0.05.
Re sults
For a total of 115 pregnant women in-cluded in the study, 37 samples (32.2%) were obtained during the first period (13-20 weeks), 18 (15.5%) during the second (27-34 weeks) and 60 (52.2%) during the third (36-42 weeks). During the first period the mean age of the pregnant women was 34 years, significantly higher (P<0.05) than the second (27 years) and the third (26 years). All biochemical markers studied showed a significant difference at least between two of three gestational periods when we applied ANOVA or the Kruskal-Wallis test. The Duncan test was used to determine differ-ences.
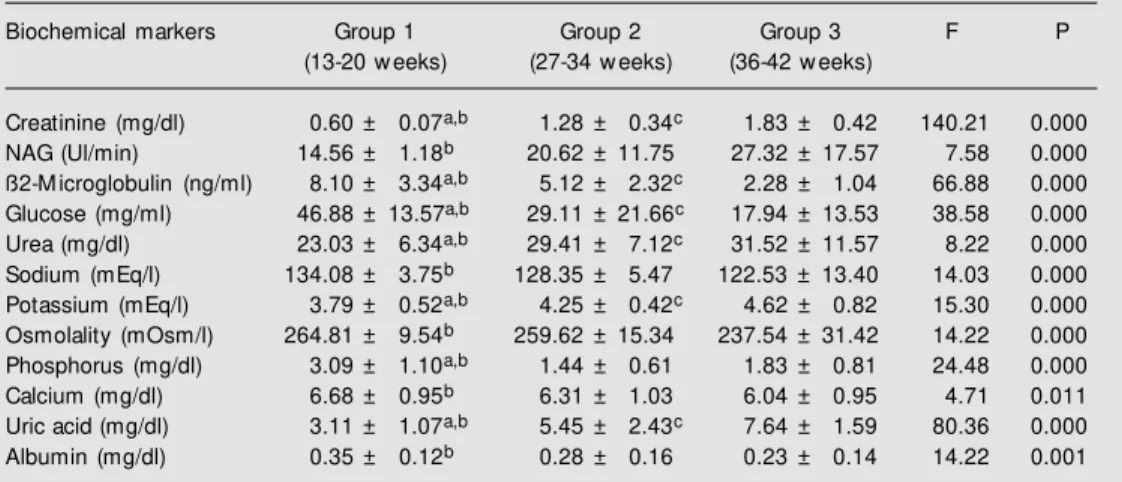
Table 1 shows the values of the bio-chemical markers throughout gestation. Crea-tinine was significantly increased through-out gestation (P<0.01). This increase was also demonstrated by urea, potassium and uric acid (P<0.01). NAG showed a
signifi-Table 1. Values of biochemical markers in amniotic fluid throughout gestation.
Biochemical markers Group 1 Group 2 Group 3 F P
(13-20 w eeks) (27-34 w eeks) (36-42 w eeks)
Creatinine (mg/dl) 0.60 ± 0.07a,b 1.28 ± 0.34c 1.83 ± 0.42 140.21 0.000
NAG (Ul/min) 14.56 ± 1.18b 20.62 ± 11.75 27.32 ± 17.57 7.58 0.000
ß2-M icroglobulin (ng/ml) 8.10 ± 3.34a,b 5.12 ± 2.32c 2.28 ± 1.04 66.88 0.000
Glucose (mg/ml) 46.88 ± 13.57a,b 29.11 ± 21.66c 17.94 ± 13.53 38.58 0.000
Urea (mg/dl) 23.03 ± 6.34a,b 29.41 ± 7.12c 31.52 ± 11.57 8.22 0.000
Sodium (mEq/l) 134.08 ± 3.75b 128.35 ± 5.47 122.53 ± 13.40 14.03 0.000
Potassium (mEq/l) 3.79 ± 0.52a,b 4.25 ± 0.42c 4.62 ± 0.82 15.30 0.000
Osmolality (mOsm/l) 264.81 ± 9.54b 259.62 ± 15.34 237.54 ± 31.42 14.22 0.000
Phosphorus (mg/dl) 3.09 ± 1.10a,b 1.44 ± 0.61 1.83 ± 0.81 24.48 0.000
Calcium (mg/dl) 6.68 ± 0.95b 6.31 ± 1.03 6.04 ± 0.95 4.71 0.011
Uric acid (mg/dl) 3.11 ± 1.07a,b 5.45 ± 2.43c 7.64 ± 1.59 80.36 0.000
Albumin (mg/dl) 0.35 ± 0.12b 0.28 ± 0.16 0.23 ± 0.14 14.22 0.001
Results are reported as mean ± SD. Data w ere analyzed by ANOVA and the Kruskal-Wallis test. M ultiple comparisons w ere made using the Duncan test (F). NAG = N-acetyl-ß-D-glucosaminidase.
cantly increase only between the first and third period. On the other hand, ß2-micro-globulin and glucose demonstrated signifi-cant decreases throughout pregnancy (P<0.01). Sodium, calcium, albumin and os-molality showed a significant (P<0.01) de-crease only between the first and third pe-riod. Phosphorus showed a significantly
de-creasing growth profile between the first and third period and a nonsignificant increase between the second and third period.
Table 2 shows Pearson’s correlation co-efficient between creatinine and gestational age and biochemical markers. We observed significant correlations (r>0.6) between ges-tational age and creatinine (r>0.85, P<0.01), ß2-microglobulin (r>-0.73, P<0.01), glucose (r>-0.65, P<0.01), and uric acid (r>0.78, P<0.01).
We also observed significant correlations between creatinine and ß2-microglobulin (r>-0.68, P<0.01), uric acid (r>0.80, P<0.01), glucose (r>-0.60, P<0.01), potassium (r>0.62, P<0.01) and urea (r>0.54, P<0.01). Signifi-cant correlations were also observed between sodium and osmolality (r>0.63, P<0.01) and between uric acid and ß2-microglobulin (r>-0.61, P<0.01).
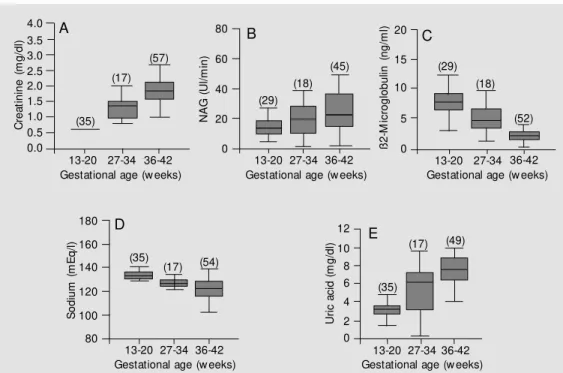
Figure 1A to 1E shows the profile of creatinine, NAG, ß2-microglobulin, sodium and uric acid determined at the three time points throughout gestation.
The present study did not identify any influence of maternal age, race, parity, or
Table 2. Pearson’s correlation coefficient betw een creatinine and gestational age and biochemical markers in amniotic fluid.
Gestational age Creatinine
Creatinine r = 0.85
-NAG r = 0.39 r = 0.26
ß2-M icroglobulin r = -0.73 r = -0.68
Glucose r = -0.65 r = -0.60
Urea r = 0.36 r = 0.54
Sodium r = -0.46 r = -0.26
Potassium r = 0.49 r = 0.62
Phosphorus r = -0.51 r = -0.39
Calcium r = -0.27 r = -0.14
Uric acid r = 0.78 r = 0.80
Albumin r = -0.37 r = -0.29
Osmolality r = -0.45 r = -0.31
NAG = N-acetyl-ß-D-glucosaminidase. P = 0.00 for all cases.
Figure 1. The amniotic fluid pro-file of creatinine, N-acetyl-ß-D-glucosaminidase (NAG), ß2-mi-croglobulin, sodium and uric acid at three time points during ges-tation. A, Creatinine x gesta-tional age. B, NAG x gestational age. C, ß2-M icroglobulin x ges-tational age. D, Sodium x gesta-tional age. E, Uric acid x gesta-tional age. The total number of sam ples m easured f or each marker are given on the x axis and the values found for each biochemical marker at the three gestational time points are given on the y axis. The number of samples studied is given in pa-rentheses. C re a ti n in e ( m g /d l) 4.0 3.5 3.0 2.5 2.0 1.5 1.0 0.5 0.0
13-20 27-34 36-42 Gestational age (w eeks)
(35) (17) (57) N A G ( U l/ m in ) 80 60 40 20 0 A B C ß 2 -M ic ro g lo b u lin ( n g /m l) 20 15 10 5 0 13-20 27-34 36-42
Gestational age (w eeks) (29)
(18)
(45) (29)
(18)
(52)
13-20 27-34 36-42 Gestational age (w eeks)
S o d iu m ( m E q /l ) 180 160 140 120 100 80 (35) (17) (54) D E 12 10 8 6 4 2 0 U ri c a c id ( m g /d l)
13-20 27-34 36-42 Gestational age (w eeks)
13-20 27-34 36-42 Gestational age (w eeks)
(35)
fetal sex on the results and maternal blood also did not show any influence on amniotic fluid parameters.
D iscussio n
The fetal kidneys start to develop during the 4th and 5thweeks of gestation and begin to excrete urine into the amniotic fluid at the 8th to 11th week (15,16). At the 20th week the fetal kidneys produce most of the amni-otic fluid (17,18). Therefore, important changes are expected in the composition of amniotic fluid as gestation progresses and fetal maturation occurs. As new diagnostic methods and new treatments advance the possibility to solve fetal anomalies, or as an improvement of quality of life becomes pos-sible, the necessity arises for a multidiscipli-nary team to decide for the continuation or interruption of pregnancy.
Renal maturity is defined by the increase in glomerular filtration and by the maturity of renal tubular cells that begin to express various tubular transporters over the months of gestation (9,19-21). Glomerular filtration in the fetal kidney can be assessed by the concentrations of creatinine and urea in the amniotic fluid (12). The evaluation of renal maturity can also indicate fetal maturity (17,18). In non-pregnant women, creatinine, urea, NAG, ß2-microglobulin and other bio-chemical markers are used to evaluate the complex functioning of human kidneys. In the first half of pregnancy, creatinine con-centrations are similar in maternal serum and in amniotic fluid (17).
Pregnant women in the first gestational group had a mean creatinine concentration of 0.6 mg/dl in the amniotic fluid, similar to that found in maternal serum.
Creatinine concentrations in amniotic fluid increased gradually between 20 to 32 weeks of gestation and more rapidly thereaf-ter, when they were two to four times higher than in maternal serum (9,22,23). Creatinine concentrations of 2 mg/dl represent an age of
at least 37 weeks of gestation (24). We ob-served an increase in creatinine and urea in the third trimester. It seems evident that the origin of these two markers is a function of filtration in the fetal kidneys. Creatinine dem-onstrated a significantly increasing growth profile throughout pregnancy as determined at all three gestational times. Creatinine val-ues from 36 weeks of gestation (1.72-1.95 mg/dl) fully agreed with data reported in other articles, which confirmed renal matu-ration (11). The increasing growth profile of creatinine and urea throughout normal preg-nancy is due to glomerular filtration and maturation of tubular function.
The function of the renal tubule system, specifically proximal tubules, can also be assessed by the concentrations of ß2-micro-globulin and NAG in the third trimester of gestation (1,25). ß2-Microglobulin is a light chain polypeptide of the HLA class I antigen complex. It was first isolated in 1968 from the urine of patients with Wilson’s disease and cadmium poisoning. Its function is un-known, but this protein may control the ex-pression and biosynthesis of antigens on the cell surface. Because of its low molecular weight, 99% of all free ß2-microglobulin is rapidly eliminated by glomerular filtration (26,27).
In primary diseases of renal tubules, where tubular damage and tubular acidosis occur, the urinary excretion of ß2-microglobulin can increase due to a reduced reabsorption of this molecule (22,28). Fetuses produce ß2-microglobulin, with serum levels being detectable from the 11th week of gestation. ß2-Microglobulin produced by the fetus is filtered and reabsorbed by proximal tubules, with an expected reduction in its concentra-tions at week 36 in normal pregnancies. This reduction can be considered as an index of renal tubular maturation (22,28).
of maternal blood, a dilution mechanism or reduced production in the third trimester but there is no proven theory (30). ß2-Micro-globulin showed a good correlation with levels of creatinine, uric acid and gestational age, suggesting its importance as a renal marker.
NAG is a high molecular weight lysoso-mal enzyme present in renal tubular cells (1,31). The excretion rate is not affected by serum concentrations since NAG is not fil-tered by the glomeruli. Increased NAG val-ues are found in various renal diseases and therefore can reflect renal damage (27).
In our study, NAG showed a significant-ly increasing growth profile between the first and third gestational groups. The higher values in later stages of pregnancy could reflect fetal growth and the greater mass of fetal kidneys (27).
Our results showed a decreasing glucose growth profile throughout gestation. This decreasing profile and a good correlation with creatinine and gestational age suggest that glucose is a good indicator of renal maturation. Sodium reabsorption by the fe-tal kidneys at the end of pregnancy is about 85 to 95% of the filtered load. Therefore, the fetal urine is usually hypotonic compared to plasma, indicating very efficient reabsorp-tion capacity in the collecting duct (32,33). Our results are compatible with a larger re-absorption of sodium and lower concentra-tions in the amniotic fluid in the third trimes-ter of pregnancy, as already demonstrated by other authors (15,34).
It was also possible to demonstrate lower concentrations of osmolality in the amniotic fluid in the third trimester of gestation and a good correlation between sodium and osmo-lality which would be expected due to their close physiologic relationship.
Almost complete development of the fe-tal kidneys with adequate functioning of all receptors that carry out transport in the renal cells would be expected to occur in the third trimester. For example, the Na-K-ATPase
protein present in all tubular segments has a main role in sodium reabsorption. There is an increasing growth of this protein during renal development, which is also accompa-nied by a larger capacity of renal tubules to transport sodium and water (32,33).
Potassium demonstrated a slightly in-creasing growth profile throughout gesta-tion, confirming observations reported by Benzie et al. (24). These results are in accor-dance with the maturation of distal and col-lecting tubules that are responsible for potas-sium handling by the fetal kidneys (20,35).
Uric acid presented higher concentra-tions at the end of gestation, similar to results reported by Bauk et al. (10). Calcium, phos-phorus and albumin, all substances processed by different segments of the renal tubules, showed significant differences between the first and third gestational groups, in contrast to data reported by others (34). Osmolality was similar to the levels reported in the classic work of Mandelbaum and Evans in 1969 (36).
As gestation progresses, the fetal kidneys follow the same developmental principles as adult kidneys. In man, the basic histoarchi-tecture of the kidney has formed by 32 to 36 weeks of gestation, and no new nephric units form after this period (37).
Since creatinine represents the most ac-curate renal marker, we considered as good indicators of maturation and renal function all markers that presented Pearson’s or Spearman’s correlation coefficient greater than 0.6 with gestational age and creatinine simultaneously. The profile of biochemical markers throughout gestation regardless of correlation coefficients demonstrates the physiology of amniotic fluid as the fetal kidneys mature.
which suggest that they may be possible indicators of renal development during ges-tation. NAG showed a weak correlation with both, which suggests that this enzyme is not a good indicator of renal maturation. Similar results were obtained for sodium, calcium, albumin and osmolality.
The heterogeneity of our patients is a limitation of our study but for ethical reasons it was felt to be proper to obtain samples of amniotic fluid only when there was a medi-cal indication for this procedure. Despite the reduced number of pregnant women in the second group (27 to 34 weeks), the statistical power of the data was good enough to ana-lyze all our variables. This reduced number was due to all exclusion criteria used to select the patients.
Patients selected in the first period were significantly older (34 years) compared to the other two periods. This was expected because most of these patients had advanced
maternal age as one of the indications for amniocentesis.
The precise mechanisms underlying struc-tural, molecular and cellular aspects during nephrogenesis only recently have begun to be studied. The process of undifferentiated cells forming proximal tubules, loops of Henle, distal tubules, and collecting urinary system with the creation of a system for transportation of water and solutes is a vast field of investigation (15). There are a great deal of renal syndromes such as aplasia, hypoplasia, dysplasia, neoplasm and cysto-genesis that result from abnormal nephro-genesis (38). Therefore, the study of fetal kidney development during embryogenesis as well as knowledge of the functioning of various cellular transporters during gesta-tion can provide important informagesta-tion about the physiology and pathophysiology of many syndromes that occur during gestation.
Re fe re nce s
1. M ussap M , Fanos V & Piccoli A (1996). Low molecular mass proteins and urinary enzymes in amniotic fluid of healthy preg-nant w omen at progressive stages of ges-tation. Clinical Biochemistry, 29: 51-56. 2. Seeds AE (1980). Current concepts on
amniotic fluid dynamics. American Jour-nal of Obstetrics and Gynecology, 1: 11-16.
3. Lettgen B, M eyer-Schw ickerath M & Be-dow W (1993). Die antenatale Ultraschall-diagnostik der Nieren und der ableitenden Harnw ege. M onatsschrift für Kinderheil-kunde, 141: 462-467.
4. Grupe WE (1987). The dilemma of intra-uterine diagnosis of congenital renal dis-ease. Pediatric Clinics of North America, 34: 629-638.
5. Shackelford GP, Kees-Folts D & Cole BR (1992). Imaging the urinary tract. Clinics in Perinatology, 19: 85-119.
6. Bailão LA, Cunha SP & M artinez AR (1975). O valor da creatinina no líquido amniótico como índice de maturidade fe-tal. Jornal Brasileiro de Ginecologia, 79: 247-249.
7. Liu-Y & Gong-GL (1982). Clinical
observa-tion of amniotic fluid creatinine as an in-dex of fetal maturity. Chinese M edical Journal (English), 95: 697-702.
8. Pitkin RM & Zw irek SJ (1967). Amniotic fluid creatinine. American Journal of Ob-stetrics and Gynecology, 98: 1135-1139. 9. Tyden O, Eriksson U & Agren H (1983).
Estimation of fetal maturity by amniotic fluid cytology, creatinine, lecithin/sphin-gomyelin ratio and phosphatidylglycerol.
Gynecologic and Obstetric Investigation, 16: 317-326.
10. Bauk FA, M oron AF & Novo Y (1996). Estudo comparativo das dosagens de sódio, potássio, uréia, creatinina e ácido úrico no líquido amniótico entre 15-20 semanas e 38-42 semanas. Revista da Associação M édica Brasileira, 42: 7-10. 11. Deshpande TV, Harding PG & Jaco NT
(1977). Estimation of gestational age from study of amniotic fluid and clinical assess-ment. Canadian M edical Association Jour-nal, 117: 886-890.
12. Ring E, Hofmann H & Erw a W (1991). Amniotic fluid N -acetyl-ß-D-glucosamini-dase activity and renal abnormalities. Ar-chives of Disease in Childhood, 66:
1147-1149.
13. Shardijin G & Statius van Epps L (1987). ß2-M icroglobulin: its significance in the evaluation of renal function. Kidney Inter-national, 32: 635-641.
14. Harrison M R & Filly RA (1990). The fetus w ith obstructive uropathy: Pathophysiol-ogy, natural history, selection, and treat-ment. In: Harrison M R, Golbus M S & Filly RA (Editors), The Unborn Patient: Prena-tal Diagnosis and Treatment. 2nd edn. W.B. Saunders, Philadelphia, PA, USA, 328-393.
15. Brenner BM (1990). Determinant of dif-ferentiation during early nephrogenesis.
Journal of the American Society of Ne-phrology, 1: 127-130.
16. Nigam SK, Aperia AC & Brenner BM (1996). Development and maturation of the kidney. In: Brenner BM (Editor), The Kidney. 5th edn. W.B. Saunders, Philadel-phia, PA, USA.
17. Hennemann CE, Andersson GV & Tejavey A (1970). Fetal maturation and amniotic fluid. American Journal of Obstetrics and Gynecology, 108: 302-307.
fe-tal renal function. Journal of Developmen-tal Physiology, 6: 1-10.
19. Delpire E, Rauchman M I & Beier DR (1994). M olecular cloning and chromo-some localization of a putative basolateral Na-K-2Cl co-transporter from mouse in-ner medullary collecting duct (mIM CD-3) cells. Journal of Biological Chemistry, 269: 25677-25683.
20. Gamba G, M iyanoshita A & Lombardi M (1994). M olecular cloning, primary struc-ture, and characterization of tw o mem-bers of the mammalian electroneutral so-dium-(potassium)-chloride co-transporter family expressed in kidney. Journal of Bio-logical Chemistry, 269: 17713-17722. 21. Imbert-Teboul M , Chabardes D & Clique
A (1984). Ontogenesis of hormone-de-pendent adenylate cyclase in isolated rat nephron segments. American Journal of Physiology, 247: 316-325.
22. Cruikshank DP (1982). Amniocentesis for determination of fetal maturity. Clinical Obstetrics and Gynecology, 25: 773-785. 23. Raghav M , Vijay G & Chow dhary DR (1985). Amniotic fluid amino acids, urea, creatinine in normal and toxemic preg-nancies. Indian Journal of M edical Sci-ences, 39: 291-293.
24. Benzie RJ, Doran TA & Harkins JL (1973). Composition of the amniotic fluid and maternal serum in pregnancy. American
Journal of Obstetrics and Gynecology, 119: 798-810.
25. Puolaka J, Ylostalo P & Tuimala R (1982). Amniotic fluid beta2-microglobulin in nor-mal and complicated pregnancies. Gyne-cologic and Obstetric Investigation, 13: 129-134.
26. Backman L, Ringden O & Bjorkhem I (1986). Increased serum ß2-M during re-jection cyclosporin-induced nephrotoxic-ity and cytomegalovirus infection in renal transplant recipients. Transplantation, 42: 368-371.
27. Cobet G, Gum m elt T & Bollm ann C (1996). Assessment of serum levels of alfa microglobulin, ß2 microglobulin, and retinol binding protein in the fetal blood. A method for prenatal evaluation of renal function. Prenatal Diagnosis, 16: 299-305. 28. Strassner HT & Nochimson DJ (1982). De-termination of fetal maturity. Clinics in Perinatology, 9: 297-312.
29. Zimmerhackl LB, Rostasy K & Wiegele G (1996). Tamm Horsfall protein as a marker of tubular maturation. Pediatric Nephrol-ogy, 10: 448-452.
30. Padovani EM , Fanos V & M ussao M (1994). Tubular proteins and enzyme con-tent in the amniotic fluid. European Jour-nal of Obstetrics Gynecology and Repro-ductive Biology, 55: 129-133.
31. M arhun D (1976). Rapid colorimetric
as-say of ß-galactosidase and N-acetyl-ß-glu-cosaminidase in human urine. Clinica Chi-mica Acta, 73: 453-461.
32. Robillard JE, M atson JR & Sessions C (1979). Developmental aspects of renal tubular reabsorption of w ater in the lamb fetus. Pediatric Research, 13: 1172-1176. 33. Robillard JE, Nakamura KT & M atherne GP (1988). Renal hem odynam ics and functional adjustments to postnatal life.
Seminars in Perinatology, 12: 143-150. 34. Daffos F & Forestier F (1988). M édicine et
Biologie du Foetus Humain. M aloine, Paris, France.
35. Satlin LM (1991). M aturation of renal po-tassium transport. Pediatric Nephrology, 5: 260-269.
36. M andelbaum B & Evans TN (1969). Life in the amniotic fluid. American Journal of Obstetrics and Gynecology, 104: 365-377. 37. Ekblom P (1994). Embryology and prena-tal development. In: Holliday M A, Barratt TM & Avner ED (Editors), Pediatric Ne-phrology. 3rd edn. Williams and Wilkins, Baltimore, M D, USA.