Social Support Scale (MOS-SSS): Analysis of the Psychometric Properties via Item
Response Theory
Article
Daniela Sacramento Zanini1
Pontifícia Universidade Católica de Goiás, Goiânia-GO, Brazil
Evandro Morais Peixoto
Pontifícia Universidade Católica de Campinas, Campinas-SP, Brazil
Abstract: The study on social relationships that influence health, as well as the development of reliable measures to assess this construct has been highlighted in the academic literature. The aim of this study was to estimate new evidence of validity based on the internal structure and reliability of the MOS-SSS, as well as the parameters of items and participants by Item response theory. The sample consisted of 998 people (age: M = 27.18, SD = 9.90, 65.1% women) from different sampling strata. Confirmatory factor analysis (CFA) revealed better goodness of fit of the four-factor model when compared to factor structures shown in other Brazilian studies. The multigroup CFA demonstrated invariance of the factor model when comparing the different sampling strata. The partial credit model indicated items with mean difficulty and appropriate adjustments indices (infit/outfit) and desirable reliability for the factors. The analysis of the maps indicated the tool’s strengths and limitations to assess the construct.
Keywords: psychological assessment, item response theory, social interaction, health
Escala de Apoio Social (MOS-SSS): Análise das Propriedades Psicométricas
via Teoria de Resposta ao Item
Resumo: O estudo da influência das relações sociais sobre a saúde, assim como o desenvolvimento de medidas confiáveis para avaliação deste construto, tem tido destaque na literatura acadêmica. O objetivo deste estudo foi estimar novas evidências de validade com base na estrutura interna e precisão MOS-SSS, assim como estimar os parâmetros dos itens e dos participantes da pesquisa através da TRI. Participaram 998 pessoas (idade: M = 27,18, DP = 9,90, 65,1% mulheres) de diferentes estratos amostrais. Análise
Fatorial Confirmatória (AFC) revelou melhor qualidade de ajustamento do modelo com quatro fatores quando comparado às estruturas fatoriais indicadas em outros estudos brasileiros. A AFC Multigrupo demostrou a invariância do modelo fatorial quando comparados os diferentes estratos amostrais. O Modelo de Créditos Parciais revelou itens com dificuldade media e índices de ajustes adequados (Infit/Outfit), e índices de precisão desejáveis para os respectivos fatores. As análises dos mapas indicaram as forças e limitações do instrumento ao avaliar o construto.
Palavras-chave: avaliação psicológica, teoria de resposta ao item, interação social, saúde
Escala de Apoyo Social (MOS-SSS): Análisis de las Propiedades Psicométricas
vía Teoría de Respuesta al Ítem
Resumen: El estudio de la influencia de las relaciones sociales en la salud así como el desarrollo de medidas fiables para evaluar este constructo se ha destacado en la literatura académica. El objetivo de este estudio fue estimar nuevas evidencias de validez de la estructura interna y precisión de la MOS-SSS, estimar los parámetros de los ítems (dificultad) y de los participantes (theta) por medio de la TRI. Participaron 998 personas (edad: M = 27,18 DE = 9,90, 65,1% mujeres) de diferentes estratos de muestreo. El Análisis Factorial Confirmatorio reveló una mejor calidad de ajuste del modelo con cuatro factores cuando se compara las estructuras factoriales indicada en otros estudios brasileños. La AFC Multigrupo demostró la invariancia del modelo factorial cuando comparados los diferentes estratos de muestreo. El Modelo de Créditos Parciales reveló ítems con dificultad media, índices de ajuste adecuados (Infit/Outfit) y índices de precisión deseables para los respectivos factores. EL análisis de los mapas indicó las fuerzas y limitaciones del instrumento para evaluar el constructo.
Palabras clave: evaluación psicológica, teoría de respuesta al ítem, interacción social, salud
1 Correspondence address:
Daniela Sacramento Zanini. Rua 9, n. 769 Setor Oeste. CEP 74110-100. Goiania-GO, Brazil. E-mail: [email protected]
The use of scales to measure human phenomena has been widely used in psychology. However, for a measure to be considered reliable and its data to be compared with those obtained in other studies, at least three aspects are necessary to ensure the quality of the measuring instrument used: the appropriateness of the instrument being administered, the
quality of the data correction and interpretation (Urbina, 2014). In this regard, studies assessing the psychometric qualities of psychological instruments are not only welcome in psychology, but are also necessary.
inferences resulting from the instrument results. Thus, the validation of the test itself is not the objective, but the possible proposed interpretations based upon its scores. Validation is the development of a scientifically solid argument to support the proposed interpretation of the test results, as well as the relevance of their use. Thus, the study of the different types of evidence of instrument validity is extremely important and is considered by some authors as one of the most relevant aspects to be assessed in the development of a psychological test process (Urbina, 2014). This guarantees the quality of its items, both at the level of description of the phenomenon studied as well as in the level of understanding, allowing the comparison of the results obtained in different studies, as well as the elimination of intervening variables, that is, those influenced by other phenomena not related to the construct measured. In this sense, this study aimed to estimate the new evidence of validity based on the MOS-SSS internal structure and reliability, as well as to estimate the parameters of items and research participants by Item response theory (IRT) for Brazilian population.
MOS Social Support Survey Scale (MOS-SSS)
Since 1970, the interest in the influence of social relationships on peoples’ health has been featured in the academic literature. Cobb (1976) presented a set of research demonstrating how the perception of a social support network produced beneficial effects on the individuals’ health. These findings were corroborated by subsequent studies that indicated that social support contributes to social adaptation and protects against the effects and negative consequences of stress (Sherbourne & Stewart, 1991), reducing morbidity and mortality (Southwick, Vythilingam, & Charney, 2005). These effects could occur either directly (direct effect), in which the perception of integration and social belonging leads the individual to better levels of health and care, as well as indirectly (effect buffer), in which the improvement in the levels of health would be due the perception of having people who can count on stress situations (Zanini, Verolla-Moura, & Queiroz, 2009).
However, some theoretical-methodological distinctions must be made when social support is analyzed. The first one is concerned with the structural dimension (the social network, its size and amount of social interactions) versus functional dimension (quality of social relationship experienced on this network; Southwick et al., 2005). Another relates to the received social support (the support actually received by the individual) versus the perceived social support (the one the individual believes to be available, if necessary; Zanini et al., 2009). Studies show that the quality (functional dimension) of the relationships is a better predictor of health than the quantity (structural dimension; Sherbourne & Stewart, 1991; Southwick et al., 2005). Moreover, the perception of social support not always reflects the actual available support and sometimes the actual social support might not be perceived.
Among the tools developed for the assessment of the perception of social support, the Medical Outcomes Study Social Support Survey, MOS-SSS (Sherbourne & Stewart,
1991), is one of the most widely used internationally (Santos, Amorim, Saints, & Barreto, 2015). The instrument was developed to assess the perception of social support and was administered to 2987 chronic patients, showing good evidence of validity and reliability. It is a self-report instrument with 19 items, to which individuals are invited to respond, using a five-point Likert scale, how often they can count on people to support them in different situations. The items were grouped into four subscales or factors related to: material and emotional social support, positive social interaction, emotional/informational, and through the use of a global scale. The authors report Cronbach alphas greater than .91 for all factors (Sherbourne & Stewart, 1991).
Social support material reflects the perception of social support to help in coping with concrete problem situations, and it is related to the perception of having people to count on if facing special situations that require concrete actions of support and care. The affective social support evaluates the perception of having people who make the person feel socially significant, reflecting the perception of a significant social network availability, with which emotional exchanges can be established and for whom it is important. The positive social interaction assesses the existence of people with whom the individual can establish pleasant relationships, feel included and socially supported, reflecting the perception of social support by the perception of social belonging and pleasure with one’s social life. Social emotional/informational support evaluates the perception of people on whom the individuals can count to share their problems and obtain information that helps them to understand or face that. In other words, it reflects the individual's perception of the availability of support from his/her social network, dedicated to sharing emotional aspects or meaningful information that help him/ her to face problems. Finally, the global scale assesses to what extent the individuals realize that they are supported to confront different situations in their lives (Sherbourne & Stewart, 1991).
The good psychometric quality of the MOS-SSS related to health measures led to this instrument being translated and adapted to different cultures and contexts (Gómez-Cameron et al., 2014; Parents-Raja & Bridge, 2009). In most studies of adaptation and validation, the instrument retained the same characteristics reported by the authors, i.e. a factorial structure of four factors and reliability indexes, with Cronbach's alpha coefficients greater than 0.80. Examples of these studies are those developed with the Portuguese population sample of chronic patients (Alonso Fachado, Martinez Montes, Menendez Villalva, & Pereira, 2007); the elderly (Pais-Ribeiro & Bridge, 2009); university students in a central region of Brazil (Zanini et al., 2009); Italian university students (Giangrasso & Casale, 2014); as well as a Mandarin version for a Chinese population of chronic patients (Wang, Zheng He, & Thompson, 2013).
third factor. This is the case with the study involving workers in southeastern Brazil (Griep, Chor, Faerstein, Werneck, & Lee, 2005). Thus, although different studies indicate good levels of accuracy and reliability of the instrument, there is diversity in its factorial structure, especially in studies with Brazilian populations with different sample groups. Another important characteristic of these studies is the fact that they are based on the Classical Test Theory (CTT). In consideration of the limitations of these procedures (Embretson & Rise, 2000), the IRT is suggested as an alternative mathematical model to the development and evaluation of psychological rating scales.
According to Embretson and Rise (2000), IRT offers a mathematical model that represents the central elements of psychological testing. In this situation, the higher the intensity of the investigated latent trait by item, the greater the likelihood that the person will agree with the item; on the other hand, the less intense the characteristics described by items for the person, the lower the probability that she will agree. This relationship between the individuals’ characteristics, also known as skills or theta, and the likelihood of greater endorsement of the item, is expressed by the main element of the IRT, the item characteristic curve (ICC). Other characteristics of items influence this, depending on the model, including: difficulty (parameter b), discrimination (parameter a), and the probability of randomly answering (parameter c).
This research will apply the Rasch model (1960) which, after it was developed, resulted in the partial credit model (Rasch-Masters Partial Credit Model) of Wright and Masters (1982). This model corresponds to an amplification of the Rasch model into a sequence of ordered alternatives answers (e.g. Likert-type scales), and stands out due to its parsimony and measurement properties. In this case, the ICC is characterized by different bell-shaped lines that express the relationship between different levels of theta and the probability of endorsement of the different categories of response from a Likert type scale.
The person-item map is among the features offered by this model, once this procedure provides important information about psychological scales, such as the gaps identified in the measurement of the construct (Oak, Primi, & Pessotto, 2014). For both, the parameters of the items, b
(expressed by the mean difficulties of the different categories of response) and the participants’ theta are allocated on a common scale. This procedure allows the verification of the extent of theta levels of the subjects assessed by the items of the instruments (more information about the fundamentals of IRT and proposed procedures can be found at Embretson, 2006; Embretson & Rise, 2000). Based on the above, the present study aims to estimate new evidence of validity based on the internal structure and reliability MOS-SSS, as well as to estimate the parameters of the items and of the participants of the survey by IRT.
Method
Participants
The sample for this survey was composed of 998 participants of both sexes (65.1% women), aged 12 to 73 years (M = 27.18, SD = 9.90), 61.7% college students, 14.7% patients
in treatment for infertility, 10.1% patients in treatment for eating disorder and obesity, 8.7% patients undergoing bariatric surgery, and 4.8% patients in treatment for burns. In terms of level of education, 4.9% had elementary education, 61.32% incomplete higher education, 16.5% high school, and 15.03% complete higher education. In relation to marital status, 64.4% were single, 31.6% married, 3.2% separated or divorced, and 0.9% widowed. The students were from four universities, two private schools located in the interior of Sao Paulo, one private school located in the city of São Paulo, and a public school in Goiás. The sampling group composed by patients was from outpatient clinics located in Goiás. Table 1 describes the ages and sex distribution of the various groups that comprise the sample.
Table 1
Description of the Sample by Age and Sex According to the Group of University Students or Patients (Infertile, Eating Disorder, Bariatric Surgery, or Burns)
Sample groups Age Sex N
Min Max M (SD) Male Female
University students 17 62 24.13 (7.89) 237 (38.5%) 379 (61.5%) 616
Infertile 20 51 33.52 (6.53) 32 (21.8%) 116 (78.2%) 148
Eating disorder 17 51 25.08 (7.67) 27 (270%) 73 (73,0%) 100
Bariatric surgery 19 63 38.95 (11.17) 20 (23%) 67 (77%) 87
Burns 12 73 29.13 (14.16) 33 (68.8%) 15 (31%) 48
Total 170 547 998
Instrument
The Social Support Survey Scale (MOS-SSS) was analyzed, developed for the Medical Outcomes Study (MOS-SSS) by Sherbourne and Stewart (1991), and adapted to the Brazilian population by Griep in the Pró Saúde no Rio de
Janeiro (Pro Health study) in Rio de Janeiro (Griep et al., 2005). The instrument is composed of 19 questions that must be answered by the participant checking one of five possible answers, on a five-point Likert scale, ranging from 1 (never) to
necessary, how often you have someone…?”. In the original study of Sherbourne and Stewart (1991) the scale consisted of five factors identified as social support of material and emotional type, social interaction, emotional and positive information. However, in the Brazilian study, developed by Zanini et al. (2009), the factors related to social support of emotional and information type were grouped together, and the scale was composed of four factors, with an internal consistency index evaluated by the Cronbach’s alpha ranging between .76 and .95. Griep et al. (2005) showed the existence of only three factors, in which the items relating to positive social interaction and emotional support were grouped, as well as the emotional and informational support factors. In relation to the content of these, the internal consistency ranged from .92 to .83.
Procedure
Data collection. The data were collected on an individual basis in the specific sampling groups in their own health units, and collectively in the college students in their own classroom. In all sample groups, the mean time for the questionnaire response was 15 minutes.
Data analysis. In order to compare the adequacy of the factorial models proposed for the MOS-SSS in Brazilian research, confirmatory factor analysis (CFA) was applied, with the maximum likelihood estimation method, using the AMOS statistical package, version 19. The choice for using these procedures was based on the observation that all items of the scale assumed normal standard values of asymmetry (skewness) that ranged from 0.45 to -1.54, and flattening values (kurtosis) that ranged from -0.92 to 1.69 (George & Mallery, 2010). In addition, multicollinearity was not found among the items. As recommended by Schweizer (2010), the following indexes of adjustments to assessment of measurement models were used: Chi-square (χ2), degrees
of freedom (df), ratio relative to the degrees of freedom (χ2/
df), comparative fit index (CFI), root-mean-square error of
approximation (RMSEA), and standardized root mean square (SMRS). The reference values adopted were those commonly used in the literature: χ2/df equal to 5 as acceptable, equal
or less than 3 as desirable; CFI equal to or higher than .90 as appropriate, equal to or greater than .95 as desirable; RMSEA equal to or less than .08 as acceptable, and less than .05 as desirable; and SMRS less than .08 as desirable. For comparisons between different factorial models, the chi-square test was used, as described by Marôco (2010).
Once the internal structure of the MOS-SSS was established, the multigroup confirmatory factor analysis (MGCFA) was used for evaluation of measurement invariance (configural) and factorial model metric between groups formed by men and women, as well as between those formed by different sample groups (University students, patients: infertile patients, those with an eating disorder, undergoing bariatric surgery, and those with burns). As described by Damásio (2013) for the evaluation of configural invariance and metric the analysis of the aforementioned indexes by the chi-square test and ∆CFI was performed, comparing the
more restricted factorial models with those without or with less restriction.
The parameters of the items and subjects were estimated by IRT, for both the Winsteps 7.3 software (Linacre, 2015), and the calibration method of maximum likelihood. In order to identify the metric of the scales, the anchoring process centered on the items was used, anchoring the mean difficulty of items at zero. In this way, different statistical procedures were conducted, and instrument quality indicators were evaluated. Parameters of the items were difficulty (b) and adjustments index (infit and outfit); parameters of the subjects were intensity level in the construct assessed by the factor (level of latent trait/theta), adjustments rates of student answers (infit and outfit), and the relationship between parameters of items and subjects: correlation between item and theta, and person-item map analysis.
Infit means the adjustment level of response patterns in categories with difficulty values of items next to the theta values of the subject. Outfit is the adjustment level of responses patterns when the difference between the skill level of the subject and the difficulty of items is great. According to Linacre (2015), these values can vary from zero to infinity, and values close to one indicate good adjustment. Following criteria conventionally adopted in the literature, values ranging between 0.7 and 1.3 were considered suitable (Bond & Fox, 2001; Smith, Rush, Fallowfield, Velikova, & Sharpe, 2008). Finally, new precision estimates of theta indicators were presented by the Rasch measure. Analyses were performed separately for each of the factors that composed the MOS-SSS, according to the one-dimensionality of assumptions required for these procedures.
In sum, four statistical procedures were adopted: (1) confirmatory factor analysis (CFA) in order to compare the adequacy ratios of the proposed factor models for this instrument in Brazilian research; (2) multigroup confirmatory factor analysis (MGCFA) for invariance analysis of the factor model between different sampling groups; (3) item response theory (IRT) for estimation of items (difficulty b and adjustment indexes infit/outfit), parameters of the participants (level of intensity in the latent trait - theta) and subjects to item ratio parameters (person-item map analysis); (4) calculation of Rasch reliability coefficients for assessment of estimates of the theta of the factors of the scale.
Ethical Considerations
Results and Discussion
According to the AFC, the evaluation model consisting of three factors, as proposed by Griep et al. (2005), revealed a poor quality of adjustment χ2 = 1190.200, df = 148, p <
.01, χ2/df = 8.042, CFI = .889; RMSEA = .084; 90% CI
[.080, .088]; SMRS = .07. Moreover, the model comprising four factors proposed by Zanini et al. (2009) showed a good quality of adjustment: χ2 = 698.311, df = 146, p < .01, χ2/
df = 4.7, CFI = .94; RMSEA = .06; 90% CI [.057, .067]; SMRS = .04. In addition, the chi-square test supports better adaptation of the second evaluation model of the MOS-SSS: ∆ χ2 = 491.889; ∆df = 2; p < .01. In summary, the model with
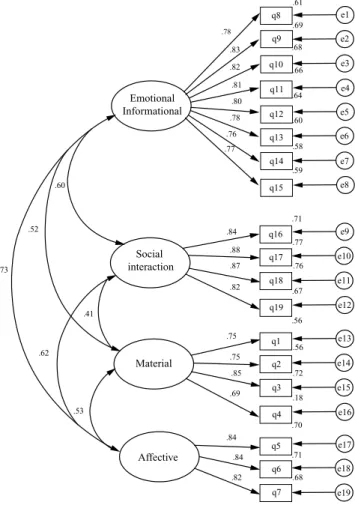
four factors is shown in Figure 1, where the factor loadings for each item displayed in the respective factors is observed. Each one presents values greater than .61, and the proportion of variance explained by each variable and correlations indexes between factors (Phi value standardized) ranges between .41 and .73. More specifically, there are higher rates of correlation between the affective social support and emotional / informational factors (.73) and lower levels between the social and material support and positive social interaction factors (.41). In practical terms, these data show that having someone to count on to say that loves you or likes you (affective social support) is very much related to having someone to advise or share problems (social emotional/ informational support). However, having fun with someone (positive social interaction) is less related to the dimension of social material support. In fact, the social material support, in addition to being the one with lower correlation coefficients, also presents lower indexes on the other analyses. Thus, when comparing between the scale factors, this is the factor that, although adjusted, is less related to the others. This data demonstrates their specificity and shows the need for future correlational studies that can empirically demonstrate the different effects of each factor on the health of individuals.
These results provide satisfactory answers to the first objective of this research, which aimed to obtain new evidence of validity based on the internal structure of the MOS-SSS in the Brazilian version (AERA, APA & NCME, 2014). The factors are structured according to the theoretical proposal
q8 .78
.77
Emotional Informational
Social interaction
Material
Affective
q9
q10
q11
q12
q13
q14
q15
q16
q17
q18
q19
q1
q2
q3
q4
q5
q6
q7
e1
e2
e3
e4
e5
e6
e7
e8
e13
e14
e15
e16 e9
e11
e12 e10
e18 e17
e19
.76 .78
.80 .81 .82 .83
.60
.52
.73
.41
.62
.53
.82 .84 .84 .75 .75
.85 .69 .82 .87 .88 .84
.61 .69 .68
.59 .58 .60 .64 .66
.71
.77
.68 .72 .56 .67 .76
.71 .70 .18 .56
Figure 1. Confirmatory factor analysis of the four-factor model of
the MOS-SSS.
Table 2
Evidence for Factorial Invariance of the MOS-SSS
χ2 Gl χ2/df CFI RMSEA 90% CI SRMR ∆CFI
Sex
Without restriction 1225.766 292 4.20 .936 .060 [.056, .063] .051
Saturation 1238.559 307 4.03 .934 .058 [.055, .061] .050 .002
Covariance 1246.923 317 3.93 .934 .057 [.054, .060] .052 .000
Residual 1328.554 336 3.95 .928 .057 [.054, .061] .053 .006
Sample groups
Without restriction 2296.420 730 3.15 .907 .047 [.044, .049] .087
Saturation 2412.731 790 3.05 .903 .046 [.044, .048] .083 .004
Covariance 2514.864 830 3.03 .899 .045 [.043, .047] .091 .004
Residual 2964.864 906 3.27 .887 .048 [.046, .050] .105 .012
that grounded the instrument development (Sherbourne & Stewart, 1991) and corroborated the results found in different populations internationally (Alonso Fachado et al., 2007, Giangrasso & Casale, 2014; Pais-Ribeiro & Bridge, 2009; Wang et al, 2013; Zanini et al, 2009).
Similar results were found for the invariance model when various sampling groups were considered, which indicate that the factor structure of this instrument is equivalent for all groups, that is, the same items evaluate the same constructs. Regarding the metric invariance, the results indicate equivalence of factor loadings, given that the restricted model did not show significantly different adjustment of the not restricted model for men and women (∆χ2 = 12.793; ∆df =
15; p = .25), as well as for sampling strata (∆χ2 = 116.311;
∆df = 60; p = .99). In addition, assessing the equivalence
of covariance between factors and the residue of items (measurement error associated with items) the observed results, ∆CFI less than or equal to .01, demonstrate that the metric structure of the MOS-SSS is invariant in relation to sex of participants and to the sample groups considered in this research (Damasio, 2013; Vandenberg & Lance, 2000).
The invariance test of the parameters of a factor model has been shown to be increasingly essential in psychology, given that psychological constructs are evaluated in terms of responses to observed variables. Thus, having empirical
evidence that these variables are related to the latent constructs in the same way for different groups, and that the factor weights and covariance between factors did not differ between the groups, is a prerequisite to the comparison of groups using the gross results of a psychological tool (Damasio, 2013; Milfont & Fischer, 2010). In this sense, the results provide subsidies to these comparisons in future research, as well as the development of common interpretative rules for the evaluated groups. Thus, possible differences in gross scores obtained by the MOS-SSS can be the results of different levels of intensity in the evaluated constructs, by individuals, and not a bias of the instrument.
The results derived from the MCP are shown in Table 3, where the descriptive statistics of the different characteristics of the items and the research participants are summarized: difficulty of the items, theta level of the participants, infit/ outfit, internal consistency index (Rasch measurement reliability) of the respective factors, and amplitude of correlation coefficients between item and theta.
Table 3
Descriptive Statistics of the Items and the Subjects
Dimensions Statistics
Items Subjects Factors
b Infit Outfit Θ Infit Outfit Reliability
r iΘ
Emotional Informational
M - 0.99 0.99 1.26 1.00 1.00
.92
SD 0.25 0.08 0.08 1.66 0.81 0.81
Max 0.30 1.10 1.11 4.55 7.05 7.05
.76-.81
Min -0.49 0.90 0.90 -3.94 0.03 0.03
Social interaction
M 00 0.99 0.98 1.89 0.98 0.99
.89
SD 0.43 0.07 0.07 2.18 1.23 1.25
Max 0.57 1.06 1.06 5.52 9.90 9.90
.87-.90
Min -0.54 0.90 0.88 -5.22 0.03 0.03
Material
M - 1.00 0.97 0.84 0.97 0.97
.83
SD 0.29 0.19 0.15 1.31 0.81 0.82
Max 0.35 1.27 1.17 2.95 5.18 6.01
.74-.84
Min -0.44 0.74 0.76 -3.11 0.06 0.05
Affective
M - 0.99 0.98 2.12 0.98 0.97
.84
SD 0.34 0.05 0.06 2.08 1.06 1.07
Max 0.35 1.05 1.05 4.43 8.04 8.05
.88-.90
Min -0.47 0.95 0.93 -4.61 -
-Note.b = difficulty of the items, Θ = theta-latent trait level of participants, r = iΘ Person correlation of the item with theta presented by
participants.
Considering that the anchoring procedure established the mean value of difficulty of the items at zero, it appears that the difficulty of the items in the four factors is distributed around the mean value, thereby indicating that no items were either too easy or too difficult to be endorsed. Regarding the index adjustments, an adaptation of the items is identified, composing the four instrument factors, notably the values are distributed between 0.74 and 1.27 for infit indexes, and between 0.76 and 1.17 for outfit indexes, indicating that all
items of the scales adjust to the pattern of response expected by the model.
Factor 1 PERSON - MAP - ITEM
<more>|<rare>
5 .########### +
|
|
.### T|
|
|
4 +
.#### |
|
|
.#### |
. |
3 . S+
.#### |
|
.##### |
.#### |
. |
2 .## +
.##### |
|
.### |
.#### M|
.#### |
1 .#### +
. |
.#### |
.### |T
.### |S I10
. | I11 I14 I15
0 .### +M I13
.## | I12 I9
.## S|S
.## |T I8
. |
.## |
-1 ## +
|
.# |
.## |
|
.# |
-2 . T+
|
. |
|
. |
|
-3 . +
|
|
. |
|
|
-4 # +
<less>|<frequ>
EACH “#” IS 10. EACH “.” IS 1 TO 9
Factor 2
PERSON - MAP - ITEM <more>|<rare> 6 .############ + | .# | | | 5 + | | ### | | 4 S+ | .## | | | 3 + | .##### | | | 2 .# + . M| . | | .## | 1 + . |T .# | I18 |S | I17 0 . +M .### S| I16 |S | I19 .# |T -1 + . | . | | | -2 . + | T| . | . | -3 + | . | | | -4 + . | | | . | -5 + . | | | | -6 . +
<less>|<frequ>
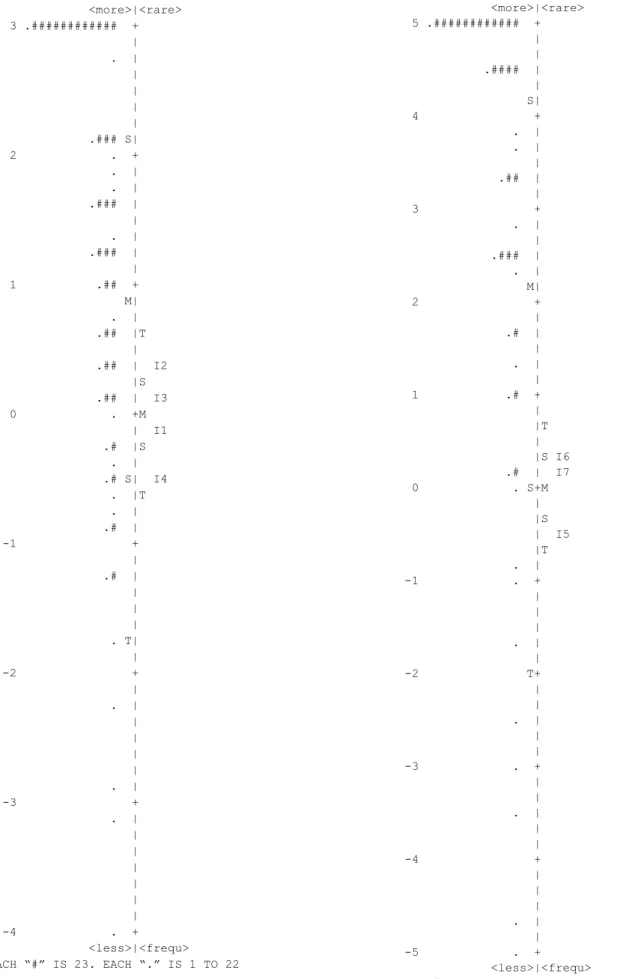
Figure 2. Maps of items of the factors.
...continuation
Factor 3 PERSON - MAP - ITEM <more>|<rare> 3 .############ + |
. | | | | |
.### S| 2 . + . | . | .### |
| . | .### | | 1 .## +
M| . | .## |T | .## | I2
|S .## | I3 0 . +M | I1 .# |S
. | .# S| I4 . |T . | .# |
-1 + | .# | | |
| . T| | -2 + |
. | | | | |
. | -3 + . | | |
| | | | -4 . +
<less>|<frequ> EACH “#” IS 23. EACH “.” IS 1 TO 22
Factor 4 PERSON - MAP - ITEM <more>|<rare> 5 .############ + | | .#### | | S| 4 + . | . | | .## | | 3 + . | | .### | . | M| 2 + | .# | | . | | 1 .# + | |T | |S I6 .# | I7 0 . S+M | |S | I5 |T . | -1 . + | | | . | | -2 T+ | | . | | | -3 . + | | . | | | -4 + | | | . | | -5 . +
mean values (1, 0.98, 0.97 and 0.98) indicated adequacy of response pattern verified and expected by the model when the subjects had theta levels close to the level of difficulty presented by the item. However, the values expressed by the minimum and maximum statistics specify values below 0.7 and above 1.3, indicating the existence of people who did not adhere to the pattern of response expected by the model.
The same behavior is demonstrated for the outfit adjustment index with mean values (1, 0.99, 0.97, and 0.97) indicating adequacy of response pattern observed and expected by the model when subjects had levels of theta distant from the difficulty level presented by the item. However, values presented by maximum and minimum statistics indicate that even participants with high levels of perceived social support failed to endorse items with low level of difficulty, as well as participants with low levels of perceived social support that have chosen to endorse the more difficult items.
Finally, Table 2 shows the accuracy rates and the variation of the theta inter-item correlation of the participants. For the map analysis, Figure 2 shows that for the first factor, the level of difficulty of items represented by the letter M (mean), S (one standard deviation), and T (two standard deviations located on the right side of the map, compared to the level of latent trait of the subjects, represented by the same letters (M, S and T) on the left side of the map, indicate that the items that comprise the factor more accurately evaluate the subjects with latent trait level allocated between -0.5 and 0.5. However, gaps in measurement of the construct can be found, such as: the extension of the latent trait level located between 0.5 and 5, as well as between -0.5 and -2 was not evaluated by the items in the scale. With regard to the second factor (social interaction), gaps can be observed in the evaluation of subjects with a theta level higher than 0.8, as well as those with levels of theta less than -0.8.
Regarding the third factor, the adequacy of items is identified for assessing patients with latent trait levels between -0.5 and 0.8. Moreover, there is a shortage of items that can accurately assess subjects presenting theta values outside this range. The fourth factor shows the same record of the items that assess a small extension of the construct located around a standard deviation below the mean of the participants’ parameter (between -0.5 and 0.3). The factors that comprise the MOS-SSS are composed of few items, and the these items function better for evaluating the central extension of the latent construct in concordance with the psychological assessment instruments developed for the assessment of the general population (Machado, Hauck Son, Tan, & Banner, 2014).
As closing statements, this study had as its main objective to estimate new evidence of validity based on the internal structure and precision of the MOS-SSS, as well as to estimate the parameters of items and the survey participants by IRT. The use of the IRT and MGCFA enabled the identification of scale features not observed in previous studies. The person-item map indicated strengths and limitations of the instrument to assess the desired construct. Notably, it is necessary to find new items that make the instrument capable of evaluating a larger extent of the latent trait level, given that the assessment of people with
theta levels outside these ranges imply greater measurement error. Studies are necessary that identify the development of interpretative rules of the overall results of this instrument. We concluded that this research contributed to the accumulation of evidence of validity and accuracy of the Brazilian version of the MOS-SSS, thus having achieved its objectives satisfactorily. However, limitations of the research relate to the convenience sample and low national representation, which requires caution in generalizing the results.
References
Alonso Fachado, A., Montes Martinez, A., Menendez Villalva, C., & Pereira, M. G. (2007). Adaptação cultural e validação da versão portuguesa Questionário Medical Outcomes Study Social Support Survey (MOS-SSS) [Cultural adaptation and validation of the Medical Outcomes Study Social Support Survey Questionnaire (MOS-SSS)]. Acta Médica Portuguesa, 20(6), 525-533. Retrieved from http://repositorium.sdum.uminho.pt/ bitstream/1822/9640/1/adapta%C3%A7%C3%A3o%20 MOS.pdf
American Educational Research Association, American Psychology Association, & National Council on Measurement in Education. (2014). Standards for educational and psychological testing (3rd ed.). Washington, DC: AERA.
Bond, T. G., & Fox, C. M. (2001). Applying the Rasch model.
Mahwah, NJ: Lawrence Erlbaum.
Carvalho, L. F., Primi, R., & Pessotto, F. (2014). Aplicação da TRI na versão brasileira do Defensive Style Questionnaire (DSQ) [Application of IRT in the Brazilian version of the Defensive Style Questionnaire (DSQ)]. Psicologia Argumento, 32(79 Supl. 1), 85-96. doi:10.7213/psicol.
argum.32.S01.AO08
Cobb, S. (1976). Social support as a moderator of life stress. Psychosomatic Medicine, 38(5), 300-314.
doi:10.1097/00006842-197609000-00003
Damásio, B. F. (2013). Contribuições da análise fatorial confirmatória multigrupo (AFCMG) na avaliação de invariância de instrumentos psicométricos [Contributions of the multigroup confirmatory factor analysis in the invariance evaluation of psychometric tests]. Psico-USF, 18(2), 211-220. doi:10.1590/S1413-82712013000200005
Embretson, S. E. (2006). The continued search for nonarbitrary metrics in psychology. American Psychologist, 61(1),
50-55. doi:10.1037/0003-066X.61.1.50
Embretson, S. E., & Reise, S. P. (2000). Item response theory for psychologists. Mahwah, NJ: Lawrence Erlbaum.
George, D., & Mallery, M. (2010). SPSS for Windows step by step: A simple guide and reference, 17.0 update (10th ed.). Boston, MA: Pearson.
doi:10.1007/s11205-013-0277-z
Gómez-Campelo, P., Pérez-Moreno, E. M., Burgos-Lunar, C., Bragado-Álvarez, C., Jiménez-García, R., & Salinero-Fort, M. A. (2014). Psychometric properties of the eight-item modified Medical Outcomes Study Social Support Survey based on Spanish outpatients. Quality of Life Research, 23(7), 2073-2078.
doi:10.1007/s11136-014-0651-6
Griep, R. H., Chor, D., Faerstein, E., Werneck, G. L., & Lopes, C. S. (2005). Validade de constructo de escala de apoio social do Medical Outcomes Study adaptada para o português do Estudo Pró-Saúde [Construct validity of the Medical Outcomes Study’s social support scale adapted to Portuguese in the Pró-Saúde Study]. Cadernos de Saúde Pública, 21(3), 703-714.
doi:10.1590/S0102-311X2005000300004
Linacre, J. M. (2015). A user’s guide to Winsteps Ministep: Rasch-model computer programs. Retrieved from http://
www.winsteps.com/winman/copyright.htm
Machado, W. L., Hauck Filho, N., Teixeira, M. A. P., & Bandeira, D. R. (2014). Análise de Teoria de Resposta ao Item de Marcadores Reduzidos da Personalidade [Item Response Theory Analysis of the Mini-Markers of Personality]. Psico,45(4), 551-558. Retrieved from http:// revistaseletronicas.pucrs.br/ojs/index.php/revistapsico/ article/view/13138
Marôco, J. (2010). Análise de equações estruturais: Fundamentos teóricos, software & aplicações [Structural equation modeling: Theoretical foundations, software & applications]. Pêro Pinheiro, Portugal: ReportNumber.
Milfont, T. L., & Fischer, R. (2010). Testing measurement invariance across groups: Applications in cross-cultural research. International Journal of Psychological Research, 3(1), 111-121. Retrieved from http://dialnet.
unirioja.es/descarga/articulo/3296462.pdf
Pais-Ribeiro, J. L., & Ponte, A. C. S. L. C. (2009). Propriedades métricas da versão portuguesa da escala de suporte social do MOS (MOS Social Support Survey) com idosos [Metric properties of the portuguese version of the MOS Social Support Survey with a sample of aged people]. Psicologia, Saúde & Doenças, 10(2), 163-174. Retrieved from http://
www.redalyc.org/articulo.oa?id=36218589002
Rasch, G. (1960). Probablistic models for some intelligence and attainment tests. Chicago, IL: University of Chicago Press.
Santos, L. M., Amorim, L. D. A. F., Santos, D. N., & Barreto, M. L. (2015). Measuring the level of social support using latent class analysis. Social Science Research, 50, 139-146. doi:10.1016/j.ssresearch.2014.11.009
Schweizer, K. (2010). Some guidelines concerning the modeling of traits and abilities in test construction. European Journal of Psychological Assessment, 26(1), 1-2.
doi:10.1027/1015-5759/a000001
Sherbourne, C. D., & Stewart, A. L. (1991). The MOS social support survey. Social Science & Medicine, 32(6), 705-714.
doi:10.1016/0277-9536(91)90150-B
Smith, A. B., Rush, R., Fallowfield, L. J., Velikova, G., & Sharpe, M. (2008). Rasch fit statistics and sample size considerations
for polytomous data. BMC Medical Research Methodology, 8, 33. doi:10.1186/1471-2288-8-33
Southwick, S. M., Vythilingam, M., & Charney, D. S. (2005). The psychobiology of depression and resilience to stress: Implications for prevention and treatment. Annual Review of Clinical Psychology, 1, 255-291. doi:10.1146/annurev.
clinpsy.1.102803.143948
Urbina, S. (2014). Essentials of psychological testing.
Hoboken, NJ: Wiley.
Vandenberg, R. J., & Lance, C. E. (2000). A review and synthesis of the measurement invariance literature: Suggestions, practices, and recommendations for organizational research. Organizational Research Methods, 3(1), 4-69. doi:10.1177/109442810031002
Wang, W., Zheng, X., He, H.-G., & Thompson, D. R. (2013). Psychometric testing of the Chinese Mandarin version of the Medical Outcomes Study Social Support Survey in patients with coronary heart disease in mainland China.
Quality of Life Research, 22(8), 1965-1971. doi:10.1007/ s11136-012-0345-x
Wright, B. D., & Masters, G. N. (1982). Rating scale analysis.
Chicago, IL: MESA.
Zanini, D. S., Verolla-Moura, A., & Queiroz, I. P. A. R. (2009). Apoio social: Aspectos da validade de constructo em estudantes universitários [Social support: Validity aspects of the construct in undergraduation student].
Psicologia em Estudo, 14(1), 195-202. doi:10.1590/
S1413-73722009000100023
Daniela Sacramento Zanini is an Adjunct Professor of the
Pontifícia Universidade Católica de Goiás.
Evandro Morais Peixoto is a Ph.D. candidate of the Graduate
Program in Psychology of the Pontifícia Universidade Católica de Campinas.
Received: June 9, 2015 1st Revision: Nov. 16, 2015 Approved: Dec. 15, 2015
How to cite this article: