OF WHICH CENTER AND PERIPHERY ARE WE TALKING?
de qual centro e periferia estamos falando?
Ralfo Edmundo Matos *
Rodrigo Nunes Ferreira **
(*) Lecturer, Doctor of the Federal University of Minas Gerais (Universidade Federal de Minas Gerais) - Av. Antônio Carlos 6627, CEP: 31270901, Belo Horizonte (MG), Brasil. Tel: (+55 31) 34995426 - [email protected]
(**) Msc. Universidade Federal de Minas Gerais - Av. Antônio Carlos 6627, CEP: 31270901, Belo Horizonte (MG), Brasil. Tel: (+55 31) 34995426 - rodrigonunesferreira@gmail
Resumo
Esse estudo tem como objetivo a análise comparada de mudanças nos níveis de ocupação e renda nos mer-cados de trabalho de regiões metropolitanas (RMs) do Nordeste e Sudeste. Para tanto foram discriminadas as populações de trabalhadores migrantes e não-migrantes residentes nos núcleos e periferias das RMs de Fortaleza e de Recife vis-à-vis os residentes das RMs de São Paulo e do Rio de Janeiro entre 2000 e 2010, segundo classes de renda e estratiicação da condição de pobreza e extrema pobreza. Os resultados indicam que houve melhora generalizada das condições de remuneração dos trabalhadores migrante e não-migrante, não obstante a aceleração do processo de urbanização das últimas décadas há evidências de maior inserção ocupacional dos dois grupos populacionais, com a supremacia dos migrantes sobre os não-migrantes em termos de renda mediana auferida no trabalho segundo dados censitários. A perspectiva de que a expansão da ocupação e renda traga benefícios ao padrão habitacional de periferias metropolitanas não deve ser negligenciada em análises subsequentes, que explorem outras características dos domicílios, sobretudo se houver continuidade de ganhos de remuneração sustentados por conjunturas econômicas de crescimento no decorrer da atual década.
Palavras-chaves:Migrações internas; Periferias metropolitanas; Pobreza urbana.
Abstract
This study is a comparative analysis of changes in levels of employment and income in the metropolitan areas of labor markets (RMs) of Northeast and Southeast. The populations of workers were discriminated between migrants and non-migrants, residents in the cores and peripheries of metropolitan areas of Fortaleza and Recife compared with residents of metropolitan regions of São Paulo and Rio de Janeiro between 2000 and 2010, according to the level of income and the condition of poverty or extreme poverty. The results indicate improvement of the remuneration of migrant and non-migrant workers, despite the acceleration of the urbanization of the last decades, there is evidence of higher occupational integration of the two po-pulation groups, with the supremacy of migrants on the non-migrants in terms of median income of work according to census data. The perspective that occupation and income expansion might bring beneits to the metropolitan outskirts residence standards should not be neglected in further analysis, which may explore other dwelling features, particularly if an income gain steadiness sustained by growing economic scenarios should be observed along the current decade.
Key words: Internal migrations; Metropolitan outskirts; Urban poverty.
Resumen
Este estudio tiene como objetivo el análisis comparativo de los cambios en los niveles de ocupación y de ingresos en las áreas metropolitanas de los mercados de trabajo (RMS) de Nordeste y Sureste. Para ambos fueron discriminados poblaciones de los trabajadores migrantes y no migrantes residentes en los núcleos y periferias de las áreas metropolitanas de Fortaleza y Recife en comparación con los residentes de las regiones metropolitanas de São Paulo y Río de Janeiro entre 2000 y 2010, de acuerdo con las clases de ingresos y la estratiicación de acuerdo la condición de pobreza o extrema pobreza. Los resultados indican una mejora general de las condiciones de remuneración de los trabajadores migrantes y no migrantes. A pesar de la aceleración del proceso de urbanización en décadas hay evidencia de una mayor integración profesional de los dos grupos de la población, con la supremacía de los migrantes sobre los no migrantes en términos de ingresos medios obtenidos en el trabajo de acuerdo a los datos del censo. La perspectiva que la expansión del empleo y los ingresos pueden beneiciarse las viviendas em las periferias metropolitanas no debe ser descuidado en los análisis posteriores que exploran otras características de los hogares, sobre todo si hay continuidad de los beneicios de compensación sostenida por coyunturas de crecimiento económico durante el década actual.
44
INTRODUCTION
Life in big cities has been the center of debates around the world for a long time. The last United Nations report on global urban population growth points to a inevitable urbanization of
mankind, even in continents sufering from severe poverty or where the population body is not yet expressive (UNITED NATIONS, 2012). The resulting problems from the urbanization hastening we observe in the world today, or that Europe has experienced during the industrial revolution are
known and have been described by renowned authors in literature. However, questions regarding urbanization increments still arouse, challenging the work of contemporary analysts.
Martine (2007), for instance, when discussing the environmental issue, observes that in spite a great portion of urban populations being composed by poor people who live in underprivileged
conditions at metropolitan outskirts, most of the existing environmental problems are due to a
production and consuming model that requires an enormous amount of energy to feed the industry and the transports, and grant reasonable levels of comfort to the population at their homes (heating, lighting and appliances), which in turn generates great quantities of garbage and air pollution.
That put, the author holds a clearly pro-urban view, favoring urban concentration, what could represent a more sustainable land use. He notes that urbanization is inescapable, but it can also
be “beneicial from the environmental perspective, given the current demographic and economic
reality”. Degraded environments in urban areas are more related to the unsustainable development patterns, along with poverty increasing due to the absence of economic opportunities and the lack
of urban management, control and planning. One of the land-use planning main goals should count
on attending the poor population needs. Imposing barriers to the rural-urban migration, as many
governments insist on promoting, remains a worthless efort. “Such attitudes have forced the poor
to dwell in marginal, ecologically fragile or dangerous areas, such as river borders and steep hills. This has been contributing to the foulness and misery of the new urban population, as well as to the cities’ ecological damaging” (MARTINE, 2007, p. 187). It is not possible to disagree with this statement, especially considering the elitist tradition urban planning has encompassed for over a century.
Martine (2007) has performed a global urbanization analysis from an environmental
view-point, attempting to reassure the tendencies pointed by the UN in its report (UNITED NATIONS, 2006). Most of his conclusions are unmistakable, although there are relevant speciicities when the
analysis scope is changed. In countries were the urbanization has reached irreversible high levels, urban planning may actually improve the ambience and life conditions of dense and geographically
extended metropolises residents, for example, by implanting diverse vertical nuclear hubs that
magnify the traditional urban centers. In countries with a lower level of this urban macrocephaly (such as Brazil) where it is possible to identify hundreds of urban poles landing a huge portion of
the urban population, environmental and economic circumstances and advantages are of a diferent
kind, and urban planning may bring to light other discussions over inhabitants’ standards and qua-lity of life. Medium-sized equipped cities may favor the economic estimates regarding a series of costs related to population mobility (including their journey from home to work, leisure, or public
services and facilities). If excessive absorption of rural areas for urban expansion seems an irratio -nality from an urban planning standpoint, besides making the presence of miserable and outlying outskirts unavoidable, then one should question if such statements end up injecting a certain degree of ‘fatalism’, supposedly attested by the mass consumption modern society.
It is undeniable that big cities represent unique human concentrations throughout human history.
They bring to life physical and territorial expansions never seen before, from rural areas integra
-tions, ‘ininite’ urban outskirts, illegitimate and precarious alloca-tions, various types of invasions,
besides enclosed, fenced towns, high and middle-income segments fortresses. They spread like a virus, as Henry Lefebvre (1999) would state.
45 had doubled its size in seven years and reached one billion inhabitants in 2003, almost 1/7 of the
whole population in the planet. This number was expected to double once more up to 2030 (UN --HABITAT, 2003).
Do the current urban outskirts difer a lot from those in the past? And if so, does this evidence associates with the high number of migrants who do not have a ‘precise landing’, which expelled from rural areas, transit around the urban territories? In many Africa and Asia regions that seems
to be the 21st century urban outskirts scenario. The population scales are impressive amidst catas-trophic poverty levels.
What about Brazil? Despite the country has virtually completed its urban demographic tran
-sition – a stage that African countries will only reach in decades to come, do urban expansion disadvantages continue to be dramatic? Motta (2004, p. 136) stated that there was unemployment,
underemployment and poverty around the metropolitan outskirts. Data collected by Sônia Rocha showed a 32.1% participation of metropolitan areas in the total of Brazilian poor population in 1999. Roughly, 17.5 million poor people lived in the 10 main metropolitan regions (RMs). São Paulo RM (RMSP) contributed with over one third of metropolitan poverty, and Rio de Janeiro RM (RMRJ) with 16.7%, while in the RMs of Recife and Fortaleza, smaller areas, there were other 17.7% of the
metropolitan poor population (ROCHA, 2003, p. 127, 196). Based on the 1991 and 2000 demogra -phic censuses, Maricato (2002) concluded that Brazilian shantytowns had augmented in 22%, and in São Paulo only, there was an increase in their number from 585 in 1991 to 612 in 2000.
Do the data from the 2000 and 2010 censuses validate this reality? Even considering the period when there was a life condition improvement for a signiicant part of the Brazilian population, say, the 30 million individuals who have shifted into the lower extracts of the traditional medium class, called ‘new medium class’ (SAE, 2012)?
To the economist Wilson Cano, Brazil is still going through a disturbing crisis. In his book, Essays on the Brazilian urban crisis , launched in 2011, the author bares problems due to the has-tened urbanization in the country, such as the gaps left in terms of habitational policies, real estate
speculation and foreign capital inlows in urban business since the 1990’s. Cano understands that
the urbanization process in Brazil has yielded positive consequences, but has also risen problems hard to deal with, certainly owing to its speeded form, as well as it has happened in other Latin American countries: among three and four decades, millions of people have moved to cities
inca-pable of providing adequate structures of planning, legislation and management. (CANO, 2011)
In a recent interview, Wilson Cano states that until the 1960’s we were living in a ‘bearable’ urbanization, because the bordering process had not yet assumed the present time dramatic
propor-tions. Dwellers did not use to live so far from their jobs and home construction was not so diicult, in spite of all the existing debts in education, health, water supply, sewage and transportation sectors
(UFMG, 2012).
Indeed, there was a time when a noteworthy part of the excluded rural population would be
incorporated to the urban economies and the geographical mobility conceded an ascending social
mobility. As it seems, in times of inancial globalization, such possibilities have befallen further and
the poor migrants and their kids’ future has become darker. It is as if poverty has reproduced faster inside the distant city fringes during the last two decades. Millions of migrants and non-migrants would be forming a generation of poor people whose children would be completely doomed to
poverty, deserted in the big city’s distant boundaries (MATOS, 2005).
In the past decades, the urban ambience has exploded and the peripherization has not ceased,
46
urban agglomerations, problems are no longer local or municipal […] Diiculties […] become federal […] e start depending upon political, institutional, budgetary and iscal matters” (UFMG,
2012). The urban land question is still critical. The author observes that, since the military habita-tional policy, by the time the Housing Nahabita-tional Bank (BNH) was created, real estate speculation
has gained projection. The BNH’s logic of exploiting inexpensive lands in urban outskirts was key
to the government at the time, and it is still perform by the Minha Casa, Minha Vida program. The
costs of carrying infrastructure into these new border areas are extraordinary; besides, speculation
related to more equipped urban lands shifts real estate prices into irrational levels.
This paper does not detail nor discuss several of the queries proposed by Cano, Martine and others. Most of the author’s assertions are unquestionable. The matter of interest here is to establish a few comparisons amongst dense metropolises holding large outskirts, where the vulnerability of
dwellers life conditions could be broadening or not. In fact, this study aims to examine the income
level of migrant and non-migrant workers inhabiting nucleuses and borders of four Brazilian metro-politan regions (RMs) between 2000 and 2010. This analysis strikes a deeper discussion about life
condition diferences in central and marginal areas from distinct metropolises, which goes beyond
the limits of the present study. After all, is poverty the same in metropolitan outskirts from RMs
regionally and historically separated by inequality?
As for the ascending mobility matter, resulting from labor income surplus, some efort will be
placed in order to assess the migrant and non-migrant labor force spatial redistribution (conside-ring as labor force the working population with 15 years of age or older). This admeasurement will
be conducted based exclusively on the two last national demographic censuses (2000 and 2010). Methodology consists in distinguishing and comparing: non-migrants; ixed-date immigrants; and
return immigrants older than 15 years who were occupied on the censuses dates, by calculating the domiciliary income and individual income median (changed into average income per worked
hour); and the stratiication of poverty and extreme poverty (according to the Federal Government
income transfer programs cut-line limits).
It is evident that old myths about the migrant groups negative presence will be considered,
des-pite Martine’s assertions (1980) about migrants positive inluence in receptive areas. The antiquated belief that outskirts expansion is usually caused by incessant lows of poor immigrants looking for
a job at the big urban centers will be reassessed, in light of recent census data. Have immigrants been contributing to poverty enhancement in big metropolises, both in central and marginal areas;
or are they singularly distinct from the other poor non-migrant residents?
2. Residents from four metropolitan areas and occupation and employment levels
To allow comparison, four Brazilian metropolitan regions were selected, considering their
distant location from one another as well as social and economic diferences: São Paulo and Rio de
Janeiro and Fortaleza and Recife. Data refer to all inhabitants aged 15 years or more, residing both in the city core (central municipality) and its outskirts (municipalities composing the metropolitan
periphery). The migratory status was discriminated according to the reported ixed-date migration. The non-migrants (people who have not migrated during the ive-year period right before the cen -sus date) are compared to the people who have moved from their residences during the periods of 1995/2000 (for the 2000 Census) and 2005/2010 (for the 2010 Census), sorting out those who have left and returned to the same city of residence during the respective periods. Disaggregating the called ‘return immigrants’ allows for a better view to this fraction of migrants, in face of the return migration phenomenon rise in the last decades; plus it ensues an attempt of identifying this migrant’s peculiarities.
elder-47 ly citizens and students (therefore unoccupied) should be superior among the non-migrant due to
the selection efects in migration (the dominant migrant proile is that of a young adult worker, in
search of a job opportunity). In addition, data may have a correlation with the country’s economic cycle stage or with the higher dynamism observed in determined region metropolises.
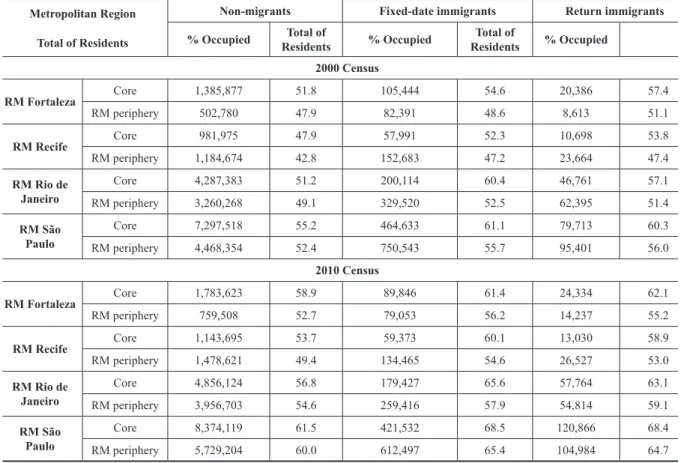
Table 1 allows us to conclude that the occupational level of the analyzed populations is relati-vely high, usually falling above the 50% mark. That becomes more evident with the 2010 Census data. Even amid non-migrants, notably less occupied than migrants, the occupational degree has risen in 2010: more in São Paulo RM than in Rio de Janeiro RM; more in Fortaleza RM than in
Recife RM. The ixed-date immigrants at the RMSP core surpass the 68% of occupation in that year, whilst in RJRM this proportion reaches 65.6%. In Fortaleza and Recife such igures are also quite expressive: 61.4% and 60.1%. The same way, among the return immigrants these numbers equally signiicant in 2010: 62.1% in Fortaleza; 58.9% in Recife; 68.4% in São Paulo and 59.1% in Rio. These percentages endorse notiied tendencies from 2012, when there was an unmarked situation
of full employment in many regions and sub-regions the country . Nevertheless, economic growth
witnessed in the Lula government period must have positively inluenced the occupation data from
Table 1, when both periods – 2000 and 2010 – are compared.
Table 1 – Total number of residents and percentage of occupied people among non-migrant, ixed-date immigrant
and return immigrant populations aged 15 years or older, resident in selected metropolises 2000/2010
Metropolitan Region
Total of Residents
Non-migrants Fixed-date immigrants Return immigrants
% Occupied Total of
Residents % Occupied
Total of
Residents % Occupied
2000 Census
RM Fortaleza
Core 1,385,877 51.8 105,444 54.6 20,386 57.4
RM periphery 502,780 47.9 82,391 48.6 8,613 51.1
RM Recife
Core 981,975 47.9 57,991 52.3 10,698 53.8
RM periphery 1,184,674 42.8 152,683 47.2 23,664 47.4
RM Rio de Janeiro
Core 4,287,383 51.2 200,114 60.4 46,761 57.1
RM periphery 3,260,268 49.1 329,520 52.5 62,395 51.4
RM São Paulo
Core 7,297,518 55.2 464,633 61.1 79,713 60.3
RM periphery 4,468,354 52.4 750,543 55.7 95,401 56.0
2010 Census
RM Fortaleza Core 1,783,623 58.9 89,846 61.4 24,334 62.1
RM periphery 759,508 52.7 79,053 56.2 14,237 55.2
RM Recife Core 1,143,695 53.7 59,373 60.1 13,030 58.9
RM periphery 1,478,621 49.4 134,465 54.6 26,527 53.0
RM Rio de Janeiro
Core 4,856,124 56.8 179,427 65.6 57,764 63.1
RM periphery 3,956,703 54.6 259,416 57.9 54,814 59.1
RM São Paulo
Core 8,374,119 61.5 421,532 68.5 120,866 68.4
RM periphery 5,729,204 60.0 612,497 65.4 104,984 64.7
Source: IBGE, Demographic Censuses 2000 and 2010 (sample microdata)
In order to address inhabitant’s life conditions from the four metropolises under study, it is
necessary to examine the income data, despite all the known problems associated with earning de -clarations around the world. Therefore, per capita domiciliary income data seem to suit our purposes best, and are analyzed here under the assumption that declaration errors found in both censuses’
extended sample are homogeneously distributed in space. Using big igures, such as expressive
population contingents, serves as a counterweight to this problem, but it does not solve the riddle of
48
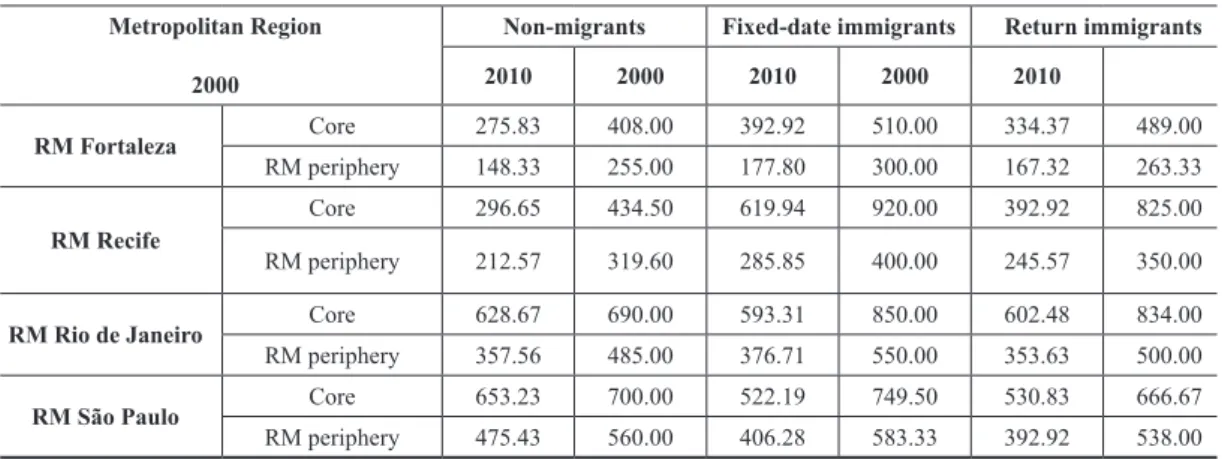
The main conclusions drawn from Table 2 can be summarized as follows:
1. Per capita income at RMSP and RMRJ cores, as expected, are quite superior to those ob -served in their outskirts and the northeastern metropolises. In 2000, the per capita income
among the non-migrants in São Paulo exceeded in 2.4 times the same igure in Fortaleza. In
2010 however, this discrepancy fell into 1.7 (still 70% greater) .
2. In almost all of the cases, the migrants’ per capita income is superior to the non-migrants.
In 2000, ixed-date immigrants’ earnings went over the non-migrants’ in Fortaleza and Recife,
ranging from 20% higher in the Fortaleza’s periphery to 109% in the municipality of Recife. The same was not observed for São Paulo and Rio: migrants’ per capita income in those regions is similar or even less than the non-migrants’ income (in RMRJ outskirts the immigrants’ per capita income is 5% superior).
3. The 2010 Census data support the higher income levels for migrants, expressly for the nor
-theastern metropolises; however the igures also indicate that ixed-date immigrants obtain a
greater income level when compared to non-migrants. In 2010, there is not a single case in
which the non-migrants’ per capita income exceeds the migrants’ income ; that has been the case since 2000. The ixed-date immigrants’ earnings in Recife’s core area was more than
double the non-migrants’.
4. As for the return immigrants, it is initially worthy to consider that this group must include
several less-qualiied workers who have gone back to their hometowns after trying it – and
not succeeding – elsewhere. In fact, in 2000 the return immigrants’ per capita income is lower
than most other migrants’ income, with the exception of the ones who returned to either Rio de
Janeiro or São Paulo. In 2010 results are even more emphatic: the whole returning population showed inferior income compared to all other migrants.
Table 2 – Median Per capita domiciliary income (in BR$) of non-migrant, ixed-date immigrant and return
immigrant populations aged 15 years or older, resident in se-lected metropolises 2000/2010 Source: IBGE, Demographic Censuses 2000 and 2010 (sample microdata)
Metropolitan Region
2000
Non-migrants Fixed-date immigrants Return immigrants
2010 2000 2010 2000 2010
RM Fortaleza Core 275.83 408.00 392.92 510.00 334.37 489.00
RM periphery 148.33 255.00 177.80 300.00 167.32 263.33
RM Recife
Core 296.65 434.50 619.94 920.00 392.92 825.00
RM periphery 212.57 319.60 285.85 400.00 245.57 350.00
RM Rio de Janeiro Core 628.67 690.00 593.31 850.00 602.48 834.00
RM periphery 357.56 485.00 376.71 550.00 353.63 500.00
RM São Paulo Core 653.23 700.00 522.19 749.50 530.83 666.67
RM periphery 475.43 560.00 406.28 583.33 392.92 538.00
Notes: 2000 earnings ixed by the accumulated INPC from 08/2000 to 07/2010 ( applied adjustment index:
1,9645958; source: BACEN);
49 attempt of settling in their destinations – as it has happened to the non-peripheral metropolitan areas’
residents, who have, all together, achieved median income levels comparable to the other migrants’. Does data from the last censuses grant us to go beyond when comparing the four metropolises
using variables such as income, poverty and peripherization? Before moving forward, we should reexamine the absolute numbers presented in Table 1. Figures indicate that the number of immi -grants inhabiting the four metropolitan outskirts has been undergoing few changes, whilst in the two northeastern RMs the records show an increase of return immigrants. Data endures that
peri-pheral expansion might be supported by the non-migrants , mainly in Fortaleza, since in the other RMs the 20% expansion observed over 10 years may be due to their old borderline municipalities’
population intrinsic growth.
We should then inspect if the proportion of poor and extreme poor in the population as a whole
has increased. The limits to measuring poverty are known, especially the methods focused on income, for the phenomenon multidimensional aspect is often understated in this kind of approach (SEN,
2001; ALKIRE, FOSTER, 2007). Another problem is the setting of a single poverty cut-line for all of the many diverse Brazilian regions, with diferent life costs, which can lead to underestimations of the inal statistics (ROCHA, 2003). Even so, income is still a respectable indicator in capitalist
societies, and it is usually capable of reasonably summarizing poverty and deprivation conditions in urban environments with historical collections of big metropolitan areas’ typical services and infrastructures, as in the four cases studied here. In order to simplify comparison, we have decided
to analyze results from the last two censuses. Data exposed in Table 3 brings to light part of the
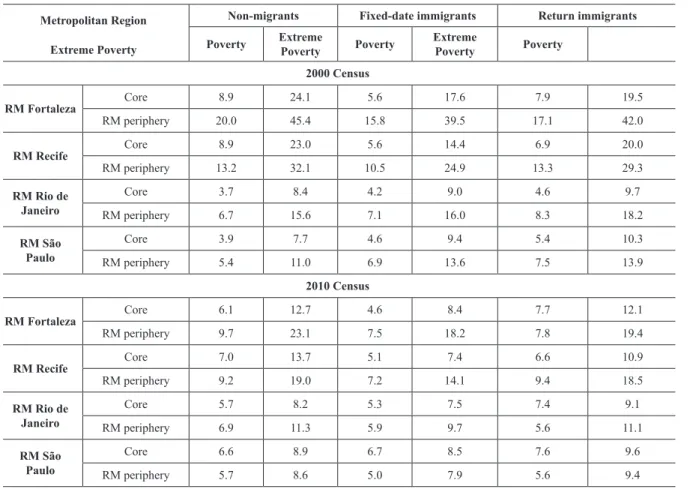
questions involving poverty development in the selected metropolitan regions. The most evident conclusions can be abridged in two:
1) The percentage of poor people is more expressive in 2000. In 2010 the number of poor and extreme poor has diminished in virtually all analyzed areas. An exceptional igure must be highlighted: there was an increase in extreme poverty for the Southeast RMs, among both
immigrants and non-migrants, notably at the São Paulo and Rio de Janeiro core areas. The poverty percentages, in turn, was barely altered at these same nucleuses.
2) The studied RMs show diferent results in terms of poverty incidence amongst migrants and
non-migrants. In the Northeast selected areas, either in the capitals or in the outskirts, the poor people proportion is bigger for the non-migrant and return immigrant groups, when compared
to the ixed-date immigrants. In the Southeast RMs this pattern was inverted in 2000, at what
time poverty incidence was greater within the migrant population. In 2010, the relationship took a slight swing, with an upper poverty frequency only among return immigrants, as the
ixed-date immigrants displayed the smallest percentages of poverty.
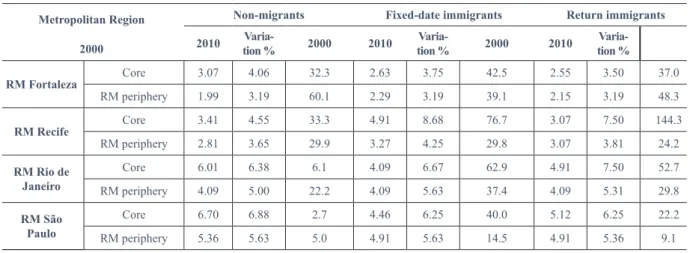
Data evaluation on obtained money from the labor market (Table 4) permits placing clues to clarify the greater reduction of poverty among migrants. To reduce possible impacts over income
marks from people of diferent ages throughout the lifespan, we chose to use the indicator ‘median
of average income per worked hour’ (as it has been done for the migrant/non-migrant comparisons).
That way we avoid the efect of shorter work shifts and their lower earnings, a common situation
for the young workers or even among women occupied in some tertiary sector activities.
The examined results, contrary to old-fashioned theories and current misperceptions between
50
Table 3 – Percentage of poverty and Extreme poverty among non-migrant, ixed-date immigrant and return
immigrant populations aged 15 years or older, resident in se-lected metropolises 2000/2010
Metropolitan Region
Extreme Poverty
Non-migrants Fixed-date immigrants Return immigrants
Poverty Extreme
Poverty Poverty
Extreme
Poverty Poverty
2000 Census
RM Fortaleza
Core 8.9 24.1 5.6 17.6 7.9 19.5
RM periphery 20.0 45.4 15.8 39.5 17.1 42.0
RM Recife
Core 8.9 23.0 5.6 14.4 6.9 20.0
RM periphery 13.2 32.1 10.5 24.9 13.3 29.3
RM Rio de Janeiro
Core 3.7 8.4 4.2 9.0 4.6 9.7
RM periphery 6.7 15.6 7.1 16.0 8.3 18.2
RM São Paulo
Core 3.9 7.7 4.6 9.4 5.4 10.3
RM periphery 5.4 11.0 6.9 13.6 7.5 13.9
2010 Census
RM Fortaleza
Core 6.1 12.7 4.6 8.4 7.7 12.1
RM periphery 9.7 23.1 7.5 18.2 7.8 19.4
RM Recife
Core 7.0 13.7 5.1 7.4 6.6 10.9
RM periphery 9.2 19.0 7.2 14.1 9.4 18.5
RM Rio de Janeiro
Core 5.7 8.2 5.3 7.5 7.4 9.1
RM periphery 6.9 11.3 5.9 9.7 5.6 11.1
RM São Paulo
Core 6.6 8.9 6.7 8.5 7.6 9.6
RM periphery 5.7 8.6 5.0 7.9 5.6 9.4
Source: IBGE, Demographic Censuses 2000 and 2010 (sample microdata)
Notes: 1 – Cut-line categories: Extreme poverty - % of people with a per capita domiciliary income ranging from
R$0,01 e R$ 70,00; Poverty - - % of people with a per capita domiciliary income ranging from R$0,01 e R$ 140,00;
2 – 2000 earnings were ixed by the accumulated INPC from 08/2000 to 07/2010 (applied adjustment index:
1,9645958; source: BACEN
But what could be the explanation for the registered diferences between RMs in Northeast and Southeast? Would it be the greater insertion on the migrating population in the labor market - and, as a consequence, their attained income – theses diferences’ underlying factor?
The expected urban and regional diferences prevail amid migrants and non-migrants: the me -dian of income per worked hour assumes upper values in the Southeast region and in the capitals.
However, the impressive relative variation of the median income within the ixed-date immigrants
in the Recife RM core (144.3% from 2000 to 2010) means the median income for this group in 2010 outpaces the value recorded for the Southeastern capitals. A similar occurrence takes place among return migrants getting back to Pernambuco (capital of Recife), which similarly to Rio de Janeiro, would be computing the greatest median income for this group in all analyzed areas – 20% superior to the registered value for Sao Paulo.
Considering disparities between core and periphery, the large Southeast RMs’ capitals ex -pressed, in 2000, higher income median values for non-migrants; and nearer values for migrants and non-migrants in the borderline municipalities. In 2010, there is an inversion in Rio de Janeiro;
immigrants’ median income per hour worked overtakes non-migrants’ igures. Whereas in São Paulo there is still a predominance of greater earnings among non-migrants, the diferential betwe
51 10. At the RMs outskirts a positive variation favors immigrants in Rio de Janeiro, while at the São
Paulo’s metropolitan borders, the diferences were reduced between non-migrants and migrants. Between non-migrants and ixed-date migrants the observed income behavior was nearly the same. Analysis of these same diferentials between core and periphery in the Northeast RMs reveals
two distinct designs: in the Recife RM the migrant population presents superior income values (as previously underlined). The opposite happens in the Fortaleza RM, where the non-migrant popula-tion showed, in both periods, upper median values compared to the capital immigrants; and almost
equal igures at the outskirts in 2010.
Table 4 – Median of average income (BR$) per worked hour in main job for non-migrant, ixed-date immigrant and
return immigrant populations aged 15 years or older, resident in selected metropolises 2000/2010.
Metropolitan Region
2000
Non-migrants Fixed-date immigrants Return immigrants
2010
Varia-tion % 2000 2010
Varia-tion % 2000 2010
Varia-tion %
RM Fortaleza
Core 3.07 4.06 32.3 2.63 3.75 42.5 2.55 3.50 37.0
RM periphery 1.99 3.19 60.1 2.29 3.19 39.1 2.15 3.19 48.3
RM Recife
Core 3.41 4.55 33.3 4.91 8.68 76.7 3.07 7.50 144.3
RM periphery 2.81 3.65 29.9 3.27 4.25 29.8 3.07 3.81 24.2
RM Rio de Janeiro
Core 6.01 6.38 6.1 4.09 6.67 62.9 4.91 7.50 52.7
RM periphery 4.09 5.00 22.2 4.09 5.63 37.4 4.09 5.31 29.8
RM São Paulo
Core 6.70 6.88 2.7 4.46 6.25 40.0 5.12 6.25 22.2
RM periphery 5.36 5.63 5.0 4.91 5.63 14.5 4.91 5.36 9.1
Source: IBGE, Demographic Censuses 2000 and 2010 (sample microdata)
Notes: 2000 earnings ixed by the accumulated INPC from 08/2000 to 07/2010 (applied adjustment index:
1,9645958; source: BACEN); People with zero income from main job were not considering in calculations.
Lastly, it is valuable highlighting that the percentage variation of median average income be-tween 2000 and 2010 for migrants and non-migrants displays a pattern worth investigating in further researches. All of the groups have shown positive variations between 2000 and 2010. Aside from
Fortaleza RM outskirts, in all remaining areas both types of migrants have experienced superior
changes in their income, compared to non-migrants. Substantially positive variations were perceived
in Recife and Rio de Janeiro RMs. Additionally, it is earnest to emphasize that these indings point
to a wide-ranging income growth in the core areas, contrasted to the peripheral areas.
Data from Table 4 suggest that labor markets in metropolitan areas outside Southeast have been working as a means to reduce poverty and regional and intrametropolitan income inequalities, as seen between 2000 and 2010.
FINAL CONSIDERATIONS
The relationship between urban outskirts expansion and migration no longer holds the obvious
empiric evidence from the 1960 and 1970 decades, when the two main metropolitan regions in
Brazil would attract massive amounts of workers expelled from the Northeast rural areas. The urban
transition, in addition to the demographic transition have become essential elements in economic analysis, remarkably when the GDP growth is discussed in terms of a low productivity recent past,
with a rising labor ofer and the existing idleness in productive establishments (following many years of economic activity decline). This workforce ofer seems to be in extinction; and the migrant worker, despite multiple origins in their migration movements, poses as a experienced professional
52
The hastened urbanization from the last decades has produced material vulnerabilities in many Brazilian metropolitan outskirts. Therefore, it yet evident the lack of basic social infrastructure and urban regulation, and the dwellings transitory aspect at those areas is still alarming. Contradictorily, however, data has begun to outline an improvement in relation to the working population income and employment, what could, in a while, contribute to the alleviation of our repulsive looking urban borders. Data worked here appear to strengthen this perspective, in the same way of the questions
presented at the Introduction section inal portion.
It can be concluded that the either migrant or non-migrant over 15 years of age group, the
oc-cupation level is reasonably high, especially in 2010. The ixed-date immigrants showed a superior
occupation in São Paulo RM, although in RMRJ their proportion was almost 66%. The economic
growth observed between 2000 and 2010 must have positively afected the results in favor of the examined migrants and non-migrants.
Data about income obtained in the labor market have aided the comprehension of poverty re-duction among migrants. The indicator ‘median of average income per worked hour’ has evidenced the superiority of median values in Southeast region and capitals for the migrant and non-migrant
populations, although the median income percentage variation is too high for the ixed-date immi -grants in the Recife RM in 2000 and 2010.
Some of the investments that took place in the Northeast region, and in particular in Recife have
drawn qualiied migrants from other country regions, and that has caused positive efects over other
economic activities, both at the outskirts and at the metropolitan core. This process maintenance was
expected, at least until the end of the current decade, in face of the infrastructure works agenda in the region. It is arduous to say if such economic dynamism would be suiciently virtuous in order to generate new regional self-sustained centers during the next decades. Migration, combined with
the pursuit of better occupational placing opportunities seems to be a relevant fact to consider when
explaining inequality reduction.
However, the economic and political crisis circumstances that have later been observed in the country, notably from 2014; the interruption of many infrastructure works; and the government budget restraints are factors that could have an impact over these same metropolitan areas due to unemployment rise and advance of several types of poverty. Should the crisis and recession
scena-rio continue to last, observed inequality reduction related gains during the irst decade of the 21st
century could even disappear.
BIBLIOGRAPHIC REFERENCE
ALKIRE, S., FOSTER, J. E. Counting and Multidimensional Poverty Measurement, OPHI Working
Paper 7, Oxford Poverty and Human Development Initiative, 2007.
CANO, Wilson. Ensaios sobre a crise urbana do Brasil. Campinas, SP: Editora da Unicamp, 2011.
CORRÊA, R. L. Região e Organização Espacial. São Paulo: Ed Ática, 1986.
GOMES, Paulo Cesar da Costa. O conceito de região e sua discussão. In: Geograia: conceitos e temas. Rio
de Janeiro: Bertrand Brasil, p. 49-76, 1995.
GRIGG, D. Regiões, modelos e classes. Bol. Geogr. Rio de Janeiro, 32 (234): 3-46, maio/junho, 1973. HAESBAERT, Rogério. Regional-Global: dilemas da região e da regionalização na geograia contempo -rânea. Rio de Janeiro: Bertrand Brasil, 2010.
IBGE - Instituto Brasileiro de Geograia e Estatística. Estudos e tratamento da variável rendimento no
Censo Demográico 2010. [Em linha] Rio de Janeiro: IBGE, 2012. Disponível em: ftp://ftp.ibge.gov.br/ Censos/Censo_Demograico_2010/Resultados_Gerais_da_Amostra/Estudo_e_tratamento_rendimentos.pdf [Consult. 13 de novembro de 2012].
53 LEFEBVRE, H. A revolução urbana. Belo Horizonte: Editora UFMG, 1999.
MARICATO, E. Brasil, cidades; alternativas para a crise urbana. Petrópolis: Vozes, 2002.
MARTINE, G. Adaptação dos migrantes ou sobrevivência dos mais fortes? In: MOURA, H. (org.) Migração
Interna - textos selecionados, Fortaleza-CE, Banco do Nordeste do Brasil S.A., 1980.
MARTINE, G. O lugar do espaço na equação população/meio ambiente Revista Brasileira de Estudos Po
-pulacionais, São Paulo, v. 24, n. n. 2, p. 181-190, 2007.
MATOS, R. Periferias de grandes cidades e movimentos populacionais. Cadernos Metrópole, Rio de
Ja-neiro, n. 13. Pp. 71-105, 2005.
MOTA, D. M. As metrópoles e os desaios da política urbana. In: RIBEIRO, L. C. Q. (org.). Metrópoles;
entre a coesão e a fragmentação, a cooperação e o conlito. São Paulo e Rio de Janeiro, FASE, Perseu Abramo. Observatório das Metrópoles, 2004.
RAFFESTIN, Claude. Por uma Geograia do poder. São Paulo: Ática, 1993.
RIBEIRO, A. C. T. . Regionalização: fato e ferramenta. In: Ester Limonad; Rogério Haesbaert; Ruy Moreira.
(Org.). Brasil século XXI: por uma nova regionalização? (agentes, processos e escalas). Rio de Janeiro:
Max Limonad, 2004.
ROCHA, Sonia. Pobreza no Brasil: ainal, de que se trata?, Rio de Janeiro, Editora FGV, 2003.
ROCHEFORT, Michel. Regionalização e rede urbana. R. RA’E GA. Curitiba, n.7, p.115-121, 2003. Editora
UFPR.
SAE – Secretaria de Assuntos Estratégicos. Classe Média em Números. 2012[Em linha] Brasília: SAE Disponível em: http://sae.gov.br/novaclassemedia/numeros/ [Consult. 13 de novembro de 2012].
SEN, Amartya. Desigualdade Reexaminada. Rio de Janeiro: Record, 2001.
UFMG Notícias. Urbanização acelerada explodiu ambiência, avalia economista da Unicamp. [Em linha] Belo Horizonte: UFMG, Disponível em: https://www.ufmg.br/online/arquivos/025733.shtml [Consult. 13 de novembro de 2012].
UN-HABITAT - United Nations Human Settlements Programme. The challenge of slums global report on human settlements 2003, Nairobi-Kenya, UN-Habitat, 2003.
UNITED NATIONS. World Urbanization Prospects: The 2005 Revision. New York: Population Division,
Department of Economic and Social Afairs, United Nations, 2006.
UNITED NATIONS. World Urbanization Prospects: The 2011 Revision. New York: Population Division,
Department of Economic and Social Afairs, United Nations, 2012.