1 Financial AID: Foundation for the Support of Science and Technology of the State of Pernambuco (FACEPE) and Coordination for the Perfectioning of Staff of Superior Level (CAPES). Volunteers for this research signed a “Term of Free and Clarified Assent”. This work was approved by the Committee of Ethics in Research of the Center for the Sciences of Health of the Federal University of Pernambuco – UFPE (Protocol N º 009/08). Register of the research in the SISNEP: 174623.
VISU VISU VISU VISU
VISUAL PERCEPTION OF RAL PERCEPTION OF RAL PERCEPTION OF RAL PERCEPTION OF RAL PERCEPTION OF RADIAL SINE-WADIAL SINE-WADIAL SINE-WADIAL SINE-WADIAL SINE-WAAAAAVE GRVE GRAVE GRVE GRVE GRAAAATING AFTER TING AFTER TING AFTER TING AFTER TING AFTER THETHETHETHETHE
AL ALAL
ALALCCCCCOHOL COHOL CONSUMPTIONOHOL COHOL COHOL CONSUMPTIONONSUMPTIONONSUMPTIONONSUMPTION11111
Melyssa Kellyane Cavalcanti Galdino Liana Chaves Mendes Jákina Guimarães Vieira Maria Lúcia de Bustamante Simas Natanael Antonio dos Santos
Abstr Abstr Abstr Abstr
between frequencies versus conditions versus subjects (F8, 110 = 26,806; p < 0,001). This preliminary study suggests changes in CSF, related to moderate alcohol consumption.
Key KeyKey Key
Keywwwwwororororords:ds:ds:ds: Visual perception. Contrast sensitivity. Alcohol consumption. Radial sine-ds: wave grating. Psychophysical method.
A stimulus complex as a visual scene can be decomposed into vari-ous light intensities. This is the theoretical assumption of linear system analysis that relies on a theorem of Fourier and has been applied to study the response of the human visual system (De Valois & De Valois, 1990). This theorem is useful to try to understand how the visual system ana-lyzes and processes a complex spatial distribution of light that make up a scene, separating it into components of simple sine waves.
Fourier analysis provides the theoretical foundation for the use of visual stimuli defined by distribution of sine waves in space to study the neurophysiologic mechanisms that respond selectively to these distri-butions of waves (Sachs, Nachmias, & Robson, 1971; Schwartz, 2004). Psy-chophysical and neurophysiological researches have offered support for the application and importance of this type of model object in visual pro-cessing (De Valois & De Valois, 1990). And one of the most used tools to describe and evaluate the response of these mechanisms that respond selectively to patterns of sine waves is the Contrast Sensitivity Function (CSF).
The CSF is defined as the inverse of contrast threshold curve, 1/FSC (Cornsweet, 1970). The contrast threshold corresponds to the lowest amount of brightness that the visual system needs to detect an object in a particular spatial frequency. This is the number of cycles (or ranges of maximum and minimum luminance) per degree of visual angle or the number of cycles per unit of space (Schwartz, 2004). For example, a spa-tial frequency of 2 cycles per degree of visual angle (cpd) has two light and two dark stripes on a given space.
Research involving the moderate consumption of alcohol and the CSF are rare, and yet were found only with elementary stimuli like sinu-soidal vertical grid. For example, Roquelaure et al. (1995) measured the CSF in 30 alcoholic patients and 52 healthy volunteers, using spatial fquencies of 0.1, 0.3, 0.5, 1, 2.6 and 6 cpd. The results demonstrated a re-duction in the perception of alcoholics participating in all spatial frequen-cies tested.
Andre (1996) investigated the effects of alcohol with a blood alco-hol level of 0.073% BAC (Blood Alcoalco-hol Concentration) in two condi-tions of luminance of the monitor screen – 12.9 cd/m2 (candelas per square meter) and 0.129 cd/m2 – mobile and static stimuli, using the CSF to spatial frequencies of 1.5, 3 and 6 cpd. The results revealed a sig-nificant reduction in contrast sensitivity at higher frequency (6 cpd). Pearson and Timney (1998) measured the CSF to six volunteers to spa-tial frequencies of 0.75, 1.5, 3, 5, 7.5 and 10 cpd, with a blood alcohol level of 0.077% BAC and found that alcohol decreased contrast sensi-tivity in the perception of high spatial frequencies (7.5 and 10 cpd). On the other hand, Quintyn et al. (1999), in a study with six participants under the influence of 0.57 g / kg intake of alcohol, noticed no signifi-cant change in contrast sensitivity.
To date, no studies were found with CSF related to alcohol intake using circularly symmetric radial sinusoidal gratings. The first proposal to study these patterns described in polar coordinates came from Kelly (1960), who suggested the use of circularly symmetrical stimuli modu-lated by cylindrical Bessel function of order zero (J0). This class presents the basic stimulus modulation contrast varying sinusoidally in the radial direction, the very center of the circle as the origin of the polar coordi-nate system. According to Kelly (1960), patterns modulated by cylindrical Bessel function appear to be more natural considering the roughly circu-lar and symmetrical of the retina. In addition, such stimuli provide a clear center attachment (Magnuski & Kelly, 1975). Not so with parallel patterns such as sinusoidal gratings.
Method
Participants
Five females participated in the experiments, aged 21-30 years. They passed in two conditions: Moderate intake of alcohol (BAC.09) and no alcohol intake. The alcohol volume was calculated taking into ac-count the mass, the formula proposed by Drummer and Odell (2001): Cmax (g / l) = 0.02 x dose (g per 70 kg body weight). The volunteers were healthy, had normal visual acuity with correction and were free of visual pathologies. The participants who had personal or family history of alco-holism were excluded from the sample.
Participation in the survey was by signing a term of informed con-sent, according to Resolution No. 196/96 of the National Health Council. This work was recorded by the Ethics Committee in Research of the Cen-ter for Health Sciences at this university.
Equipment and Visual Stimuli
We used a program created by our laboratories to generate visual stimuli. These were presented on a video monitor LG, CRT (cathodic ray tube) 19-inch, connected to a computer and a BITS + + (Cambridge Re-search System). BITS + + extends the luminance of the monitor voltage of 8 to 14 bits, allowing the generation of stimuli with the largest gain in contrast. The average luminance of the screen was 42.6 cd / m² LightScan evaluated by a program and an Optical photometer (Cambridge Research Systems). We also used a model Alcoscan etilômetro Sentech AL-6000, which determines the amount of alcohol in the blood in % BAC, and a mechanical balance model TEC20 (Techline).
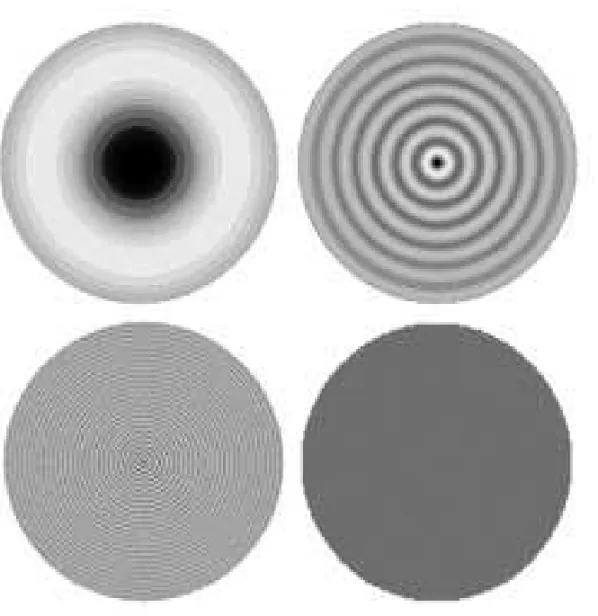
Figure 1. Examples of stimuli sinusoidal radial gratings (above, left to right, and 0.25 cpd and 2; below, from left to right, 8 cpd and neutral stimulus with luminance homogeneous). Stimuli originally calibrated to be seen at
150 cm.
Procedure
We used an experimental design with repeated measures, where all participants were tested at all frequencies and in two conditions: pla-cebo (control condition – CC) and after alcohol intake (Experimental Condition – EC), on different days. The order in which each subject un-derwent each of the two conditions was controlled by counterbalanc-ing technique.
blood alcohol content could be achieved on average 30 minutes (Drum-mer & Odell, 2001).
The tests were performed in the morning, between 9 am and 12 noon. All participants had a light breakfast and standard (200 ml of or-ange groove with soy, one banana, two loaf sandwich bread and two slices of mozzarella cheese). After breakfast, the volunteers were asked not to consume food for two hours before the experiments. The volunteers were also asked not to drink alcohol in the 24 hours proceding the experimen-tal session. The blood alcohol concentration was measured with the etilometro before the start of the experiment, 15, 30, 45 minutes after ingestion of alcohol or placebo. The average alcohol content was 0.09% BAC. This value refers to the limit of alcohol allowed by U.S. law traffic (Patel, Modig, Magnusson, & Fransson, 2010).
To measure visual perception, the estimates were made with the psychophysical forced-choice method (Wetherill & Levitt, 1965). This method is based on calculating the probability of consecutive hits by the volunteer, i.e., in about 100 presentations of choices between two stimuli (test stimulus and neutral stimulus), the test stimulus is perceived by 79% of the time volunteer.
The procedure for measuring the threshold was the frequency of each successive presentation of pairs of simple stimuli and voluntary would have to choose among them which contained the spatial frequency. The volunteers were instructed to press the left mouse button when they felt the test stimulus (spatial frequency) was presented first and right when they felt it had been presented in the second place, i.e., after the neutral stimulus.
The criterion used to measure the CS for each spatial frequency was three consecutive hits to decrease 20% of the remaining contrast, and an error to increase contrast by the same percentage.
Results
After each experimental session, the software produced a record sheet with the threshold contrast values, six in the test and six in the re-test. The values of maximum and minimum contrasts obtained for each spatial frequency (0.25, 2:08 cpd) were grouped into spreadsheets for any particular condition (EC and CC). The grand average was used as an esti-mate of contrast sensitivity as a function of spatial frequency.
that the EC was more sensitive than CC in the frequency 0.25 cpd. On the other hand, the CSF by CC was 1.11 times more sensitive than the EC at frequencies radial of 2 and 8 cpd, respectively.
Discussion
The objective of this research was to determine whether moderate alcohol intake (0.09% BAC) changes the visual processing of contrast in the adult female. The results suggested changes in visual perception of circular sinusoidal grating patterns before and after drinking alcohol. Af-ter alcohol intake was possible to observe an increased sensitivity in the frequency 0.25 cpd and a decreased sensitivity in spatial frequencies 2 and 08 cpd.
Statistical analysis with the Newman-Keuls test indicates interac-tions between the channels that process spatial frequencies and alcohol intake. Analyzing the interaction frequencies x participants noted that after the intake of alcohol (EC) the five participants showed impairment in all frequencies tested, especially in the frequency 2 cpd (p <0.001), in-dicating that the change was greater in channels that process medium frequency.
On the other hand, the results showed that the maximum contrast sensitivity occurred in the frequency range of 0.25 cpd. What character-izes a displacement of the zone of maximum sensitivity to the left, in rela-tion to the general pattern found in the literature for adults (no alcohol intake) in the same age group. That is, a peak in the low mid frequencies, with reduced sensitivity to values below or above this range. This is be-cause levels of above 9 cd/m2 luminance, the range of maximum sensi-tivity occurs around 0.5 to 2 cpd for radial frequencies (Kelly, 1982; Magnuski & Kelly, 1975; Simas, Santos, & Thiers, 1997). The displacement of the maximum sensitivity to lower frequencies can be related to the functioning of the magnocellular visual pathway, which is specialized in processing low spatial frequencies (Benedek, Benedek, Keri, & Janáky, 2003; Ellemberg, Lewis, Liu, & Maurer, 1999). Visual processing of form and contrast involves at least two systems: the parvocellular visual path-way, which is specialized in processing medium and high spatial fre-quencies or fine detail and operates at high levels or photopic lumi-nance, and the magnocellular visual pathway, which specializes in processing low spatial frequencies and operates at low or scotopic lu-minance.
The results also corroborate with other reports in the literature, which found no decline in contrast sensitivity at higher frequencies in men and women after consumption of alcohol, under conditions of lumi-nance of 21 cd/m2 (Pearson 1997, Pearson & Timney, 1998). However, this study used a different methodology (average luminance of 42.6 cd/m2, concentric circular sine wave grating and female participants only). Still, we observed significant changes in all the frequencies used.
These findings were expected, considering that the luminance of the monitor screen is an important factor in assessing the visual path-ways. Among the studies of alcohol and CSF, few have made it clear lumi-nance used. The research mentioned that this information reported sig-nificant changes in low and medium luminance, e.g., 0.129 and 12.9 cd/ m2 (Andre 1996). As this study used a luminance of 42.6 cd/m2 and found changes at all frequencies, it reinforces the hypothesis proposed by Pearson (1997) that the magnocellular and parvocellular visual pathways are affected differently by moderate alcohol intake.
Most studies that relate visual perception of contrast and alcohol intake was performed with spatial patterns of sinusoidal vertical grid type. It was not found to date no study using spatial patterns of concentric sinusoidal grating type. In this sense, the use of concentric spatial fre-quencies in studies of this nature provides an assessment of the effect of moderate alcohol intake on brain areas that had not yet been assessed by CSF. This hypothesis may be reinforced by psychophysical studies (Santos & Simas, 2002; Simas & Santos, 2002, Simas et al., 1997; Wilson & Wilkinson, 1998; Wilson, Wilkinson & Asaad, 1997) and neurophysiologi-cal (Gallant et al., 1996; Heywood, Gadotti & Cowey, 1992; Merigan, 1996, Wilkinson et al., 2000) suggesting that vertical sinusoidal gratings and concentric sinusoidal gratings are processed by distinct mechanisms and visual areas. While the stimuli of sinusoidal vertical grating type are processed in V1, concentric sinusoidal gratings are processed by corti-cal visual areas V2, V4 and IT (Gallant et al. 1996; Merigan, 1996, Wilkinson et al., 2000).
Studies with repeated measures and psychophysical method, com-monly used to assess the perception involve a small number of subjects in each condition. This is due to the fact that the difference or variance between subjects to be great. In this sense, preference was given to the procedure with repeated measures with a high number of measures at different times of the same phenomenon with an observer, where the statistic is obtained with N the number of intra-individual (Blakemore & Campbell, 1969; Campbell & Robson, 1968).
The fact of the changes found are different between the subjects indicates that alcohol alters the CSF in a heterogeneous and idiosyn-cratic conditions of the subjects are relevant to such changes. This state-ment also suggests that some variables interact with the effects of drink-ing alcohol in the body. In this study, some of these were controlled, such as standardization of the breakfast, the period between the last meal and the experiment, sex, how often the person drinks alcohol (the sample consisted of women who drank rarely), smoke and time of completion experiments. Yet changes were observed in individual alco-hol in the blood.
Some studies discuss the interaction of these and other variables and the effects of alcohol on the body (Drummer & Odell, 2001, Edwards et al., 2005; Figueira, 2002). In this context, the equation of Drummer and Odell (2001) was used as a parameter to calculate the percentage of vodka that each participant had to drink to achieve the same concentration of alcohol. Although the formula developed by these authors to be based mainly on body mass, it excludes other important variables such as body water content, height, age and gender, which interact with alcohol con-sumption.
On the other hand, this is a preliminary study and further research must be conducted to discuss more thoroughly the possible changes in visual perception related to alcohol intake and visual processing of object and contrast and even the influence of effects caused by alcohol appear to vary greatly between volunteers. It is within this perspective that we chose initially to study only the effect of alcohol intake in young healthy females. New experiments involving other mathematical equa-tions that quantify the concentration of alcohol intake, different visual stimuli and luminance must be conducted to investigate the knowledge about the possible effects of moderate alcohol intake on visual percep-tion.
Conclusion
sinusoi-dal gratings. These characteristics, in turn, may be related to the peculiar behavioral characteristics of subjects related to alcohol intake and the neural processing of stimuli. In general, taking into account the results of this study and others found in the literature, one can infer that the visual system is affected by alcohol and using different mechanisms or path-ways for processing visual spatial patterns defined in polar coordinates (grids sinusoidal concentric). From this perspective, we will proceed with investigations, including new variables including, for example, males and other levels of luminance.
P PP P
Perererercccccepção visual de grer epção visual de grepção visual de grepção visual de grepção visual de grade senoidal rade senoidal rade senoidal radial após o cade senoidal rade senoidal radial após o cadial após o cadial após o consumo de álcadial após o consumo de álconsumo de álconsumo de álconsumo de álcooloolooloolool
Resumo: Resumo: Resumo: Resumo:
Resumo: O objetivo deste trabalho foi comparar a percepção visual de contraste de adultos sem a ingestão de álcool e após a ingestão moderada de álcool – 0,09% Blood Alcohol Concentration (BAC), através da Função de Sensibilidade ao Contraste (FSC). Participaram dos experimentos cinco voluntárias, na faixa etária de 21 a 30 anos, com acuidade visual normal ou corrigida. Para medir a FSC, foram usados estí-mulos de grade senoidal radial de frequências de 0,25; 2 e 8 ciclos por grau de ângu-lo visual. Utilizou-se um delineamento experimental com medidas repetidas e o método psicofísico da escolha forçada. Os resultados demonstraram efeito signifi-cante de participantes (F4, 55 = 25,518; p < 0,001), de frequências (F2, 110 = 172,288; p < 0,001) e de interação entre frequências x condições x participantes (F8, 110 = 26,806; p < 0,001). Este estudo preliminar sugere alterações na FSC relacionadas à ingestão moderada de álcool.
P PP P
Sur la per Sur la perSur la per Sur la per
Sur la perccccception visuelle de la grille sinusoïdale reption visuelle de la grille sinusoïdale reption visuelle de la grille sinusoïdale reption visuelle de la grille sinusoïdale reption visuelle de la grille sinusoïdale radiale après la cadiale après la cadiale après la cadiale après la consommationadiale après la consommationonsommationonsommationonsommation d
dd d d’alc’alc’alc’alc’alcooloolooloolool
Résumé: Résumé:Résumé: Résumé:
Résumé: L’objectif de cette étude était comparer la perception visuelle de contraste chez des adultes sans consommation d’alcool et, dans le cas d’autres, après une consommation modérée d’alcool – 0,09% taux d’alcoolémie ( TA), grâce à la fonction de sensibilité au contraste (FSC). Cinq volontaires – âgés de 21-30 ans et avec d’acuité visuelle normale ou corrigée – ont participé aux expériences. Pour mesurer la FSC, nous avons utilisé la grille sinusoïdale radiale de 0,25; 2 et 8 cycles par degré de l’angle visuel. Nous avons utilisé aussi un modèle expérimental, avec des mesures répétées, et une méthode psychophysique de choix forcé. Les résultats ont montré d’effet significatif dans les sujets (F4, 55 = 25,518; p < 0,001), dans les fréquences (F2, 110 = 172,288; p < 0,001) et dans l’interaction entre les fréquences, les conditions et les sujets (F8, 110 = 26,806; p < 0,001). Cette étude préliminaire suggère des changements dans la FSC, liés à la consommation modérée d’alcool.
M MM M
Mots-clés:ots-clés:ots-clés:ots-clés:ots-clés: Perception visuelle. Sensibilité au contraste. Consommation d’alcool. Grille sinusoïdale radiale.
P PP P
Pererererercccccepción visual de una repción visual de una repción visual de una repción visual de una repción visual de una reja de una onda senoidal reja de una onda senoidal radial después del ceja de una onda senoidal reja de una onda senoidal reja de una onda senoidal radial después del cadial después del cadial después del cadial después del consumo deonsumo deonsumo deonsumo deonsumo de alc
alcalc alc alcoholoholoholoholohol
Resumen:Resumen:Resumen:Resumen:Resumen: El objetivo de este estudio fue comparar la percepción visual de contraste en los adultos, sin consumo de alcohol y después de un consumo moderado de alcohol por parte de ellos – 0,09% de concentración de alcohol en sangre (BAC), a través de la función de sensibilidad al contraste (CSF). Participaron en los experi-mentos cinco voluntarias, con edades entre 21 y 30 años, con valores normales de agudeza visual. Para medir la CSF, se utilizaron radiales de onda sinusoidal rejilla de estímulos de frecuencias de 0,25, 2 e 8 ciclos por grado de ángulo visual. Se utilizó un diseño experimental o croquis, con medidas repetidas y un método psicofísico de la elección forzada. Los resultados mostraron efecto significativo de sujetos (F4, 55 = 25.518, p <0.001), de las frecuencias (F2, 110 = 172.288, p <0,001) y de la interacción entre las frecuencias en comparación con las condiciones en comparación con sujetos (F8, 110 = 26,806; p <0,001). Este estudio preliminar sugiere cambios en el LCR, relaci-onados con el consumo moderado de alcohol.
P PP P
Ref Ref Ref Ref
Referererererencencencencenceseseseses
Andre, J. T. (1996). Visual functioning in challenging conditions: Effects of alcohol consumption, luminance, stimulus motion, and glare on contrast sensitivity. Journal of Experimental Psychology, 2(2), 250-269.
Benedek, G., Benedek, K., Kéri, S., & Janáky, M. (2003). The scotopic low-frequency spatial contrast sensitivity develops in children between the ages of 5 and 14 years. Neuroscience Letters, 345, 161-164.
Blakemore, C., & Campbell, F. W. (1969). On the existence of neurones in the human visual system selectively sensitive to the orientation and size of retinal images. Journal of Physiology, 203, 237-260.
Campbell, E. W., & Robson F. G. (1968). Application of the Fourier analysis to the visibility of gratings. Journal of Physiology, 197, 551-566.
Cavalcanti, M. K., & Santos, N. A. (2008). Alterações na sensibilidade ao contraste relacionadas à ingestão de álcool. Psicologia: Teoria e Pesquisa, 24(4), 515-518.
Cornsweet, T. N. (1970). Visual perception. New York: Academy Press.
De Valois, R. L., & De Valois, K. K. (1990). Spatial vision (2a ed.). New York: Oxford University Press.
Drummer, O. H., & Odell, M. (2001). Pharmacokinetics, metabolism and duration of action. In O. H. Drummer & M. Odell (Org.), The forensic pharmacology of drugs of abuse (pp. 279-289). London: Arnold.
Edwards, G., Marschall E. J., & Cook, C. C. H. (2005). O tratamento do alcoolismo: Um guia para profissionais de saúde (4a ed.). Porto Alegre: Artmed.
Ellemberg, D., Lewis, T. L., Liu, C. H., & Maurer, D. (1999). Development of spatial and temporal vision during childhood. Vision Research, 39, 2325-2333.
Figueira, I. (2002). Etanol e bebidas alcoólicas: Pode a atividade farmacológica do álcool explicar a diversidade de efeitos nos diferentes sistemas? Revista da Faculdade de Medicina de Lisboa, 7(4), 165-171.
Fine, B. J., & Kobrick, J. L. (1987). Cigarette smoking, field-dependence and contrast sensitivity. Aviation, Space, and Environmental Medicine, 58, 777-782.
Gallant, J. L., Connor, C. E., Rakshit, S., Lewis, J. W., & van Essen, D. C. (1996). Neural responses to polar, hyperbolic, and cartesian gratings in area V4 of the macaque monkey. Journal of Neurophysiology, 76, 2718-2739.
Heywood, C. A., Gadotti, A., & Cowey, A. (1992). Cortical area V4 and its role in the perception of color. Journal of Neuroscience, 12, 4056-4065.
Kelly, D. H. (1960). J0 stimulus patterns for vision research. Journal of the Optical
Society of America, 50, 1115-1116.
Kelly, D. H. (1982). Motion and vision: IV. Isotropic and anisotropic spatial response. Journal of the Optical Society of America, 72, 432-439.
Kelly, D. H., & Magnuski, H. S. (1975). Pattern detection and the two dimensional Fourier transform: Circular targets. Vision Research, 15, 911-915.
Merigan, W. H. (1996). Basic visual capabilities and shape discrimination after lesions of extrastriate area V4 in macaques. Visual Neuroscience, 13, 51-60.
Nicholson, M. E., Andre, J. T., Tyrrel, R. A., Wang, R. A., M., & Leibowitz, H. W. (1995). Effects of moderate dose alcohol on visual contrast sensitivity for stationary and moving targets. Journal of Studies on Alcohol, 56, 261-266.
Patel, M., Modig, F., Magnusson, M. M., & Fransson, P. A. (2010). Alcohol intoxication at 0.06 and 0.10% blood alcohol concentration changes segmental body movement coordination. Experimental Brain Research, 202(2), 431-446.
Pearson, P. M. (1997). The effects of ethyl alcohol on visual and auditory thresholds. Tese de doutorado, The University of Western Ontario, London, Ontario.
Pearson, P., & Timney, B. (1998). Effects of moderate blood alcohol concentrations on spatial and temporal contrast sensitivity. Journal of Studies on Alcohol, 59, 163-173.
Quintyn, J. C., Massy, M., & Brausser, G. (1999). Effects of low alcohol consumption on visual evoked potential, visual field and visual contrast sensitivity. Acta Ophthalmologica Scandinavica, 77, 23-26.
Ramchandani, V. A., Bosron, W. F., & Li, T. K. (2001). Research advances in ethanol metabolism. Pathologie-Biologie, 49, 676-682.
Sachs, M. B., Nachmias, J., & Robson, J. G. (1971). Spatial-frequency channels in human vision. Journal of the Optical Society of America, 61(9), 1176-1186.
Santos, N. A., & Simas, M. L. B. (2002). Percepção e processamento visual da forma em humanos: Filtros de frequências radiais de 1 e 4 cpg. Psicologia: Reflexão & Crítica, 15(2), 383-391.
Santos, N. A., Simas, M. L. B., & Nogueira, R. M. T. B. L. (2004). Comparison of angular frequency contrast sensitivity in young and older adults. Brazilian Journal of Medical and Biological Research, 37, 375-378.
Schwartz, S. H. (2004). Visual perception: A clinical orientation (3a ed.). New York: McGraw Hill.
Simas, M. L. B., & Santos, N. A. (2002). Contrast sensitivity to radial frequencies modulated by Jn and jn Bessel profiles. Brazilian Journal of Medical and Biological Research, 35, 1357-1366.
Simas, M. L. B., Santos, N. A., & Thiers, F. A. (1997). Contrast sensitivity to angular frequency stimuli is higher than that for sinewave gratings in the respective middle range. Brazilian Journals of Medical and Biological Research, 30, 633-636.
Slaghuis, W. L. (1998). Contrast sensitivity for stationary and drifting spatial frequency gratings in positive and negative-symptom schizophrenia. Journal of Abnormal Psychology, 107(1), 49-62.
Ventura, D. F., Simões, A. L., Tomaz, S., Costa, M. F., Lago, M., Costa, M. T. V., et al.(2005). Colour vision and contrast sensitivity losses of mercury intoxicated in Brazil. Environmental Toxicology and Pharmacology, 19, 523-529.
Vleugels, L., van Nunen, A., Lafosse, C., Ketelaer, P., & Vandenbussche, E. (1998). Temporal and spatial resolution in foveal vision of multiple sclerosis patients. Vision Research, 38, 2987-2997.
Wegner, A. J., Günthner, A., & Fahle, M. (2001). Visual performance and recovery in recently detoxified alcoholics. Alcohol & Alcoholism, 369, 171-179.
Wetherill, G. B., & Levitt, H. (1965). Sequential estimation of points on a psychometric function. The British Journal of Mathematical and Statistical Psychology, 48, 1-10.
Wilson, H. R., & Wilkinson, F. (1998). Detection of global structure in glass patterns: Implications for form vision. Vision Research, 38, 2933-2947.
M M M M
Melyssa Kellyane Celyssa Kellyane Celyssa Kellyane Celyssa Kellyane Caaaaavvvvvalcanti Gelyssa Kellyane C alcanti Galcanti Galcanti Galcanti Galdinoaldinoaldinoaldino,,,,, Program of After-Graduation in Neuropsychiatryaldino and Behavioral Sciences. Laboratory of Visual Perception (LabVis). Federal University of Pernambuco (UFPE). Address: Vigolvino Florentino da Costa St., 581, Ap. 303, Ed. Lucídia Tavares, Bairro Manaíra. Zip Code: 58038-580, João Pessoa-PB. E-mail: [email protected]
Liana Cha Liana Cha Liana Cha Liana Cha
Liana Chavvvvves Mes Mes Mes Mes Mendeendeendeendeendes, Program of After-Graduation in Neuropsychiatry and Behavioral Sciences. Laboratory of Visual Perception (LabVis). Federal University of Pernambuco (UFPE). Address: Juvenal Mario da Silva St., 377, Ap. 501, Ed. Maria Luiza, Bairro Manaíra. Zip Code: 58038-510, João Pessoa-PB. E-mail: [email protected]
Ják Ják Ják Ják
Jákina Guimarães ina Guimarães ina Guimarães ina Guimarães ina Guimarães VVVVVieirieirieirieirieiraaaaa, Specialist in Morphology (UFPE). Program of After-Graduation in Neuropsychiatry and Behavioral Sciences. Laboratory of Visual Perception (LabVis). Federal University of Pernambuco (UFPE). Address: Flávio Moreira Coutinho St., 161, Ap. 202, Ed. Maria Luiza, Bairro Manaíra. Zip Code: 58038-510, João Pessoa-PB. E-mail: [email protected]
M M M M
Maria Lúcia de Bustamantaria Lúcia de Bustamantaria Lúcia de Bustamantaria Lúcia de Bustamante Simasaria Lúcia de Bustamante Simase Simase Simase Simas, Professor of the Departament of Psychology of the Federal University of Pernambuco (UFPE). Laboratory of Visual Perception (LabVis). PhD in Psychology, Queen’s University, Kingston, Canadá. Address: Gomes de Matos Junior St., 91, Ap. 502, Bairro Encruzilhada, Zip Code: 52050-420, Recife-PE. E-mail: [email protected]
Natanael Ant Natanael Ant Natanael Ant Natanael Ant
Natanael Antonio dos Santonio dos Santonio dos Santonio dos Santonio dos Santososososos, Professor, Departament of Psychology, Federal University of Paraíba (UFPB). Laboratory of Perception, Neurosciences and Behavior (LPNeC). PhD in Neurosciences and Behavior, Federal University of São Paulo (USP). Address: Federal University of Paraíba, Center for the Human Sciences, Letters and Arts, Departament of Psychology, Conjunto Castelo Branco, s/n, Bairro Cidade Uni-versitária, Zip Code: 58059-900, João Pessoa-PB. E-mail: [email protected]
Received: 21/10/2010