Acute effect of alcohol intake on
sine-wave Cartesian and polar
contrast sensitivity functions
M.K. Cavalcanti-Galdino
1, J.A. da Silva
1, L.C. Mendes
2, N.A. dos Santos
1and M.L.B. Simas
31Departamento de Psicologia, Universidade Federal da Paraı´ba, Joa˜o Pessoa, PB, Brasil 2Departamento de Psicologia, Pontifı´cia Universidade Cato´lica do Rio de Janeiro, Rio de Janeiro, RJ, Brasil 3Departamento de Psicologia, Universidade Federal de Pernambuco, Recife, PE, Brasil
Abstract
The aim of this study was to assess contrast sensitivity for angular frequency stimuli as well as for sine-wave gratings in adults under the effect of acute ingestion of alcohol. We measured the contrast sensitivity function (CSF) for gratings of 0.25, 1.25, 2.5, 4, 10, and 20 cycles per degree of visual angle (cpd) as well as for angular frequency stimuli of 1, 2, 4, 24, 48, and 96 cycles/3606. Twenty adults free of ocular diseases, with normal or corrected-to-normal visual acuity, and no history of alcoholism were enrolled in two experimental groups: 1) no alcohol intake (control group) and 2) alcohol ingestion (experimental group). The average concentration of alcohol in the experimental group was set to about 0.08%. We used a paradigm involving a forced-choice method. Maximum sensitivity to contrast for sine-wave gratings in the two groups occurred at 4 cpd sine-wave gratings and at 24 and 48 cycles/3606 for angular frequency stimuli. Significant changes in contrast sensitivity were observed after alcohol intake compared with the control condition at spatial frequency of 4 cpd and 1, 24, and 48 cycles/3606for angular frequency stimuli. Alcohol intake seems to affect the processing of sine-wave gratings at maximum sensitivity and at the low and high frequency ends for angular frequency stimuli, both under photopic luminance conditions.
Key words: Visual perception; Contrast sensitivity function; Alcohol intake; Angular frequency; Psychophysical method
Introduction
The literature on alcohol intake and systemic effects, mainly in the central nervous system (CNS), is extensive. The sensory system seems to be particularly sensitive to acute and chronic intoxication (1,2). There are, however, a limited number of studies of the effects of alcohol on sensory processing.
Although drinking alcohol promotes loss or impairment in visual functions such as visual acuity, contrast sen-sitivity, motion processing, short-term visual memory, oculomotor mechanisms, and stereoscopic depth percep-tion, there are some divergences among studies (3-7). These differences may be due to methodological issues related to the perceptual aspects investigated, and the amount of alcohol or the manner in which it was administered.
Some studies have posed hypotheses attempting to better understand the mechanisms related to the observed changes in visual and oculomotor functions. Among those is the suggestion that the effects of alcohol
intake may result from depressant effects on the inhibitory control mechanisms and the action of neurotransmitters and neuromodulators, more specifically, the dampening effect of alcohol on the GABAergic system (i.e., gamma-aminobutyric acid) (7-9).
The action of alcohol on the CNS has a dose-dependent biphasic character. The stimulatory effects are characteristic of the first phase, while a second phase characterized by toxic or pharmacological effects related to depressant activity predominate with increased dose. These effects of alcohol are probably determined by such well-established pharmacological mechanisms as the blockade of neurotransmitter receptors and signaling pathways and some others (10).
The attenuation induced by alcohol in the excitatory system seems to play a relevant role in mediating changes on neuronal activity. Chen et al. (11) evaluated the response properties of neurons of the primary visual cortex (A17) in adult cats, and found changes in the
Correspondence: M.K. Cavalcanti-Galdino, Rua Vigolvino Florentino da Costa, 581, Apto303, 58038-580 Joa˜o Pessoa, PB, Brasil. Fax: ++55-83-3021-1037. E-mail: [email protected]
selective activities of neurons for orientation and direction (i.e., related to the perception of form and movement).
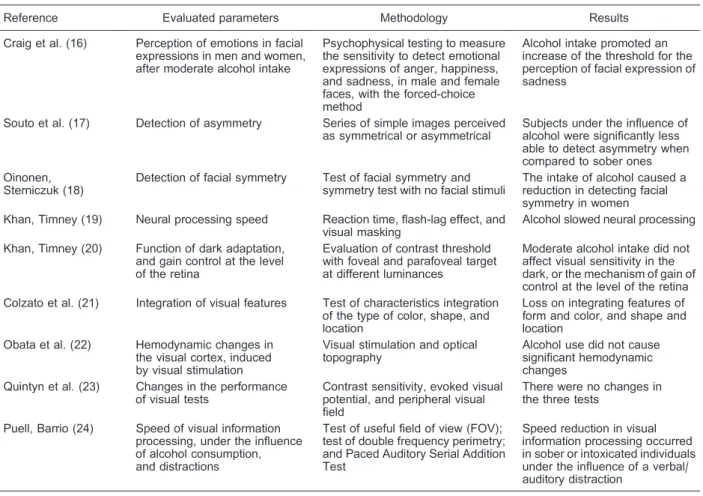
Psychophysical and behavioral studies related to alcohol intake may advance our knowledge of mechan-isms of action of alcohol and the affected areas in the CNS (12-14). However, few studies have been performed with this theme. A systematic review of articles published between 2000 and 2010 relating to alcohol intake and changes in neuro-perceptual vision identified nine articles that found changes in visual perception after alcohol intake. The results are controversial, but evidence was found that alcohol has a potentially neurotoxic effect in the visual system, and that it impairs the spatial vision functions in several brain areas through different mechan-isms (15) (Table 1 (16-24)).
The present study examined the visual perception of contrast using the contrast sensitivity function (CSF), which is a useful tool for assessing visual functions in visual disorders, neurological conditions and associated with substance use (2,25-28). The CSF is an essential property of contrast processing, an important aspect of visual function associated with object detection and recognition and perceptual decision making. The spatial
luminance CSF represents the activity of several selec-tive cortical channels at spatial frequency bands that may represent, at least in part, the activity of retinoic-geniculo-ribbed, parallel channels M and P. Many studies have investigated the existence of a certain priority functional impairment of spatial processing channels. Its use as a tool for the study of visual dysfunction is a good example of how research, initially motivated by the desire to understand the workings of the visual system, can be used in medical applications. Moreover, this kind of knowledge has been used in industry to guide the design of optical and optoelectronic devices such as televisions with high spatial and temporal resolution (29).
The possibility of relating sensitivity levels or the contrast threshold with spatial frequencies allows evalua-tion of the mechanisms and pathways that process visual contrast. However, most research related to CSF uses elementary stimuli in Cartesian coordinates as the standard (vertical sine-wave gratings). No results related to alcohol intake and elementary stimuli in polar coordi-nates (angular frequencies) are available. Stimuli defined in polar coordinates are preferably processed by areas of the extra-striate cortex V2, V4, and the inferotemporal
Table 1. Systematic review of articles grouped by reference, evaluated parameters, methodology, and results.
Reference Evaluated parameters Methodology Results
Craig et al. (16) Perception of emotions in facial expressions in men and women, after moderate alcohol intake
Psychophysical testing to measure the sensitivity to detect emotional expressions of anger, happiness, and sadness, in male and female faces, with the forced-choice method
Alcohol intake promoted an increase of the threshold for the perception of facial expression of sadness
Souto et al. (17) Detection of asymmetry Series of simple images perceived as symmetrical or asymmetrical
Subjects under the influence of alcohol were significantly less able to detect asymmetry when compared to sober ones Oinonen,
Sterniczuk (18)
Detection of facial symmetry Test of facial symmetry and symmetry test with no facial stimuli
The intake of alcohol caused a reduction in detecting facial symmetry in women Khan, Timney (19) Neural processing speed Reaction time, flash-lag effect, and
visual masking
Alcohol slowed neural processing
Khan, Timney (20) Function of dark adaptation, and gain control at the level of the retina
Evaluation of contrast threshold with foveal and parafoveal target at different luminances
Moderate alcohol intake did not affect visual sensitivity in the dark, or the mechanism of gain of control at the level of the retina Colzato et al. (21) Integration of visual features Test of characteristics integration
of the type of color, shape, and location
Loss on integrating features of form and color, and shape and location
Obata et al. (22) Hemodynamic changes in the visual cortex, induced by visual stimulation
Visual stimulation and optical topography
Alcohol use did not cause significant hemodynamic changes
Quintyn et al. (23) Changes in the performance of visual tests
Contrast sensitivity, evoked visual potential, and peripheral visual field
There were no changes in the three tests
Puell, Barrio (24) Speed of visual information processing, under the influence of alcohol consumption, and distractions
Test of useful field of view (FOV); test of double frequency perimetry; and Paced Auditory Serial Addition Test
cortex, unlike stimuli defined in Cartesian coordinates, which are processed in the V1 area. The primary objective of this study was to evaluate the effects of acute alcohol ingestion on contrast sensitivity for elementary visual stimuli of spatial frequencies in both Cartesian and polar coordinates, using sine-wave gratings and angular fre-quency stimuli.
Material and Methods
Participants
Twenty volunteers with normal or corrected vision (19-31 years of age, mean age ± SD = 21.75 ± 2.95 years; 10 females and 10 males) participated in the experiments. All participants were tested for visual acuity with Rasquin’s chart of optotypes ‘‘E’’, and Ishihara’s color test. They had no personal or family history of alcoholism, did not use psychotropic substances and were nonsmok-ers. Participation was voluntary, by signing a clear, free consent form. This research was approved by the ethics committee of the Center for Health Sciences of Universidade Federal de Pernambuco.
Equipment and stimuli
The equipment included a 19-inch cathode ray tube video monitor (LG, Brasil) with VGA and DVI inputs, connected to a digital video processor, BITS+++ (Cambridge Research Systems, United Kingdom). We also used a mouse for the participant response to the presented visual stimuli. A ColorCal photometer (Cambridge Research Systems) and a model BFD-50 (Instrutherm, Brasil) ethyl meter were used to measure the blood alcohol level. We set photopic luminance con-ditions to 41.05 cd/m2.
We used elementary visual stimuli of spatial frequen-cies in Cartesian coordinates of 0.25, 1.25, 2.5, 4, 10, and 20 cycles per degree of visual angle (cpd), and in polar coordinates of 1, 2, 4, 24, 48, and 96 cycles/3606, as well as a neutral stimulus at mean luminance, to measure contrast sensitivity curves. All stimuli were static, gener-ated in gray scale, circularly symmetric, with a diameter of about 7 degrees of visual angle and presented at 300 cm distance between the monitor and the volunteer. Other details about these procedures have been previously described (30).
Procedures
All volunteers were subjected to both conditions: alcohol intake (experimental condition, EC), and no alcohol ingestion (control condition, CC), on different days, with an interval of at least 24 h. A counterbalancing technique was employed to monitor the effect of order. The volunteers expected to consume alcohol in both conditions. The experiments always began at 9:00 am or at 2:00 pm, and all volunteers were instructed to consume a light meal 2 h before the experiments. They were
instructed not to consume alcohol within 24 h of the experiment.
The alcohol was administered as vodka with a concentration of 40% alcohol by volume, diluted with passion fruit juice 1/3 v/v. In the CC sessions, volunteers received the same amount of liquid. The only modification made was the replacement of alcohol with lemon juice.
The amount of alcohol administered to each volunteer was calculated based on adaptations of previously published mathematical formulas (31), using weight, height, age, amount of body water, and gender.
The current Brazilian Traffic Code (‘‘Co´digo Brasileiro de Traˆnsito’’) established a limit of zero tolerance for alcohol intake by drivers (32). Thus, in this study, we adopted the U.S. legal limit of 0.08-0.10% blood alcohol concentration (BAC) (33) for standardization purposes. The desired alcohol level was 0.08% BAC.
The volunteers had 15 min to drink the amount required, and the experiments began 30 min after they had finished. The ethyl meter BFD-50 was used to estimate the blood alcohol level before the experimental session, at 30 and 50 min after ingestion, and at the end of each session.
The forced-choice psychophysical method was used to measure the CSF of all participants in both conditions (with and without the ingestion of alcohol). In this method, the volunteer had to choose which of two stimuli contained the test stimulus (34). The forced-choice method is based on the probability of consecutive hits by the volunteer. The criterion used to measure contrast sensitivity to spatial frequencies was that after three consecutive correct choices, contrast was reduced by 20%, and after an error contrast was increased by the same amount. We measured 10 peaks and valleys as contrast estimate values for each of the 12 spatial frequencies used. Thus, the number of presentations varied among both spatial frequencies and volunteers. The experimental session was finished as soon as 10 maximum and minimum values were obtained.
During each experimental session, stimulus pairs were presented in sequence. The session began with a high pitch beep, followed immediately by the presenta-tion of the first stimulus for 2 s. After a delay of 1 s, the second stimulus was presented for another 2 s and was followed by the response of the volunteer. The two stimuli were always presented in random order. When the volunteer’s answer was correct, it was followed by a low pitch beep, and an interval of 3 s preceded the next pair presentation.
Results
On average, all volunteers presented an alcohol level intake corresponding to M=0.07115% BAC, DP=0.0126. Figure 1A shows the mean±SD values of contrast sensitivities for the six spatial frequencies tested with vertical sine-wave gratings and Figure 1B shows the mean values of contrast sensitivities for the six angular frequency stimuli, with or without alcohol intake.
With the use of vertical sinusoidal frequency, alcohol intake increased the sensitivity in the midrange cies and decreased sensitivity at low and high frequen-cies. Contrast sensitivity in the EC was of the order of 1.0 and was 1.0 times more sensitive than CC at the frequencies 2.5 and 4 cpd. On the other hand, the CC contrast sensitivity was approximately 1.1, 1.0, 1.1, and 1.0 times more sensitive than the EC at frequencies 0.5, 1:25, 10, and 20 cpd, respectively.
ANOVA for repeated measures, with two within factors, showed no significant difference in effect between the experimental conditions (F1,399=0.36, P=0.54), but showed a significant effect for spatial frequencies (F5,1995=1791.7, P,0.05), as well as for the interaction between experimental conditions and spatial frequencies (F5,1995=3.626, P,0.05). Analyses with the post hoc Newman-Keuls test showed significant differences between the CC and EC only in the spatial frequency of 4 cpd (P,0.0001). Thus, alcohol intake increased sensitivity at 4 cpd where maximum sensitivity occurred in both experi-mental conditions.
With the use of angular frequency, alcohol increased the sensitivity at low frequencies and increased sensitivity at medium and high frequencies. Contrast sensitivity of EC
was 1.2, 1.0, and 1.0 times more sensitive than that of the CC at the frequencies 1, 2, and 4 cycles/3606. On the other hand, the CC was 1.0, 1.2, and 1.0 times more sensitive than the EC at frequencies 24, 48, and 96 cycles/3606, respectively. The range of greater sensitivity in both conditions was at frequencies of 24 and 48 cycles/3606.
ANOVA for repeated measures, with two within factors, showed a significant difference in effect between conditions (F1,399=14.393, P,0.05), between spatial frequencies (F5,1995=1023.820, P,0.05), and between the interaction conditions vs spatial frequencies (F5,1995=14.948, P,0.05). Analyses with the post hoc Newman-Keuls test showed significant differences between the CC and EC in the frequencies 1, 24, and 48 cycles/3606. Thus, alcohol intake increased sensitivity at an angular frequency of 1 cycle/3606 and decreased sensitivity at the range of maximum sensitivity, i.e., at 24 and 48 cycles/3606angular frequencies.
Discussion
This study focused on basic issues related to processing of visual contrast and alcohol intake. Two contrast sensitivity functions were used to describe changes in the human visual system performance related to alcohol intake. The results using sine-wave gratings and angular frequency stimuli showed that the CSF for both classes of spatial frequencies were affected by alcohol drinking. These changes were expected, con-sidering the main findings in the literature for spatial frequencies in Cartesian coordinates (1,2,7,14,35).
In a previous study (1), the visual contrast sensitivity (VCS) was measured in 30 alcohol and tobacco abuse
patients and 52 controls. They used eight vertical sinusoidal gratings with spatial frequency ranging from 0.1 to 9 cycles/degree (c/d). In patients, the mean reduction of VCS at all spatial frequencies was 2.49 dB below the level of the control group. But the VCS deficit was larger for high spatial frequencies (9, 6, and 4 c/d) and low frequencies (0.1 and 0.3 c/d) than for medium frequencies (1 and 2 c/d).
In another study (34), the separate and combined effects of the detrimental factors of low luminance, alcohol consumption, stimulus motion, and glare on contrast sensitivity (CS) for 1.5, 3.0, and 6.0 cycles per degree sine-wave gratings were investigated in twelve partici-pants. Results related loss in CS for stationary and moving sine-wave gratings as a function of BAC that ranged from 0.044 to 0.088%. The effects were not limited to intermediate spatial frequencies (3.0 and 6.0 cpd); large losses were also found at 1.5 cpd. Furthermore, the contrast sensitivity loss was immense (0.92 log unit) at the spatial frequency to which humans are most sensitive during daytime, namely 3.0 cpd.
The influence of acute ingestion of alcohol was previously investigated using three breath measurement levels of blood alcohol (0.00, 0.05, and 0.1% BAC) on distant visual acuity, stereoacuity, contrast sensitivity, accommodation, resting focus of accommodation and binocular vision (7). Contrast sensitivity, stereoacuity and binocular vision were affected at both 0.05 and 0.1% BAC, but only the higher spatial frequencies of contrast sensitivity (18 cpd) were affected. Significant reductions were observed between placebo and 0.05 and 0.1% BAC at this frequency. The investigators concluded that the impairment of oculomotor control, stereocuity and contrast sensitivity, even in the low dosage condition, might be explained in part by not employing a more sensitive technique and by the depressant effect exerted by alcohol upon the reticular formation.
In order to gain a more complete picture of the influence of alcohol on visual performance, CS was measured for a range of spatial (0.5, 0.75, 1, 2, 4, 6, 8, 12, and 14 cycles per degree) and temporal frequencies (1, 3, 6, and 12 Hz) in individuals with moderate blood alcohol concentration (0.06% BAC) (14). The average sensitivity loss over all spatial frequencies was approximately 43%. The largest effects were observed at the lowest and highest frequen-cies, with the smallest effect in the middle range.
The effects of alcohol on contrast discrimination have been measured in a study (2) that explored whether the deficits could be explained as a consequence of reduc-tion in contrast gain. Detecreduc-tion thresholds and contrast increment thresholds under placebo and alcohol (0.06% BAC) conditions were measured in six volunteers. Alcohol was found to impair both detection and discrimination only at high spatial frequencies.
In our study, we expected a reduction over the whole range of spatial frequencies related to alcohol intake. We
did not expect a significant increase in sensitivity to the low angular frequency of 1 cycle/3606.
The results of a significant reduction of sensitivity in vertical sine-wave gratings of 0.5 cpg and angular frequencies of 24 and 48 cycles/3606 are consistent with studies that found a reduced sensitivity to high spatial frequencies (1,2,14,35). However, only one study (35) reported the levels of luminance used (0.129 and 12.9 cd/m2), and assigned to such luminance levels the effect of greater loss of sensitivity in the high spatial frequencies.
On the other hand, some studies found no change in contrast sensitivity with the use of static stimuli at 0.08% BAC (12,23). This difference from the results of the above studies may be due to differences in the methodological aspects (luminance, and stimuli alcohol concentrations) used in each study.
Some hypotheses found in the literature may explain these results. The inhibitory neural mechanisms of interaction are more affected by alcohol than excitatory mechanisms (36). Alcohol would promote decreased activity of inhibitory mechanisms; as stated earlier, a major inhibitory mechanism in the visual system involves the organization of the receptive fields of cells through lateral inhibition. This mechanism is important for the perception of spatial information with high levels of detail (37), and confirms the findings of reduced sensitivity in the high spatial frequencies and an increase in low frequencies.
The magnocellular pathway, related to spatial location, may be more affected by alcohol than the parvocellular pathway, which is related to the detection of texture and detail (38). We found no evidence of impairment in the magnocellular pathway. However, it is a luminance condition, and not the spatial frequencies that determines which system is changed.
This study used a luminance level of 41.05 cd/m2. The measurement of CSF in terms of photopic luminance provides an indication of the responsiveness of the parvocellular pathway, which receives afferents mainly from the fovea and is specialized in processing fine details of objects, namely at middle and high frequencies (39).
At high luminance levels, the range of maximum sensitivity for spatial frequencies vertical sine-wave gratings occurs around 3 to 4 cpd (40). For the angular frequency stimuli, maximum sensitivities occur in the range of 24 to 48 cycles/3606. In this sense, alcohol altered maximum sensitivity in both patterns of spatial frequencies when using photopic luminance conditions. Similar results have been found with vertical sine-wave gratings (2), leading to the conclusion that the observed changes in discrimination might simply have been a result of a shift in detection threshold after alcohol ingestion, rather than any changes in contrast gain mechanisms.
the visual system to certain stimuli depends on the spatial, physical, mathematical model, and the coordinate system (Cartesian or polar) that define them. Taking into account these considerations, the results of the present study, and the data in the available literature, we can infer that the visual system uses different mechanisms or pathways for processing sine-wave gratings and angular frequency stimuli, and that alcohol possibly affects both systems.
Further research will be conducted to assess the role of low and high luminance levels.
Acknowledgments
Research supported by Fundac¸a˜o de Amparo a` Cieˆncia e Tecnologia do Estado de Pernambuco (FACEPE), CAPES, and CNPq.
References
1. Roquelaure Y, Le Gargasson JF, Kupper S, Girre C, Hispard E, Dally S. Alcohol consumption and visual contrast sensitivity.Alcohol Alcohol1995; 30: 681-685.
2. Pearson P, Timney B. Alcohol does not affect visual contrast gain mechanisms. Vis Neurosci 1999; 16: 675-680, doi: 10.1017/S0952523899164071.
3. Donnelly M, Miller RJ. Ingested ethanol and binocular rivalry.Invest Ophthalmol Vis Sci1995; 36: 1548-1554. 4. MacArthur RD, Sekuler R. Alcohol and motion perception.
Percept Psychophys 1982; 31: 502-505, doi: 10.3758/ BF03204860.
5. MacCarthy F, Tong JE. Alcohol and velocity perception: II. Stimulus discrimination.Percept Mot Skills1980; 51: 968-970, doi: 10.2466/pms.1980.51.3.968.
6. Miyao M, Ishikawa H, Ito M, Teo PC, Furuta M, Ishigaki H. Effect of a low dose of alcohol on dynamic visual acuity. Percept Mot Skills 1994; 78: 963-967, doi: 10.2466/ pms.1994.78.3.963.
7. Watten RG, Lie I. Visual functions and acute ingestion of alcohol. Ophthalmic Physiol Opt 1996; 16: 460-466, doi: 10.1016/0275-5408(96)00020-8.
8. Johnston KD, Timney B. Effects of acute ethyl alcohol consumption on a psychophysical measure of lateral inhibition in human vision. Vision Res 2008; 48: 1539-1544, doi: 10.1016/j.visres.2008.04.010.
9. Khan SA, Timney B. Alcohol slows interhemispheric transmission, increases the flash-lag effect, and prolongs masking: evidence for a slowing of neural processing and transmission. Vision Res 2007; 47: 1821-1832, doi: 10.1016/j.visres.2007.03.008.
10. Antoshechkin AG. Physiological model of the stimulative effects of alcohol in low-to-moderate doses.Ann N Y Acad Sci2002; 957: 288-291.
11. Chen B, Xia J, Li G, Zhou Y. The effects of acute alcohol exposure on the response properties of neurons in visual cortex area 17 of cats.Toxicol Appl Pharmacol2010; 243: 348-358, doi: 10.1016/j.taap.2009.11.027.
12. Andre JT, Tyrrell RA, Leibowitz HW, Nicholson ME, Wang M. Measuring and predicting the effects of alcohol con-sumption on contrast sensitivity for stationary and moving gratings. Percept Psychophys 1994; 56: 261-267, doi: 10.3758/BF03209760.
13. Nicholson ME, Andre JT, Tyrrell RA, Wang M, Leibowitz HW. Effects of moderate dose alcohol on visual contrast sensitivity for stationary and moving targets.J Stud Alcohol 1995; 56: 261-266.
14. Pearson P, Timney B. Effects of moderate blood alcohol concentrations on spatial and temporal contrast sensitivity. J Stud Alcohol1998; 59: 163-173.
15. Cavalcanti-Galdino MK, Silva JA, Santos NA, Simas M. The effect of alcohol ingestion on visual perception: systematic review.Neurobiologia2010; 73: 151-161.
16. Craig LC, Attwood AS, Benton CP, Penton-Voak IS, Munafo MR. Effects of acute alcohol consumption and alcohol expectancy on processing of perceptual cues of emotional expression. J Psychopharmacol 2009; 23: 258-265, doi: 10.1177/0269881108092126.
17. Souto A, Bezerra BM, Halsey LG. Alcohol intoxication reduces detection of asymmetry: an explanation for increased perceptions of facial attractiveness after alcohol consump-tion?Perception2008; 37: 955-958, doi: 10.1068/p5951. 18. Oinonen KA, Sterniczuk R. An inverse relationship between
typical alcohol consumption and facial symmetry detection ability in young women.J Psychopharmacol2007; 21: 507-518, doi: 10.1177/0269881106073174.
19. Khan SA, Timney B. Alcohol slows interhemispheric trans-mission, increases the flash-lag effect, and prolongs mask-ing: Evidence for a slowing of neural processing and transmission.Vision Res2007; 47: 1821-1832, doi: 10.1016/ j.visres.2007.03.008.
20. Khan SA, Timney B. Alcohol does not affect dark adaptation or luminance increment thresholds.J Stud Alcohol Drugs 2007; 68: 493-502.
21. Colzato LS, Erasmus V, Hommel B. Moderate alcohol consumption in humans impairs feature binding in visual perception but not across perception and action.Neurosci Lett2004; 360: 103-105, doi: 10.1016/j.neulet.2004.01.054. 22. Obata A, Morimoto K, Sato H, Maki A, Koizumi H. Acute effects of alcohol on hemodynamic changes during visual stimulation assessed using 24-channel near-infrared spec-troscopy.Psychiatry Res2003; 123: 145-152, doi: 10.1016/ S0925-4927(03)00063-5.
23. Quintyn JC, Massy J, Quillard M, Brasseur G. Effects of low alcohol consumption on visual evoked potential, visual field and visual contrast sensitivity. Acta Ophthalmol Scand 1999; 77: 23-26, doi: 10.1034/j.1600-0420.1999.770105.x. 24. Puell MC, Barrio A. Effect of driver distraction and low
alcohol concentrations on useful field of view and fre-quency-doubling technology perimetry. Acta Ophthalmol 2008; 86: 634-641, doi: 10.1111/j.1600-0420.2007.01100.x. 25. Elliott DB, Situ P. Visual acuity versus letter contrast sensitivity in early cataract. Vision Res 1998; 38: 2047-2052, doi: 10.1016/S0042-6989(97)00382-9.
26. Flom MC, Brown B, Adams AJ, Jones RT. Alcohol and marijuana effects on ocular tracking.Am J Optom Physiol Opt1976; 53: 764-773.
auxiliary diagnostic test. Brain 1977; 100: 563-579, doi: 10.1093/brain/100.3.563.
28. Slaghuis WL, Thompson AK. The effect of peripheral visual motion on focal contrast sensitivity in positive- and negative-symptom schizophrenia.Neuropsychologia2003; 41: 968-980, doi: 10.1016/S0028-3932(02)00321-4.
29. Souza G, Lacerda E, Arau´jo C, Silveira L. A visa˜o atrave´s dos contrastes.Estudos Avanc¸ados2013; 27: 45-60, doi: 10.1590/S0103-40142013000100005.
30. Simas ML, Santos NA. Narrow-band 1, 2, 3, 4, 8, 16 and 24 cycles/360 degrees angular frequency filters.Braz J Med Biol Res2002; 35: 243-253, doi: 10.1590/S0100-879X2002 000200014.
31. Brick J. Standardization of alcohol calculations in research. Alcohol Clin Exp Res2006; 30: 1276-1287, doi: 10.1111/ j.1530-0277.2006.00155.x.
32. Brasil CTB. Co´digo de Traˆnsito Brasileiro: instituı´do pela Lei No. 9.503, de 23-9-97. 3rd edn. Brası´lia: DENATRAN, 2008. http://www.denatran.gov.br/publicacoes/download/ctb.pdf. Accessed June 10, 2010.
33. International Center for Alcohol Policies. Blood alcohol concentration limits worldwide. ICAP Report 11. Washington, DC. http://www.icap.org/portals/0/download/
all_pdfs/ICAP_Reports_English/report11.pdf. Accessed June 12, 2010.
34. Wetherill GB, Levitt H. Sequential estimation of points on a psychometric function.Br J Math Stat Psychol1965; 18: 1-10, doi: 10.1111/j.2044-8317.1965.tb00689.x.
35. Andre´ JT. Visual functioning in challenging conditions: effects of alcohol consumption, luminance, stimulus motion, and glare on contrast sensitivity.J Exp Psychol1996; 2: 250-269. 36. Virsu V, Kyykka T, Vahvelainen M.Effects of alcohol on inhibition in the human visual system. II. Spatial and temporal contrast sensitivity. Helsinki: Reports from the Institute of Psychology, University of Helsinki; 1974. 37. Cornsweet TN. Visual perception. New York: Academic
Press; 1970.
38. Hill JC, Toffolon G. Effect of alcohol on sensory and sensorimotor visual functions.J Stud Alcohol1990; 51: 108-113.
39. Benedek G, Benedek K, Keri S, Janaky M. The scotopic low-frequency spatial contrast sensitivity develops in chil-dren between the ages of 5 and 14 years.Neurosci Lett 2003; 345: 161-164, doi: 10.1016/S0304-3940(03)00520-2. 40. De Valois RL, De Valois KK. Spatial vision. New York: