ERRATA
The page 334 of the
Journal of The Brazilian
Society of Mechanical Sciences and Engineering,
Vol. XXIX, No. 3 (July-September) must be
Albino J. K. Leiroz and Roger H. Rangel
334/ Vol. XXIX, No. 3, July-September 2007 ABCM
The temporal variation of the droplet mass vaporization rate defined as
( )
( )
(
)
( )
* 2 * * * * * 2 0, sin , 0
4 ref s
m t
m t V t d t
R V
π
θ θ θ
πρ
= & =
∫
>& (15)
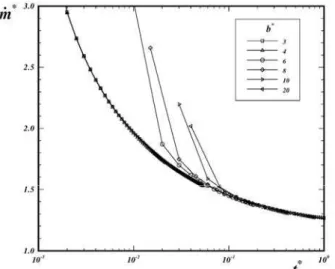
is shown in Fig. 7 for different interdroplet spacings. For each time step, converged droplet blowing velocity profiles are used in evaluating the integral in Eq.(15). The subroutines DCSAKM and DCSITG from IMSL (IMSL Library,1991) are used to provide a cubic-spline interpolation of the blowing velocity profile and perform the integration, respectively.
Figure 7. Droplet mass vaporization rate for different interdroplet spacings.
Due to be infinite Damköler assumption, droplet mass vaporization rate results present a discontinuity for initial times as depicted in Fig. 7. Nevertheless, results depicted in Fig. 7 for different spacings converge to a single limiting curve, thus indicating that droplets in streams with different spacings initially vaporize at similar rates. Using a least-square approximation of the numerical data, the correlation for the limiting curve can be written as
( )
* 1 0ln m& =g tg (16)
where g0 = 0.18173 and g1 = – 0.285078 with a maximum deviation
of less than 1%.
In order to provide further understanding of the similar vaporization rate phenomena, temperature distributions at t* = 0.42 for interdroplet spacings of 8 and 15 are portrayed in Fig. 8. Flame sheet shape and position are also depicted in Fig. 8. Despite the general discrepancy, temperature distribution in the droplet near field coincide, within the precision of the calculations, for both interdroplet spacings as shown in Fig. 9, thus leading to similar values of droplet mass vaporization rate. Therefore, droplet interaction effects must develop through the gas phase in order to affect the general droplet mass vaporization, which is related to the gradient at the droplet surface.
Figure 8. Temperature profiles and flame position for b* = 8 (above) and b* = 15 (below) – t* = 0.42.
Figure 9. Temperature profiles and flame position for for b* = 8 (dashed) and b* = 15 (solid) - t* = 0.42.
Conclusions