Prognostic significance of AKT/mTOR signaling
in advanced neuroendocrine tumors treated
with somatostatin analogs
Isabel Fernandes1,2 Teresa R Pacheco2 Adília Costa3
Ana C Santos2
Ana R Fernandes3
Mara Santos3
António G Oliveira4
Sandra Casimiro2
António Quintela1
Afonso Fernandes2 Madalena Ramos3 Luís Costa1,2
1Department of Medical Oncology,
Hospital Santa Maria, CHLN, Lisboa, Portugal; 2Clinical and Translational
Oncology Research Unit, Instituto
de Medicina Molecular, Faculdade de
Medicina, Universidade de Lisboa,
Lisboa, Portugal; 3Department of
Pathology, Hospital Santa Maria, CHLN, Lisboa, Portugal; 4Department
of Biostatistics, Faculdade de Ciências Médicas, Universidade Nova, Lisboa,
Portugal
Correspondence: Luís Costa Serviço de Oncologia – Hospital de Santa Maria, Instituto de
Medicina Molecular, Av Prof Egas
Moniz 1600 Lisboa, Portugal Tel +351 21 780 5097 Fax +351 21 780 5615
Email luiscosta.oncology@gmail.com
Introduction: Somatostatin analogs (SSAs) are used as part of standard treatment for advanced neuroendocrine tumors (NETs). The mechanisms behind the antiproliferative action of SSAs remain largely unknown, but a connection with the mammalian target of rapamycin (mTOR) signaling pathway has been suggested. Our purpose was to evaluate the activation status of the AKT/mTOR pathway in advanced metastatic NETs and identify biomarkers of response to SSA therapy.
Patients and methods: Expression of phosphatase and tensin homolog (PTEN), phospho-rylated (p)-AKT(Ser473), and p-S6(Ser240/244) was evaluated using immunohistochemistry in archival paraffin samples from 23 patients. Expression levels were correlated with clinico-pathological parameters and progression-free survival under treatment with SSAs.
Results: A positive association between p-AKT and p-S6 expression was identified (P= 0.01) and higher expression of both markers was observed in pancreatic NETs. AKT/mTOR activation was observed without the loss of PTEN expression. Tumors showing AKT/mTOR signaling activa-tion progressed faster when treated with SSAs: higher expression of p-AKT or p-S6 predicted a median progression-free survival of 1 month vs 26.5 months for lower expression (P= 0.02).
Conclusion: Constitutive activation of the AKT/mTOR pathway was associated with shorter time-to-progression in patients undergoing treatment with SSAs. Larger case series are needed to validate whether p-AKT(Ser473) and p-S6(Ser240/244) can be used as prognostic markers of response to therapy with SSAs.
Keywords: mTOR pathway, neuroendocrine tumor, somatostatin analogs
Introduction
Neuroendocrine tumors (NETs) comprise a diverse group of rare malignancies, the incidence and prevalence of which have increased over recent decades, according to a recent analysis of the Surveillance, Epidemiology, and End Results (SEER) Program database in the United States.1 Although most NETs present indolent progression,
a significant number of patients are diagnosed presenting with unresectable or metastatic disease. These patients usually have a poor prognosis since limited systemic treatment options are available for this subgroup.
More than 80% of NETs express somatostatin receptors, and management of NETs has shown major improvement with the use of somatostatin analogs (SSAs), either alone or in combination with other chemotherapeutic agents.2 SSAs, such as octreotide and
lanreotide, are generally well-tolerated and are very efficient in alleviating hormone-related symptoms associated with functional tumors. Less well understood is the effect of SSAs in disease stabilization and remission.3–6
O R I g I N A L R E s E A R C h open access to scientific and medical research
The mechanism(s) by which SSA treatment can be effective in controlling tumor growth are complex and poorly understood. The antiproliferative action of SSAs is mediated through interaction with specific cell surface somatostatin receptors (SSTR1-5) and recent data have highlighted the activation of downstream signaling path-ways, particularly those involving mitogen-activated pro-tein kinase (MAPK), phosphatidylinositol-3-kinase (PI3K), and protein kinase B (AKT), that ultimately mediate cell growth arrest and apoptosis.5–7 In this regard, an
anti-proliferative action of octreotide in pancreatic and pitu-itary tumor cells mediated by altered PI3K signaling and AKT phosphorylation has been reported.8,9 More recently,
octreotide was shown to exhibit significant antiprolifera-tive effects on a rodent-derived insulinoma cell line by inhibiting phosphorylation of tuberous sclerosis complex 2 (TSC2), mammalian target of rapamycin (mTOR), and ribosomal S6 kinase 1, key components of the AKT/mTOR signaling pathway, while the phosphorylation of AKT was unaffected.10 These results suggest that interplay exists
between the mechanisms regulating the antiproliferative effects of SSAs and the AKT/mTOR pathway, which plays a central role in regulating protein synthesis, cell growth, proliferation, and angiogenesis.11
mTOR has recently emerged as an important target for cancer therapy. Particularly, in NETs, the relevance of the AKT/mTOR pathway became evident, with promising antitumor activity observed with the use of the mTOR inhibi-tors in combination with SSAs in phase II trials involving patients with NETs.12,13 The benefit of using everolimus,
a rapamycin analog, in patients with advanced pancreatic NETs has been confirmed in the phase III RADIANT-3 trial, which showed that everolimus substantially prolonged disease-free survival compared with placebo across all patient subgroups, including those receiving prior and/or on-study SSA treatment.14,15
High expression rates of phosphorylated mTOR have been demonstrated in poorly differentiated NETs,16 and
higher activity of the mTOR pathway was observed in foregut gastroenteropancreatic NETs showing a higher proliferative capacity.17 However, the correlation between mTOR
expres-sion and activity with the outcome of patients undergoing treatment with SSAs has not been investigated.
In this study, we evaluated activity of the AKT/mTOR signaling pathway in advanced metastatic NETs and identify tissue-based predictive biomarkers of response to therapy with SSAs.
Materials and methods
Patients and tissue samples
This clinical study was single-center, retrospective, and included samples obtained from a cohort of 23 patients with metastatic NET followed at the Department of Medical Oncology, Hospital de Santa Maria (HSM), Lisbon. Inclusion criteria were histological diagnosis of NET, stage IV disease according to the American Joint Committee on Cancer, more than 18 years old, and clinical history of treatment with the SSAs octreotide or lanreotide with available data on medical records regarding progression-free survival (PFS) after start-ing treatment with SSAs. We examined formalin-fixed and paraffin-embedded samples of primary tumors or metastasis available in the Pathology Archive of HSM. The follow-ing clinicopathological parameters were recorded for each patient: age, sex, time of diagnosis, localization of primary tumor, site of metastasis, Ki-67 proliferation index, carcinoid syndrome at time of diagnosis, and positivity/negativity for somatostatin receptors upon octreoscan scintigraphy. PFS was defined as the time to progression after the beginning of treatment with SSAs.
The study was approved by the Ethics Committee of HSM in December 2009. Informed consent was obtained from all patients. All specimens were handled and made anonymous according to ethical and legal standards.
Immunohistochemical analysis
Briefly, 2.5-micron formalin-fixed and paraffin-embedded tissue sections, placed on positively charged slides, were deparaffinized in xylene, rehydrated using graded alcohol, and transferred to phosphate-buffered saline solution (PBS). Microwave antigen retrieval was performed using a Tris-based buffer solution, pH 9.0 (S2367; Dako, Glostrup, Denmark) at 900 W for 30 minutes. Endogenous peroxidase activity was blocked by incubating the slides in 1.5% (v/v) hydrogen peroxide in methanol for 10 minutes at room temperature. After rinsing, slides were incubated with primary antibodies for 30 minutes at room temperature. The following antibodies were used: anti-phospho-S6 ribosomal protein (Ser240/244) rabbit polyclonal antibody (#2215; Cell Signaling Technology, Danvers, MA; 1:80 dilution), anti-phospo-AKT (Ser473) rabbit monoclonal antibody (736E11, #3787; Cell Signaling Technology; 1:20 dilution), and anti- phosphatase and tensin homolog (PTEN) mouse monoclonal antibody (clone 28H6; Novocastra, Newcastle, UK; 1:30 dilution).
rabbit/mouse (K5007; Dako) according to the manufacturer’s instructions. Slides were then counterstained using Harris’s hematoxylin, dehydrated, and mounted with Entellan®
(Merck & Co, Whitehouse Station, NJ).
As a positive control for p-AKT (Ser473) and p-S6 (Ser240/244) immunostaining, a breast tumor sample was used since the mTOR pathway is frequently activated in breast cancer.18 As a negative control, primary antibodies
were omitted.
Quantification and statistical analysis
For immunohistochemistry quantification, a semi-quantitative scoring index was established, which combined the intensity of staining (weak [1], moderate [2], and strong [3]) and the percentage of stained cells (0% [0]; 1%–25% [1]; 25%–50% [2]; 50%–75% [3]; 75%–100% [4]). The final score was assigned according to four categories: absent (0), weak (1–4), moderate (6–8) and strong (9–12), and was then dichotomized between low p-AKT or p-S6 expression (negative or weak staining) and high p-AKT or p-S6 expression (moderate or strong staining).Statistical analysis was done with the software SPSS (Statistical Package for the Social Sciences) version 17.0 (IBM Corporation, Armonk, NY) and GraphPad Prism 5.03 (GraphPad Software, Inc, La Jolla, CA). Comparison of clini-copathological characteristics between subjects expressing high or low p-AKT and p-S6 was made using the Fisher’s exact test and Chi-squared test when appropriate. Age was compared between groups using the Mann–Whitney U test. PFS rates were estimated using the Kaplan–Meier method and difference in survival curves were analyzed using the log-rank test. Significance was defined by a P-value of less than 0.05.
Results
Clinical and pathological variable analysis
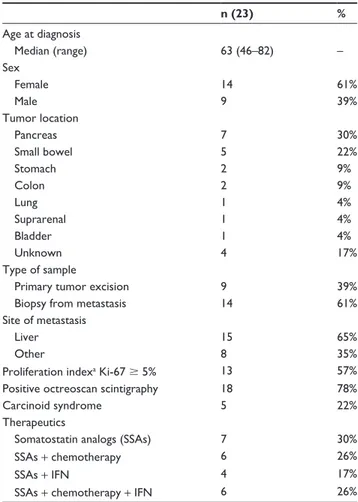
Twenty-three patients with advanced metastatic neuroendocrine carcinoma, 9 male and 14 female, ranging in age from 46 to 82 years (median age, 63 years), and enrolled from January 2000 to June 2010, were included in this study. Primary tumors were localized to the pancreas (7), small bowel (5), stomach (2), colon (2), lung (1), suprarenal (1), and bladder (1). The median duration of treatment with SSAs was 18 months (range 1–78 months). Twenty-two patients were treated with octreotide and one was treated with lanreotide.
The clinicopathological data of the patients are sum-marized in Table 1.
Table 1 Demographic, clinical, and pathological data of patients
included in this study
n (23) %
Age at diagnosis
Median (range) 63 (46–82) –
Sex
Female 14 61%
Male 9 39%
Tumor location
Pancreas 7 30%
Small bowel 5 22%
Stomach 2 9%
Colon 2 9%
Lung 1 4%
Suprarenal 1 4%
Bladder 1 4%
Unknown 4 17%
Type of sample
Primary tumor excision 9 39%
Biopsy from metastasis 14 61%
site of metastasis
Liver 15 65%
Other 8 35%
Proliferation indexa Ki-67 $ 5% 13 57%
Positive octreoscan scintigraphy 18 78%
Carcinoid syndrome 5 22%
Therapeutics
Somatostatin analogs (SSAs) 7 30%
SSAs + chemotherapy 6 26%
SSAs + IFN 4 17%
SSAs + chemotherapy + IFN 6 26%
Note: aProliferation index was measured by Ki-67 immunohistochemistry according
to standard protocols in the Department of Pathology, hsM, hospital de santa Maria.
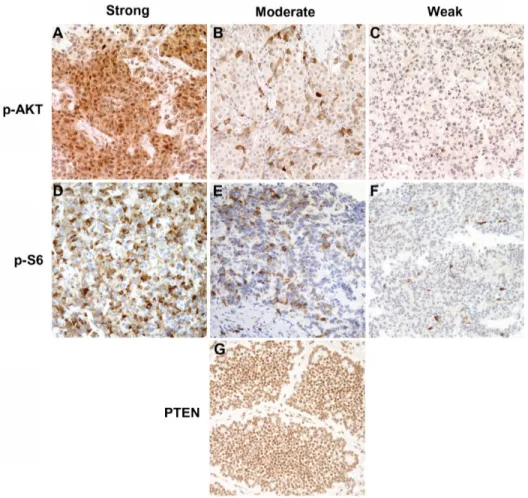
p-AKT, p-s6, and PTEN expression
in NETs
Figure 1 Immunohistochemical staining of phosphorylated AKT, p-AKT(ser473) phosphorylated s6, p-s6(ser240/244), and PTEN in neuroendocrine tumor samples using epitope-specific antibodies. (A–C) Representative images of p-AKT immunohistochemistry with anti-p-AKT(ser473) antibody showing strong (A), moderate (B), and weak (C) staining. (D–F) Representative images of p-s6 immunohistochemistry with anti-p-s6(ser240/244) antibody showing strong (D), moderate (E), and weak (F) staining. (G)
PTEN immunohistochemistry with anti-PTEN showing strong staining.
Note: Original magnification: ×200.
Abbreviation: PTEN, phosphatase and tensin homolog.
Immunohistochemical analysis samples without primary antibodies showed no staining.
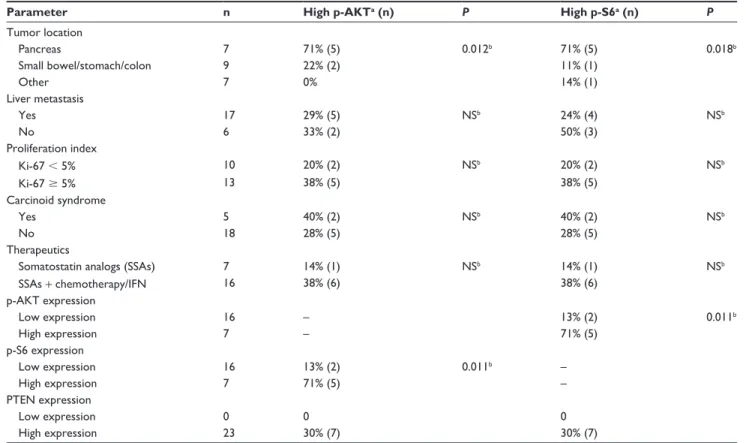
Association of p-AKT and p-s6
expression with clinicopathological
characteristics of NETs
Table 2 summarizes the association of p-AKT and p-S6 immunostaining with the clinicopathological parameters of the NETs examined. A significant positive association was observed between p-AKT and p-S6 expression. Five tumors with high p-AKT expression (71%) also showed high p-S6 expression (P= 0.01) (Table 2). p-AKT and p-S6 expression showed a positive association with primary tumor location; significantly higher expression of p-AKT and p-S6 was observed in pancreatic NETs versus tumors of non-pancreatic origin (P= 0.01 and P= 0.02, respectively). No other clini-copathological parameter showed significant correlation with p-AKT and/or p-S6 expression.
Correlation of p-AKT and p-s6
expression with PFS under SSA therapy
At the end of the follow-up period (June 2010), disease pro-gression was observed in 19 of the 23 patients under SSA treat-ment (83%); the median PFS was 9 months (range 1–36).
However, when the dichotomized high/low expres-sion groups were considered, patients highly expressing p-AKT(Ser743) and p-S6(Ser240/244) showed a significantly shorter PFS than those with low expression (log-rank test, P= 0.02 for both markers) (Figure 2A and B). Higher stain-ing of p-AKT or p-S6 predicted a median PFS of 1 month versus 26.5 months for lower expression.
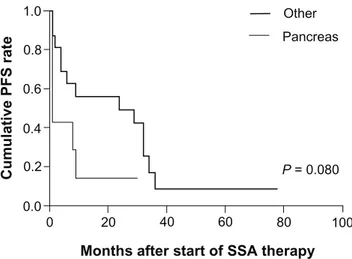
between the two groups was not statistically significant (log-rank test, P= 0.08). Furthermore, in the subgroup of pancreatic NETs, median PFS was 1 month vs 19.5 months for higher and lower p-AKT expression, respectively (P= 0.023).
In this study, we found no correlation between Ki-67 proliferative index and PFS using a Ki-67 cut-off of 5% (log-rank test, P= 0.69).
Discussion
In this retrospective study, we sought to evaluate the baseline activation status of the AKT/mTOR signaling pathway in advanced metastatic NETs and identify factors predictive of response to therapy with SSAs.
Immunohistochemical analysis of p-AKT(Ser473), p-S6(Ser240/244), and PTEN expression was assessed in a cohort of 23 tumor samples, including NETs from seven
Table 2 Correlation between p-AKT(ser473) and p-s6(ser240/244) expression and clinicopathological parameters
Parameter n High p-AKTa (n) P High p-S6a (n) P Tumor location
Pancreas 7 71% (5) 0.012b 71% (5) 0.018b
small bowel/stomach/colon 9 22% (2) 11% (1)
Other 7 0% 14% (1)
Liver metastasis
Yes 17 29% (5) NSb 24% (4) NSb
No 6 33% (2) 50% (3)
Proliferation index
Ki-67 , 5% 10 20% (2) NSb 20% (2) NSb
Ki-67 $ 5% 13 38% (5) 38% (5)
Carcinoid syndrome
Yes 5 40% (2) NSb 40% (2) NSb
No 18 28% (5) 28% (5)
Therapeutics
Somatostatin analogs (SSAs) 7 14% (1) NSb 14% (1) NSb
SSAs + chemotherapy/IFN 16 38% (6) 38% (6)
p-AKT expression
Low expression 16 – 13% (2) 0.011b
High expression 7 – 71% (5)
p-s6 expression
Low expression 16 13% (2) 0.011b –
High expression 7 71% (5) –
PTEN expression
Low expression 0 0 0
High expression 23 30% (7) 30% (7)
Notes: ahigh p-AKT and p-s6 expression correspond to moderate/strong staining score; bFisher’s exact test was used for hypothesis-testing of the relationship between
categorical variables and p-AKT or p-s6 expression.
Abbreviation: Ns, nonsignificant.
1.0
0.8
0.6
0.4
0.2
0.0
0 20 40 60 80 100
Months after start of SSA therapy
Cumulative PFS rate
p-AKT low p-AKT high
P= 0.019
1.0
0.8
0.6
0.4
0.2
0.0
0 20 40 60 80 100
Months after start of SSA therapy
Cumulative PFS rate
p-S6 low p-S6 high
P= 0.021
B A
Figure 2 Kaplan–Meier progression-free survival curves for patients undergoing treatment with ssAs according to p-AKT (A) and p-s6 (B) expression scores.
Notes: Low p-AKT and p-s6 corresponds to absent/weak staining score; high p-AKT and p-s6 corresponds to moderate/strong staining score. P-values were calculated
using a log-rank test.
different anatomical sites of origin. Phosphorylation of AKT at Ser473 has been widely studied as a marker of AKT signaling pathway activity, while the phosphorylation targets of mTOR, such as S6 ribosomal protein phospho-rylation at the Ser240/244 site, are preferred endpoints for assessing mTOR activity.19 Our results show that most
tumors exhibited p-AKT and p-S6 expression (14/23 and 18/23, respectively) as a result of AKT/mTOR pathway activation. Higher expression of either p-AKT or p-S6 was observed in pancreatic NETs and a significant positive asso-ciation between p-AKT and p-S6 expression was identified. Additionally, we found evidence of AKT/mTOR signaling activation without PTEN loss, an observation that has been also reported by Meric-Bernstam et al based on immuno-histochemical analysis of 25 NET samples.20 Although
previous studies have reported a frequency of PTEN loss between 10% and 29% in pancreatic NETs,21,22 all 23 tumor
samples evaluated in this study showed moderate/strong PTEN staining. Loss of PTEN is one of the main causes of AKT/mTOR pathway activation; however, there are other known mechanisms responsible for activating this signal-ing pathway, such as PTEN mutations, AKT amplification, and mutations of the p110 and p85 subunits of PI3K.23 The
investigation of the mechanism(s) involved in activating the AKT/mTOR pathway in these patients will be examined in future studies.
Although the activity of the AKT/mTOR pathway and its prognostic relevance have been evaluated for many dif-ferent cancer types (eg, renal cell carcinoma,24 sarcoma,25
breast cancer,18,26 hepatocellular carcinoma27), only a few
prior studies have examined AKT/mTOR activity in NETs.
Expression of phosphorylated mTOR (p-mTOR) was analyzed in a series of 20 gastropancreatic NETs, and a higher expression rate of p-mTOR was observed in poorly differentiated tumors.16 In a large study examining
expres-sion of mTOR pathway components in lung NETs, the authors reported overexpression of p-4EBP1 in high-grade tumors, whereas p-mTOR and p-S6K were highly expressed in low-grade tumors.28 In another study, expression of
phosphorylated mTOR, 4EBP1, and ribosomal protein S6 was evaluated together with the expression of somatostatin receptors, extracellular regulated kinase, and insulin-like growth factor 1 receptor. Hierarchical clustering analysis of immunohistochemical data led to the classification of NETs into 3 distinctive subgroups with potential biological significance.29 These three studies were mainly descriptive
and the association between expression levels of the proteins investigated with clinicopathological variables and outcomes was not addressed.
Recently, Kasajima et al reported the expression of mTOR as well as the phosphorylation of its downstream targets, 4EBP1, p70S6K, and eIF4E, in a cohort of 99 human gastro-enteropancreatic NETs. The authors reported positive mTOR expression in 61% of tumors and higher mTOR expression levels when distant metastases were present. They also reported higher p-S6K expression associated with shortened disease-specific survival in patients with stage IV mid-gut tumors.17
We identified AKT/mTOR signaling activation, par-ticularly p-AKT and p-S6 levels, to be prognostic markers of disease-free survival in advanced metastatic NETs under treatment with SSAs. We showed that tumors with higher p-AKT(Ser743) or p-S6(Ser240/244) expression levels pro-gressed faster in patients undergoing treatment with SSAs; higher staining of p-AKT or p-S6 predicted a median PFS of 1 month versus 26.5 months for lower expression. In the past year, the molecular mechanisms of mTOR inhibitors in patients with progressive advanced pancreatic NETs12–14 have
begun to be elucidated. A gene expression profile study con-ducted in a large panel of sporadic pancreatic NETs revealed that TSC2 and PTEN, two key inhibitors of the AKT/mTOR pathway, were downregulated in most of the primary tumors. The authors further reported a significant association between low TSC2 and PTEN expression and an increased rate of cell proliferation and shortened progression-free and overall survival.30 Recently, Jiao et al used an exome sequencing
strategy to identify recurrent somatic mutations in pancreatic NETs and found that 14% of tumor samples analyzed con-tained mutations in mTOR pathway genes, including TSC2, 1.0
0.8
0.6
0.4
0.2
0.0
0 20 40 60 80 100
Months after start of SSA therapy
Cumulative PFS rate
Other
Pancreas
P= 0.080
Figure 3 Kaplan–Meier PFs curves for patients undergoing treatment with ssAs
according to primary tumor localization. Note: P-value was calculated using a log-rank test.
PTEN, and PI3K.31 Our results correlate with these findings,
supporting the role of the PI3K/AKT/mTOR pathway in NETs progression, and further support the hypothesis that expression and activity patterns of AKT/mTOR in NETs can be used to predict response to therapy.
The tumor proliferative index assessed using Ki-67 immu-nohistochemistry has been considered a standard marker for therapeutic decisions in NETs. Based on the results of a prospective phase IV trial designed to assess the efficacy of octreotide in advanced nonfunctioning pancreatic NET, it was suggested that a Ki-67 index $ 5% and/or the presence of weight loss could justify more aggressive therapy without waiting for radiologically proven progression of disease.32 In
this study, no clear association was observed between Ki-67 proliferation index and response to octreotide or lanreotide therapy when a cut-off value of 5% was considered, likely because of the low number of patients examined. In our study, the decision to prescribe SSAs was not supported by the Ki-67 index alone, but was also based on the presence of hormonal syndrome. Furthermore, a significant proportion of patients received other treatments (such as chemotherapy) in addition to SSAs during the time course of the disease.
Conclusion
Our data strongly suggest that constitutive activation of the AKT/mTOR pathway in NETs is associated with a shorter time to progression in patients undergoing treat-ment with SSAs. We showed that high expression of either p-AKT(Ser473) or p-S6(Ser240/244) predicts shorter PFS in a series of advanced metastatic NETs. Due to the small size and heterogeneity of the series analyzed, this study was only hypothesis-generating and must be expanded to a larger cohort. Further studies of additional case series will allow validation of p-AKT(Ser473) and p-S6(Ser240/244) as prognostic markers of response to therapy with SSAs, and an investigation of the clinical applicability of these markers will aid in the selection of patients who will most likely benefit from SSAs and mTOR inhibitors in combination.
Acknowledgments
We thank our patients who contributed to this study. This work was partially supported by a grant provided by Novartis Oncology in Portugal and from the association for research and development of the school of medicine in Lisbon. The funders had no part in data collection and analysis, interpreta-tion of data, or writing the paper.
Disclosure
The authors report no conflicts of interest in this work.
References
1. Yao JC, Hassan M, Phan A, et al. One hundred years after “carcinoid”: epidemiology of and prognostic factors for neuroendocrine
tumors in 35,825 cases in the United States. J Clin Oncol. 2008;
26(18):3063–3072.
2. Öberg KE. Gastrointestinal neuroendocrine tumors. Ann Oncol. 2010;
21 Suppl 7:vii72–vii80.
3. Eriksson B, Oberg K. Summing up 15 years of somatostatin analog
therapy in neuroendocrine tumors: future outlook. Ann Oncol. 1999;
10 Suppl 2:S31–S38.
4. Moreno A, Akcakanat A, Munsell MF, Soni A, Yao JC, Meric-Bernstam F. Antitumor activity of rapamycin and octreotide as single agents or
in combination in neuroendocrine tumors. Endocr Relat Cancer.
2008;15(1):257–266.
5. Grozinsky-Glasberg S, Shimon I, Korbonits M, Grossman AB. Somatostatin analogs in the control of neuroendocrine tumours: efficacy
and mechanisms. Endocr Relat Cancer. 2008;15(3):701–720.
6. Rinke A, Müller HH, Schade-Brittinger C, et al. Placebo-controlled, double-blind, prospective, randomized study on the effect of octreotide LAR in the control of tumor growth in patients with metastatic neu-roendocrine midgut tumors: a report from the PROMID Study Group.
J Clin Oncol. 2009;27(28):4656–4663.
7. Pyronnet S, Bousquet C, Najib S, Azar R, Laklai H, Susini C. Antitumor
effects of somatostatin. Mol Cell Endocrinol. 2008;286(1–2):230–237.
8. Charland S, Boucher MJ, Houde M, Rivard N. Somatostatin inhibits Akt phosphorylation and cell cycle entry, but not p42/p44 mitogen-activated protein (MAP) kinase activation in normal and tumoral pancreatic acinar
cells. Endocrinology. 2001;142(1):121–128.
9. Theodoropoulou M, Zhang J, Laupheimer S, et al. Octreotide, a soma-tostatin analog, mediates its antiproliferative action in pituitary tumor cells by altering phosphatidylinositol 3-kinase signaling and inducing
Zac1 expression. Cancer Res. 2006;66(3):1576–1582.
10. Grozinsky-Glasberg S, Franchi G, Teng M, et al. Octreotide and the mTOR inhibitor RAD001 (everolimus) block proliferation and interact with the Akt-mTOR-p70S6K pathway in a neuro-endocrine tumour cell
Line. Neuroendocrinology. 2008;87(3):168–181.
11. Dancey JE. Therapeutic targets: MTOR and related pathways. Cancer
Biol Ther. 2006;5(9):1065–1073.
12. Yao JC, Phan AT, Chang DZ, et al. Efficacy of RAD001 (everolimus) and octreotide LAR in advanced low- to intermediate-grade
neuroendocrine tumors: results of a phase II study. J Clin Oncol.
2008;26(26):4311–4318.
13. Yao JC, Lombard-Bohas C, Baudin E, et al. Daily oral everolimus activity in patients with metastatic pancreatic neuroendocrine tumors
after failure of cytotoxic chemotherapy: a phase II trial. J Clin Oncol.
2010;28(1):69–76.
14. Yao JC, Shah MH, Ito T, et al. Everolimus for advanced pancreatic
neuroendocrine tumors. N Engl J Med. 2011;364(6):514–523.
15. Shah MH, Lombard-Bohas C, Ito T, et al. Everolimus in patients with advanced pancreatic neuroendocrine tumors (pNET): Impact of soma-tostatin analog use on progression-free survival in the RADIANT-3
trial. J Clin Oncol. 2011;29(Suppl):Abstr 4010.
16. Shida T, Kishimoto T, Furuya M, et al. Expression of an activated mam-malian target of rapamycin (mTOR) in gastroenteropancreatic
neuroen-docrine tumors. Cancer Chemother Pharmacol. 2010;65(5):889–893.
17. Kasajima A, Pavel M, Darb-Esfahani S, et al. mTOR expression and activity patterns in gastroenteropancreatic neuroendocrine tumours.
Endocr Relat Cancer. 2011;18(1):181–192.
18. Akcakanat A, Sahin A, Shaye AN, Velasco MA, Meric-Bernstam F. Comparison of Akt/mTOR signaling in primary breast tumors and
OncoTargets and Therapy
Publish your work in this journal
Submit your manuscript here:http://www.dovepress.com/oncotargets-and-therapy-journal
OncoTargets and Therapy is an international, peer-reviewed, open access journal focusing on the pathological basis of all cancers, potential targets for therapy and treatment protocols employed to improve the management of cancer patients. The journal also focuses on the impact of management programs and new therapeutic agents and protocols on
patient perspectives such as quality of life, adherence and satisfaction. The manuscript management system is completely online and includes a very quick and fair peer-review system, which is all easy to use. Visit http://www.dovepress.com/testimonials.php to read real quotes from published authors.
19. Cloughesy TF, Yoshimoto K, Nghiemphu P, et al. Antitumor activity of rapamycin in a Phase I trial for patients with recurrent PTEN-deficient
glioblastoma. PLoS Med. 2008;5(1):e8.
20. Meric-Bernstam F, Rashid A, Crosby K, et al. Biomarker analysis for the phase II study of RAD001 (everolimus) and depot octreotide (Sandostatin LAR) in advanced low grade neuroendocrine carcinoma.
World J Gastroenterol. 2008;14(16):2461–2473.
21. Chung DC, Brown SB, Graeme-Cook F, et al. Localization of putative tumor suppressor loci by genome-wide allelotyping in human pancreatic
endocrine tumors. Cancer Res. 1998;58(16):3706–3711.
22. Perren A, Komminoth P, Saremaslani P, et al. Mutation and expression analyses reveal differential subcellular compartmentalization of PTEN
in endocrine pancreatic tumors compared to normal islet cells. Am J
Pathol. 2000;157(4):1097–1103.
23. Liu P, Cheng H, Roberts TM, Zhao JJ. Targeting the phosphoinositide
3-kinase pathway in cancer. Nat Rev Drug Discov. 2009;8(8):
627–644.
24. Pantuck AJ, Seligson DB, Klatte T, et al. Prognostic relevance of the mTOR pathway in renal cell carcinoma: implications for
molecu-lar patient selection for targeted therapy. Cancer. 2007;109(11):
2257–2267.
25. Iwenofu OH, Lackman RD, Staddon AP, Goodwin DG, Haupt HM, Brooks JS. Phospho-S6 ribosomal protein: a potential new predictive
sarcoma marker for targeted mTOR therapy. Mod Pathol. 2008;21(3):
231–237.
26. Aleskandarany MA, Rakha EA, Ahmed MA, Powe DG, Ellis IO, Green AR. Clinicopathologic and molecular significance of phospho-Akt
expression in early invasive breast cancer. Breast Cancer Res Treat.
2011;127(2):407–416.
27. Zhou L, Huang Y, Li J, Wang Z. The mTOR pathway is associated with
the poor prognosis of human hepatocellular carcinoma. Med Oncol.
2010;27(2):255–261.
28. Righi L, Volante M, Rapa I, et al. Mammalian target of rapamycin signaling activation patterns in neuroendocrine tumors of the lung.
Endocr Relat Cancer. 2010;17(4):977–987.
29. Iida S, Miki Y, Ono K, et al. Novel classification based on immuno-histochemistry combined with hierarchical clustering analysis in
non-functioning neuroendocrine tumor patients. Cancer Sci. 2010;101(10):
2278–2285.
30. Missiaglia E, Dalai I, Barbi S, et al. Pancreatic endocrine tumors:
expression profiling evidences a role for AKT-mTOR pathway. J Clin
Oncol. 2010;28(2):245–255.
31. Jiao Y, Shi C, Edil BH, et al. DAXX/ATRX, MEN1, and mTOR path-way genes are frequently altered in pancreatic neuroendocrine tumors.
Science. 2011;331(6021):1199–1203.
32. Butturini G, Bettini R, Missiaglia E, et al. Predictive factors of efficacy of the somatostatin analog octreotide as first line therapy for advanced
pancreatic endocrine carcinoma. Endocr Relat Cancer. 2006;13(4):
1213–1221.