Cop
yright
© ABE&M t
odos os dir
eit
os r
eser
vados
.
Frequency and risk factors
associated with non-alcoholic
fatty liver disease in patients
with type 2
diabetes mellitus
Frequência e fatores de risco associados à doença hepática gordurosa não alcoólica em pacientes com diabetes melito tipo 2
Vera S. G. Ferreira1, Ricardo B. Pernambuco1, Edmundo P. Lopes1,
Clarice N. Morais2, Marbiana C. Rodrigues3, Maria Juliana Arruda1,
Lidiane Moura e Silva1, Lucio Vilar1
absTRacT
Objective: To evaluate the frequency of non-alcoholic fatty liver disease (NAFLD) in patients with type 2 diabetes mellitus (DM2) and to describe its risk factors. Subjects and methods: Blood samples of 78 patients were collected for assessment of glycemic and lipid proile, li-ver enzymes, TNF-α and HOMA-IR. The diagnosis of NAFLD was established by ultrasound. Re-sults: NAFLD was observed in 42% of patients who had greater BMI (p < 0.001), and frequency of hypertension (p < 0.001). Metabolic syndrome was more frequent in those with NAFLD (p = 0.019). The levels of aspartate, alanine aminotransferase, γ-glutamyl transpeptidase, uric acid, TNF-α, insulin and HOMA-IR were signiicantly higher in patients with NAFLD than those without NAFLD. Conclusion: Almost half of patients with DM2 were found to have NAFLD, and they have more elevated BMI, as well as higher levels of aminotransferases, γ-GT, uric acid, TNF-α, insulin and HOMA-IR than subjects without NAFLD. Arq Bras Endocrinol Metab. 2010;54(4):362-8
Keywords
NAFLD; diabetes mellitus; insulin resistance; HOMA-IR; TNF-α
Resumo
Objetivo: Avaliar a frequência de doença hepática gordurosa não alcoólica (DHGNA) em pa-cientes com diabetes mellitus tipo 2 (DM2) e descrever seus fatores de risco. Sujeitos e méto-dos: Amostras de sangue foram coletadas de 78 pacientes para avaliação dos peris glicídico e lipídico, enzimas hepáticas, TNF-α e HOMA-IR. O diagnóstico de DHGNA foi estabelecido por ultrassonograia. Resultados: NAFLD foi observada em 42% dos pacientes que apresentaram maior IMC (p < 0,001). Hipertensão arterial sistêmica (p < 0,001) e síndrome metabólica foram mais frequentes naqueles com DHGNA (p = 0,019). Os níveis de aspartato aminotransferase, alanina aminotransferase, γ-glutamil transpeptidase, ácido úrico, TNF-α, insulina e HOMA-IR foram signiicativamente maiores nos pacientes com do que naqueles sem DHGNA. Conclu-são: Quase metade dos pacientes com DM2 apresentaram DHGNA, os quais tiveram IMC mais elevado, bem como maiores níveis de aminotransferases, γ-GT, ácido úrico, TNF-α, insulina e HOMA-IR do que os indivíduos sem DHGNA. Arq Bras Endocrinol Metab. 2010;54(4):362-8
Descritores
DHGNA; diabetes melito; resistência insulínica; HOMA-IR; TNF-α 1 Departamento de Medicina
Clínica, Universidade Federal de Pernambuco (UFPE), Recife, PE, Brazil
2 Centro de Pesquisa Aggeu
Magalhães, Fundação Oswaldo Cruz (Fiocruz), Recife, PE, Brazil
3 Laboratório Central do
Hospital das Clínicas (HC), UFPE, Recife, PE, Brazil
Correspondence to:
Vera S. G. Ferreira
Rua Antonio Novais, 53, ap. 702 52050-280 – Recife, PE, Brazil [email protected]
Received on Oct/22/2009 Accepted on Mar/3/2010
inTRoDucTion
N
on-alcoholic fatty liver disease (NAFLD) is con-sidered one of the most common liver diseases in the Western world affecting around one third of the general population and may be linked to conditions ofinsulin resistance (IR) such as type 2 diabetes mellitus
(DM2), obesity, and dyslipidemia (1).
Cop
yright
© ABE&M t
odos os dir
eit
os r
eser
vados
.
a further 5 million remain undiagnosed (2). In Brazil, close to 8% of the population suffer from DM2 and the incidence is steadily increasing (3). Even if estimations for the prevalence of obesity in the year 2030 remain stable, the number of diabetic patients is bound to dou-ble as a consequence of an overall increase in the age of the population and in urbanization (4).
NAFLD is characterized by the accumulation of liver fat without the consumption of alcohol (5). Obtaining knowledge regarding its actual prevalence is somewhat dificult since the great majority of patients is asympto-matic. Diagnosis is based on imaging methods (ultra-sonography, CT scan or magnetic resonance imaging), although, the gold standard method is histopathology. Histopathological aspects vary from simple steatosis (the presence of fat in more than 5% of the hepatocytes) to steatosis associated to inlammation (steatohepatitis), which may evolve into progressive ibrosis, cirrhosis, and hepatocellular carcinoma (6). Physiopathology is linked to IR in the liver, muscles, and adipose tissue, associated to lipid accumulation in ectopic sites, a condition refer-red to as lipotoxicity. In many cases of NAFLD, the risk of developing metabolic and cardiovascular morbidities is much higher than other liver diseases (7).
NAFLD is considered to be a hepatic expression of metabolic syndrome (MS) and recent studies have pointed to DM2 as an aggravating factor for liver ibro-sis irrespective of other MS factors (8,9). Liver disease in patients with NAFLD and DM2 is more intense and carries a greater risk of developing into cirrhosis and a higher mortality rate (10,11).
A population study in Verona found that liver disease was a relevant cause of death in patients with DM2. Other studies have revealed that the association of diabetes with NAFLD also constitutes a cardiovascular risk factor lea-ding to IR in the myocardium and coronary dysfunction (12-14). A further study found a greater association be-tween renal disease and NAFLD in DM2 patients (15).
The diagnosis of NAFLD in patients with DM2 is not only fundamental for the prevention of hepatic complications but also cardiovascular and renal impair-ment. Thus, the aim of this study is to evaluate the fre-quency of NAFLD in patients with DM2 and to descri-be the risk factors involved.
subJecTs anD meTHoDs
The study population
A total of 102 DM2 patients of both sexes, over 18 years of age, from the diabetes clinic at the Hospital das
Clínicas (HC), Universidade Federal de Pernambuco (UFPE) were included in the study. They were scre-ened during the period from July to December 2007.
The following exclusion criteria were adopted: con-sumption of alcohol > 20 g/day for males and > 10 g/day for females; the use of hepatotoxic drugs, such as corticosteroids, amiodarone, isoniazid or tamoxifen; markers for hepatitis B (HBsAg) or hepatitis C (anti-HCV) positive and the presence of any other liver dise-ase, such as Schistosoma mansoni infection (2,5).
Twenty four patients (24%) were excluded from the study, including 11 with periportal ibrosis resulting from Schistosoma mansoni infection conirmed through ultrasound scan (US), 4 presented viral markers for he-patitis, and 9 abandoned the study, thus, leaving a total of 78 patients. The study was approved by the Research Ethics Committee at the Center for Health Sciences of the UFPE. All selected patients were supplied with the relevant information in easily understandable langua-ge, after which they signed the Terms of Consent and Clariication.
methods
A standard questionnaire was applied by one researcher only in order to obtain details concerning age, sex, al-cohol consumption, smoking and exercise. During the physical examination, overweight or obese patients were characterized by body mass index (BMI) > 25 or > 30 kg/m2, respectively. Waist and hip measurements were also conferred, and visceral obesity was deined accor-ding to the waist/hip ratio ≥ 0.90 in males and ≥ 0.80 in females (16). Blood pressure was also taken with the patient in the supine position and levels above 130/85 mmHg were considered indicative of hypertension (17).
All patients were submitted to a US performed by the same researcher, using an Aloka SSD 500 de-vice with a 3.5 MHZ convex transducer to diagnose NAFLD. Criteria for diagnosing NAFLD were higher levels of echogenicity in the liver than in the renal cor-tex and spleen, hepatic US wave attenuation, poor de-inition of the diaphragm and a poor outline of the in-trahepatic vascularization (18).
Blood samples were taken from peripheral veins, and sent to the Central Laboratory at the HC-UFPE, where the below-mentioned tests were carried out.
estera-Cop
yright
© ABE&M t
odos os dir
eit
os r
eser
vados
.
se oxidase, triglycerides with oxidase and uric acid with colorimetric uricase. For HDL cholesterol (HDL-c), DiaSys reagent and precipitation methodology were employed and for LDL cholesterol (LDL-c) the Frie-dwald formula was employed. Glycated hemoglobin (HbA1c) was determined through colorimetry, using the method described by Zander and cols. (19).
Insulin level in serum samples was determined using the microparticle enzyme immunoassay (MEIA), Ab-bott AxSYM® system. The degree of IR was assessed using HOMA-IR (Homeostasis model assessment of insulin resistance), as previously described and the cut-off value for HOMA-IR was 2.5 (20).
Alanine aminotransferase (ALT); aspartate amino-transferase (AST); total bilirubin and direct bilirubin; alkaline phosphatase (AP) and gamma-glutamyl trans-peptidase (γ-GT) were determined with an automated
kinetic method (Abbott®).
The international normalized ratio of prothrom-bin time (INR) was determined with ISI and PT-Fib recombinant reagent and processed in an ACL 3000 apparatus with factory ISI. Ferritin was measured using the DiaSys reagent and employing chemiluminescent
microparticle immunoassay methodology (CMIA). Tumor Necrosis Factor Alpha (TNF-α) was
measu-red with EIA using Quantikine Human TNFα
/TNFS-F1A Immunoassay.
MS components were determined according to the International Diabetes Federation: central obesity (waist ≥ 90 cm for males or ≥ 80 cm for females), asso-ciated with at least two of the following features (17): Glucose levels ≥ 100 mg/dL or use of drugs for hyper-glycemia – (in the present study all patients fulill this criteria since they had diabetes mellitus); Triglyceride levels > 150 mg/dL or treatment for hypertriglyceri-demia; HDL cholesterol levels < 40 mg/dL in males and < 50 mg/dL in females; Blood pressure > 130/85 mmHg or speciic treatment.
statistical analysis
With the aim of characterizing the sample studied re-lative (%) and absolute (N) frequencies were employed for all classes of each qualitative variable. In order to verify the differences between the groups of different categories, the Pearson Chi-square test or the Fisher’s Exact Test were employed.
Mean values, standard deviations, minimums and maximums were used to indicate the quantitative va-riables of the data. In order to compare the groups,
the Mann-Whitney nonparametric test was applied to the variables: insulin, bilirubin, HbA1c, ferritin, fasting plasma glucose, AST, ALT, the AST/ALT ratio, γ-GT,
post-prandial plasma glucose, HOMA-R, and TNF-α,
since these did not present normal distribution.
The Student t-test was applied to the remaining quantitative variables.
Results considered statistically signiicant were tho-se with descriptive values (p-values) less than 0.05; and a conidence interval of 95%.
For the technical analysis the following software were employed: MSOfice Excel 2003 to administer the database, and “Statistical Package for the Social Sciences - SPSS for Windows 12.0” to execute the sta-tistical data, and to create and edit the graphs.
ResuLTs
Of the 78 patients evaluated, 54 (69%) were female and 24 (31%) were male, the mean age was 57 years, with a variation of 31 to 77 years; 33 patients (42%) presented NAFLD. In relation to the qualitative variables such as sex, alcohol consumption, smoking, exercise and hypertension, only hypertension was more frequent (p < 0.001) amongst patients with NAFLD (Table 1).
Table 1. Details illustrating clinical characteristics, demographics, habits and co-morbid conditions of 78 patients with type 2 diabetes mellitus, divided
into two groups with and without non-alcoholic fatty liver disease (NAFLD)
Variables n total = 78
nafLD
p-value absent
(n = 45)
Present (n = 33)
Sex
Female 54 (69.2%) 31 (68.9%) 23 (69.7%) 0.939Q
Alcohol
No 69 (88.5%) 39 (86.7%) 30 (90.9%) 0.726F
Smoking
No 74 (94.9%) 43 (95.6%) 31 (93.9%) > 0.999F
Exercise
No 42 (53.8%) 22 (48.9%) 20 (60.6%) 0.305Q
Hypertension
Yes 52 (66.7%) 22 (48.9%) 30 (90.9%) < 0.001F
F: Fisher’s Exact Test; Q: Pearson Chi-square test.
Patients with NAFLD presented higher weight (p < 0.001); BMI (p < 0.001), waist measurement (p < 0.001) and hip measurement (p < 0.001) than those without NAFLD, however, there was no signiicant di-fference between the waist to hip ratio (Table 2).
Cop
yright
© ABE&M t
odos os dir
eit
os r
eser
vados
.
A higher percentage of MS was encountered amon-gst those with NAFLD than those without NAFLD (94% vs. 73%; p = 0.019).
As shown in table 3, the values of AST (p = 0.006), ALT (p = 0.002), γ-GT (p = 0.001), uric acid (p =
0.041), insulin (p = 0.004), and HOMA-IR (p = 0.007) were signiicantly higher in patients with NAFLD than in those without NAFLD (p = 0.007). Triglycerides le-vels (p = 0.06) and TNF-α (p = 0.052) tended to be
higher in subjects with NAFLD. In contrast, there was no difference in cholesterol proile nor in the levels of
Table 2. Demographic and anthropometric characteristics of 78 patients with type 2 diabetes mellitus divided into two groups with and without
non-alcoholic fatty liver disease (NAFLD)
Variables average (sD)
Total
Variation (min-max)
nafLD
p-value
absent Present
Age (years) 57.3 (10.3) 31-77 57.1 ± 10.9 57.6 ± 9.5 0.818T
Weight (kg) 71.8 (14.4) 48-124 66.0 ± 11.7 79.8 ± 14.1 < 0.001T
Height (m) 1.6 (0.1) 1.4-1.8 1.5 ± 0.1 1.6 ± 0.1 0.039T
BMI (kg/m2) 29.5 (4.8) 20.6-39.7 27.7 ± 4.4 31.9 ± 4.3 < 0.001T
Waist (cm) 100.8 (11,8) 75-130 96.4 ± 11.0 106.8 ± 10.3 < 0.001T
Hip (cm) 104.4 (10.5) 85-149 100.3 ± 8.0 110 ± 11 < 0.001T
W/H 1.0 (0.1) 0.8-1.1 1.0 ± 0.1 1.0 ± 0.1 0.432T
BMI: body Mass Index; W/H-Waist/hip ratio. T: student-T test.
Table 3. Laboratory data of 78 patients with type 2 diabetes mellitus divided into two groups with and without non-alcoholic fatty liver disease (NAFLD)
Variable average (sD) Variation
(min-max)
nafLD
p-value
absent Present
Fasting glucose (mg/dL) 175.8 (74.2) 61.2-474 174.5 ± 81.3 177.7 ± 64.4 0.344MW
Post-prandial glucose (mg/dL) 217.6 (114.4) 87.4-575 225.9 ± 131.5 206 ± 85.3 0.672MW
HbA1c (mg/dL) 8.8 (2.7) 5.7-22.8 8.8 ± 3.0 8.8 ± 2.1 0.605MW
Total-c (mg/dL) 204.7 (49.5) 87.8-359.4 211.3 ± 51.5 195.9 ± 46.0 0.177T
HDL-c (mg/dL) 48.4 (10.4) 23.6-80.1 48.7 ± 9.9 48.0 ± 11.2 0.781T
LDL-c (mg/dL) 122.3 (41.3) 46-252 129.8 ± 42.4 112.2 ± 38.0 0.064T
Triglycerides (mg/dL) 164.1 (84.4) 35.4-455.6 148.7 ± 87.4 185 ± 76.4 0.060T
Uric acid (mg/dL) 4.4 (1.6) 2.0-7.9 4.1 ± 1.4 4.9 ± 1.8 0.041T
AST (U/L) 18.9 (5.7) 11-44 17.8 ± 6.0 20.3 ± 4.9 0.006MW
ALT (U/L) 21.8 (10.3) 7.0-65.0 19.1 ± 9.0 25.4 ± 11.0 0.002MW
AST/ALT 1.0 (0.4) 0.4-2.9 1.1 ± 0.5 0.9 ± 0.2 0.134MW
Alk. phosphatase (U/L) 93.8 (28.3) 42-176 95.1 ± 29.8 92.0 ± 26.4 0.635T
GGT (U/L) 50.5 (54.2) 13-337 39.1 ± 26.4 66.0 ± 59.4 0.001MW
Bilirubin (mg/dL) 0.5 (0.2) 0.1-1.3 0.5 ± 0.2 0.5 ± 0.3 0.284T
INR 1.0 (0.1) 0.9-1.2 1.0 ± 0.1 1.0 ± 0.1 0.197T
Ferritin (µg/L) 177.9 (164.9) 1.5-798 152.8 ± 137.5 212.2 ± 193.1 0.144MW
TNF-α (pg/mL) 10.9 ± 7.3 0.7-30.1 9.8 ± 7.8 12.4 ± 6.4 0.052MW
Insulin (mU/L) 14.8 ± 17.8 1.1-102.9 10.3 ± 10.4 20.9 ± 23.3 0.004MW
HOMA-IR 6.9 ± 12.0 0.5-96.9 4.4 ± 4.4 10.2 ± 17.4 0.007MW
Total-c: total cholesterol; HbA1c: glicated hemoglobin; INR: prothrombin time international normalized ratio; ALT: alanine aminotranferase; AST: aspartate aminotransferase; GGT: gamma-glutamyl transpeptidase; TNF-α: tumor necrosis factor alpha; HOMA-IR: homeostasis model assessment of insulin resistance; MW: Mann-Whitney; T: student-T test.
plasma fasting or post-prandial glucose, HbA1c, AP, bi-lirubins, INR or ferritin in both groups (Table 3).
Cop
yright
© ABE&M t
odos os dir
eit
os r
eser
vados
.
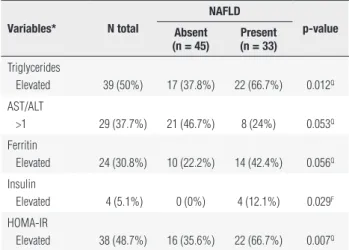
Table 4. Frequency of altered laboratory test results of 78 patients with ype 2 diabetes mellitus who presented differences when divided into two
groups with and without non-alcoholic fatty liver disease (NAFLD)
Variables* n total
nafLD
p-value absent
(n = 45)
Present (n = 33)
Triglycerides
Elevated 39 (50%) 17 (37.8%) 22 (66.7%) 0.012Q
AST/ALT
>1 29 (37.7%) 21 (46.7%) 8 (24%) 0.053Q
Ferritin
Elevated 24 (30.8%) 10 (22.2%) 14 (42.4%) 0.056Q
Insulin
Elevated 4 (5.1%) 0 (0%) 4 (12.1%) 0.029F
HOMA-IR
Elevated 38 (48.7%) 16 (35.6%) 22 (66.7%) 0.007Q
AST: aspartate aminotransferase; ALT: alanine aminotranferase; * Normal ranges: triglycerides ≤ 150 mg/dL; ALT: ≤ 41 U/L in male and ≤ 31 U/L in female; AST: ≤ 35 U/L in male and ≤ 31 U/L in female; Ferritin: ≤ 365 ng/mL in male and ≤ 148 ng/mL in female; Insulin: ≤ 23 mU/L; HOMA-IR ≤ 3.9 in male and ≤ 3.5 in female.
F: Fisher’s Exact Test; Q: Pearson Chi-square test.
Discussion
Previous research has identiied NAFLD in 21% to 78% of patients suffering from DM2 (21,22). The present study diagnosed NAFLD in 42% of the patients with DM2, although this frequency may have been even hi-gher, given that lower grade of NAFLD may go unno-ticed by US (2). US is around 90% sensitive and 100% speciic in diagnosing NAFLD (23).
Neither age nor sex presented any relation to the occurrence of NAFLD, neither did smoking or exerci-se, as conirmed by other studies (7,24-26). Other in-teresting data was the diagnosis of hypertension in the majority (90%) of patients with NAFLD, very probably related to the BMI, which was also higher in patients with NAFLD. It is worth noting that when NAFLD is associated with DM2, obesity, hypertension and dysli-pidemia there is an increased risk of it progressing to end-stage liver disease, and a greater chance of cardio-vascular diseases (7,27).
In the present study, increased weight, BMI and waist measurement were more prevalent in patients with NAFLD, situations in which the IR is a predo-minant factor (6,28). It should be highlighted that the researcher who diagnosed NAFLD using US may have been inluenced by the biotypes of the patients, thus identifying liver disease with greater frequency in overweight or obese patients. Despite this unavoidable bias, the examiner followed all ultrasonographic criteria in order to diagnose fatty liver disease (17).
Although MS was diagnosed in the majority of pa-tients within this study, it was more frequent in tho-se with NAFLD than thotho-se without (p = 0.019), as described above. These indings suggest that NAFLD constitutes the hepatic expression of MS and that when associated with visceral obesity and hypertension it may be employed as one of the diagnostic criteria for this syndrome (28,29).
In our study, no signiicant differences were encoun-tered amongst patients with or without NAFLD in rela-tion to levels of pre- and post-prandial glucose, HbA1c, cholesterol proile, AP, bilirubin and INR. Similar se-rum levels of blood glucose may be because all the pa-tients included in the two groups presented DM2. In addition, evaluating patients with non-alcoholic steato-hepatitis (NASH), Poynard and cols. (30) did not also ind differences in serum levels of cholesterol and biliru-bins among patients with and without NASH.
Higher levels of triglycerides were more observed in patients with NAFLD, which may possibly relect a gre-ater accumulation of fatty acid into the liver, higher IR and a greater tendency to develop into NASH (23). In fact, patients with DM2 present a particular type of dys-lipidemia with higher triglycerides and lower HDL-c levels, and patients with NAFLD also present the same lipid proile (31,32).
The blood levels of uric acid were higher in 33 pa-tients with NAFLD, and there were also described hi-gher levels of uric acid in patients with visceral adiposity and IR (33,34). A recent study described the associa-tion of NAFLD with hyperuricemia and a higher risk of coronary disease (35).
Also encountered in this study were signiicantly hi-gher levels of ALT, AST and γ-GT in patients with
Cop
yright
© ABE&M t
odos os dir
eit
os r
eser
vados
.
On the other hand, the mean serum levels of γ-GT
were above the normal limits in those with NAFLD. In effect, γ-GT is linked to sedentarism, obesity,
hyperten-sion, hyperinsulinemia, dyslipidemia, oxidative inlam-mation and stress (38). High concentrations of γ-GT
were also found in association with hypertension and central adiposity, suggesting a potentially pathogenic relationship between NAFLD, endothelial dysfunction and cardiovascular risk (38).
When the AST/ALT ratio is greater than the uni-ty, it is indicative of more advanced liver disease, with more intense ibrosis (6). No signiicant difference in the AST/ALT ratio of either group was encountered in this study, although there was a tendency for this ra-tio to alter, above the unity, in those without NAFLD, probably because of higher levels of ALT in patients with NAFLD (Table 4).
No differences were observed in the serum levels of ferritin between the two groups, although there was a more frequent tendency (p = 0.056) for altered le-vels in patients with NAFLD (Table 4). Higher lele-vels of ferritin were discovered in patients with increased visceral fat or MS and, when the higher levels of pro-tein were associated to advanced age, BMI > 30 kg/m2 and DM2, there was a greater risk of developing liver ibrosis (36,37,39).
HOMA-IR was used in this study as a method to evaluate the degree of IR. Its values were signiicantly higher in patients with NAFLD compared to those wi-thout NAFLD (p = 0.007). This inding relects a more accentuated degree of IR in patients with NAFLD, as has already been described in the literature (40,41).
Even in patients without DM2, the IR determined by HOMA-IR is associated to a higher grade of fat ac-cumulation in patients with NAFLD (42). IR exacerba-tes NAFLD by means of two mechanisms. Peripherally, through the compromised distribution of fatty acids, thus overloading the liver, and in the liver itself because of the alteration to lipid metabolism, where these fatty acids undergo extra-mitochondrial (abnormal) oxida-tion, leading to oxidative stress (43).
The release of reactive particles of oxygen generated in oxidative stress may increase mitochondrial damage in hepatocytes and expand extra-mitochondrial oxida-tion of fatty acids. They may also stimulate neighboring macrophages (Kupffer cells) and release TNF-α which
interferes with insulin sensitivity and increases its resis-tance (5). For the progression of NAFLD an alteration in the balance between two antagonic adipokines is
important, in other words, TNF-α and the
adiponec-tin, a hormone which acts to sensitize insulin, increa-ses smooth muscle glucose uptake, and free fatty acid oxidation, decreases hepatic glucose production and decreases intracellular triglycerides (41). TNF-α is the
cytokine that most contributes to liver damage (33). In NAFLD, serum levels of adiponectin are low, however, in some studies TNF-α serum levels are not elevated
(42,43). In this study, levels of TNF-α were slightly
higher in patients with NAFLD (p = 0.052).
In conclusion, our indings demonstrate that NA-FLD was diagnosed by US in almost half the patients with DM2. The risk factors associated to NAFLD were elevated weight, BMI and waist measurement, hyper-tension and metabolic syndrome, as well as higher le-vels of aminotransferases, γ-GT, uric acid, TNF-α,
in-sulin and HOMA-IR.
Disclosure: no potential conlict of interest relevant to this article was reported.
RefeRences
1. Bellentani S, Marino M. Epidemiology and natural history of non-alcoholic fatty liver disease (NAFLD). Ann Hepatol. 2009;8(1):S4-8. 2. Tolman KG, Fonseca V, Dalpiaz A, Tan MH. Spectrum of liver dise-ase in type 2 diabetes and management of patients with diabetes and liver disease. Diabetes Care. 2007;30(3): 734-43.
3. BRASIL. Ministério da Saúde. Multicenter study about the pre-valence of diabetes mellitus in Brazil. Accessed on: 2009 Mar 3. Available from: http://bases.bireme.br.
4. Wild S, Roglic G, Green A, Scref R, King H. Global prevalence of diabetes. Diabetes Care. 2004;27(5):1047-53.
5. Neuschwander-Tetri BA, Caldwell SH. Nonalcoholic steatohepati-tis: summary of an AASLD Single Topic Conference. Hepatology. 2003;37(5):1202-19.
6. Adams LA, Angulo P, Lindor KD. Nonalcoholic fatty liver disease. CMAJ. 2005;172(7):899-905.
7. Wang Y, Zhou M, Lam K, Xu A. Protective roles of adiponectin in obesity-related fatty liver diseases: mechanisms and therapeutic implications. Arq Bras Endocrinol Metabol. 2009;53(2):201-12. 8. Bugianesi E, Bellentani S, Bedogni G, Tiribelli C, Sigliat-Baroni G,
Crocè LS, et al. Clinical update on non-alcoholic fatty liver disease and steatohepatitis. Ann Hepatol. 2008;7(2):157-60.
9. Amarapurkar DN, Amarapurkar AD, Patel ND, Agal S, Baigal R, Gupte P, et al. Nonalcoholic steatohepatitis (NASH) with diabetes: predictors of liver disease. Ann Hepatol. 2006;5(1):30-3.
10. Prashanth M, Ganesh HK, Vimal MV, John M, Bangdar T, Joshi SR, et al. Prevalence of non-alcoholic fatty liver disease in patients with type 2 diabetes mellitus. JAPI 2009;57(3):205-10.
11. Garcia-Compean D, Jaquez-Quintana JO, Gonzalez-Gonzalez JA. Liver cirrhosis and diabetes: risk factores, pathophisiology, clinical implications and managment. World J Gastroenterol. 2009;15(3):280-8.
Cop
yright
© ABE&M t
odos os dir
eit
os r
eser
vados
.
13. Targher G, Bertolini L, Padovani R, Rodella S, Tessari R, Zenari L, et al. Prevalence of nonalcoholic fatty liver disease and its as-sociation with cardiovascular disease among type 2 diabetic pa-tients. Diabetes Care. 2007;30(5):1212-8.
14. Lautämaki R, Borra R, Iozzo P, Komu M, Lehtimaki T, Salmi M, et al. Liver steatosis coexists with myocardial insulin resistance and coronary dysfunction in patients with type 2 diabetes. Am J Phy-siol Enddocrinol Metab. 2006;291(2):E282-90.
15. Targher G, Bertolini L, Rodella S, Zoppin G, Lippi G, Day C, Mug-geo M. Non-alcoholic fatty liver disease is independently associa-ted with an increased prevalence of chronic kidney disease and proliferative/laser-treated retinopathy in type 2 diabetic patients. Diabetologia. 2008;51(3):444-50.
16. Chew GT, Gan SK, Watts GF. Revisiting the metabolic syndrome. MJA. 2006;185(8):445-9.
17. International Diabetes Federation 2005. IDF Consensus Worldwi-de Deinition of the Metabolic Syndrome. Accessed on: Mar 23 2009. Available from: http://www.idf.org.br.
18. Hamer WO, Aguirre DA, Casola G, Lavine JE, Woenckhaus M, Sir-lin CB. Fatty liver: imaging patterns and pitfalls. Radiographics. 2006;26(6):1637-53.
19. Zander R, Lang W, Wolf HU. Alkaline haematin D-575, a new tool for the determination of haemoglobin as an alternative to the cyanhaemiglobin method. I. Description of the method. Clin Chim Acta. 1984;136(1):83-93.
20. Geloneze B, Vasques AC, Stable CF, Pareja JC, Rosado LE, Quei-roz EC, et al. HOMA1-IR and HOMA2-IR indexes in identifying insulin resistance and metabolic syndrome: Brazilian Metabo-lic Syndrome Study (BRAMS). Arq Bras Endocrinol Metabol. 2009;53(2):281-7.
21. McCullough AJ. Update on nonalcoholic fatty liver disease. J Clin Gastroenterol. 2002;34(3):255-62.
22. Marchesini G, Brizi M, Bianchi G, Bianchi G, Bugianesi E, Mc-Cullough AJ, et al. Association of nonalcoholic fatty liver disease with insulin resistance. Am J Med. 1999(5);107:450-5.
23. Hamaguchi M, Kojima T, Itoh Y, Yuichi H, Kota F, Tomoaki N, et al. The severity of ultrasonographic inding in nonalcoholilic fatty liver disease relects the metabolic syndrome and visceral fat ac-cumulation. Am J Gastroenterol. 2007;102(12):2708-15.
24. Schreuder T, Verwer BJ, van Nieuwkerk MJC, Mulder JJC. No-nalcoholic fatty liver disease: an overview of current insights in pathogenesis, diagnosis and treatment. World J Gastroenterol. 2008;14(16):2474-86.
25. Kang H, Greenson JK, Omo JT, Chao C, Peterman D, Anderson L, et al. Metabolic syndrome is associated with greater histologic severity, higher carbohydrate, and lower fat diet in patients with NAFLD. Am J Gastroenterol. 2006;101(10):2247-53.
26. Bedogni G, Miglioli L, Matsutti F, Tiribelli C, Marchesini G, Bel-lentani. Prevalence of and risk factors for nonalcoholic fatty li-ver disease: the Dionysos nutrition and lili-ver study. Hepatology. 2005;42(1):44-52.
27. Lizardi-Cevera L, Aguilar-Zapata D. Nonalcoholic fatty liver disea-se and its association with cardiovascular didisea-seadisea-se. Ann Hepatol. 2009;8(1):S40-3.
28. Tarantino G. Should nonalcoholic fatty liver disease be regarded as a hepatic illness only? World J Gastroenterol. 2007;13(35):4669-72. 29. Kotronen A, Yki-Järvinen H. Fatty liver: a novel component of the me-tabolic syndrome. Arterioscler Thromb Vasc Biol. 2008;28(1):27-38. 30. Poynard T, Ratziu V, Charlotte F, Messous D, Munteanu M,
Im-bert-Bismut F, et al. Diagnostic value of biochemical markers (NashTest) for the prediction of non alcoholo steato hepatitis in patients with non-alcoholic fatty liver disease. BMC Gastroente-rol. 2006;6(11):34-50.
31. Adiels M, Olofsson SO, Taskinen MR, Boren J. Diabetic dyslipida-emia. Current Opin Lipidol. 2005;16:421-7.
32. Toledo GF, Sniderman DA, Kelley ED. Inluence of hepatic stea-tosis (fatty liver) on severity and composition of dyslipidemia in type 2 diabetes. Diabetes Care. 2006;29(8):1845-50.
33. Li Y, Xu C, Yu C, Xu L, Miao M. Association of serum uric acid le-vel with non-alcoholic fatty liver disease: a cross-sectional study. J Hepatol. 2009;50(5):1029-34.
34. Fenkci S, Rota S, Sabir N, Akdag B. Ultrasonographic and bioche-mical evaluation of visceral obesity in obese women with non-alcoholic fatty liver disease. Eur J Med Res. 2007;12(2):68-73. 35. Baba T, Amasaki Y, Soda M, Hida A, Imaizumi M, Nakashima E,
et al. Fatty liver and acid uric levels predict incident coronary heart disease but not stroke among atomic bomb survivous in Nagasaki. Hypertens Res. 2007;30(9):823-9.
36. Liangpunsakul S, Chalasani N. Unexplained elevations in alanine aminotransferase in individuals with the metabolic syndrome: re-sults from the Third National Health and Nutrition Survey (NHA-NES III). Am J Med Sci. 2005;32(3):111-6.
37. Prati D, Taioli E, Zanalla A, Della Torre E, Butelli S, Del Vecchio E, et al. Updated deinitions of healthy ranges for serum alanine ami-notransferase levels. Ann Int Med. 2002;137(1):1-9.
38. Stranges S, Trevisan M, Dorn JM, Dmochowski J, Donahue RP. Body distribution, liver enzymes, and risk of hypertension: evidence from the Western New York Study. Hypertension. 2005;46(5):1186-93.
39. Trombini P, Piperno A. Ferritin, metabolic syndrome and NA-FLD: elective attractions and dangerous liasions. J Hepatol. 2007;46(4):549-52.
40. Lyssenko V, Almgren P, Anevski D, Perfekt R, Lahti K, Nissén M, et al. Predictors of and longitudinal changes in insulin sensiti-vity and secretion preceding onset of type 2 diabetes. Diabetes. 2005;54(1):166-74.
41. Wajchenberg BL, Nery M, Cunha MR, Silva ME. Adipose tissue at the crossroads in the development of the metabolic sindrome, inlammation and aterosclerosis. Arq Bras Endocrinol Metabol. 2009;53(2):145-50.
42. Perez-Carreras M, Del Hoyo P, Marti MA, Rubio CJ, Martin A, Castellano G, et al. Defective hepatic mitochondrial respiratory chain in patients with nonalcoholic steatohepatitis. Hepatology. 2003;38(4):999-1007.